
Best Places to Invest
in Short-Term Rentals
in 2024
The 2024 outlook for short-term rental (STR) investments is optimistic. AirDNA expects growth in revenue per available room (RevPAR) and easing declines in overall STR market performance, despite challenges like increased home values.
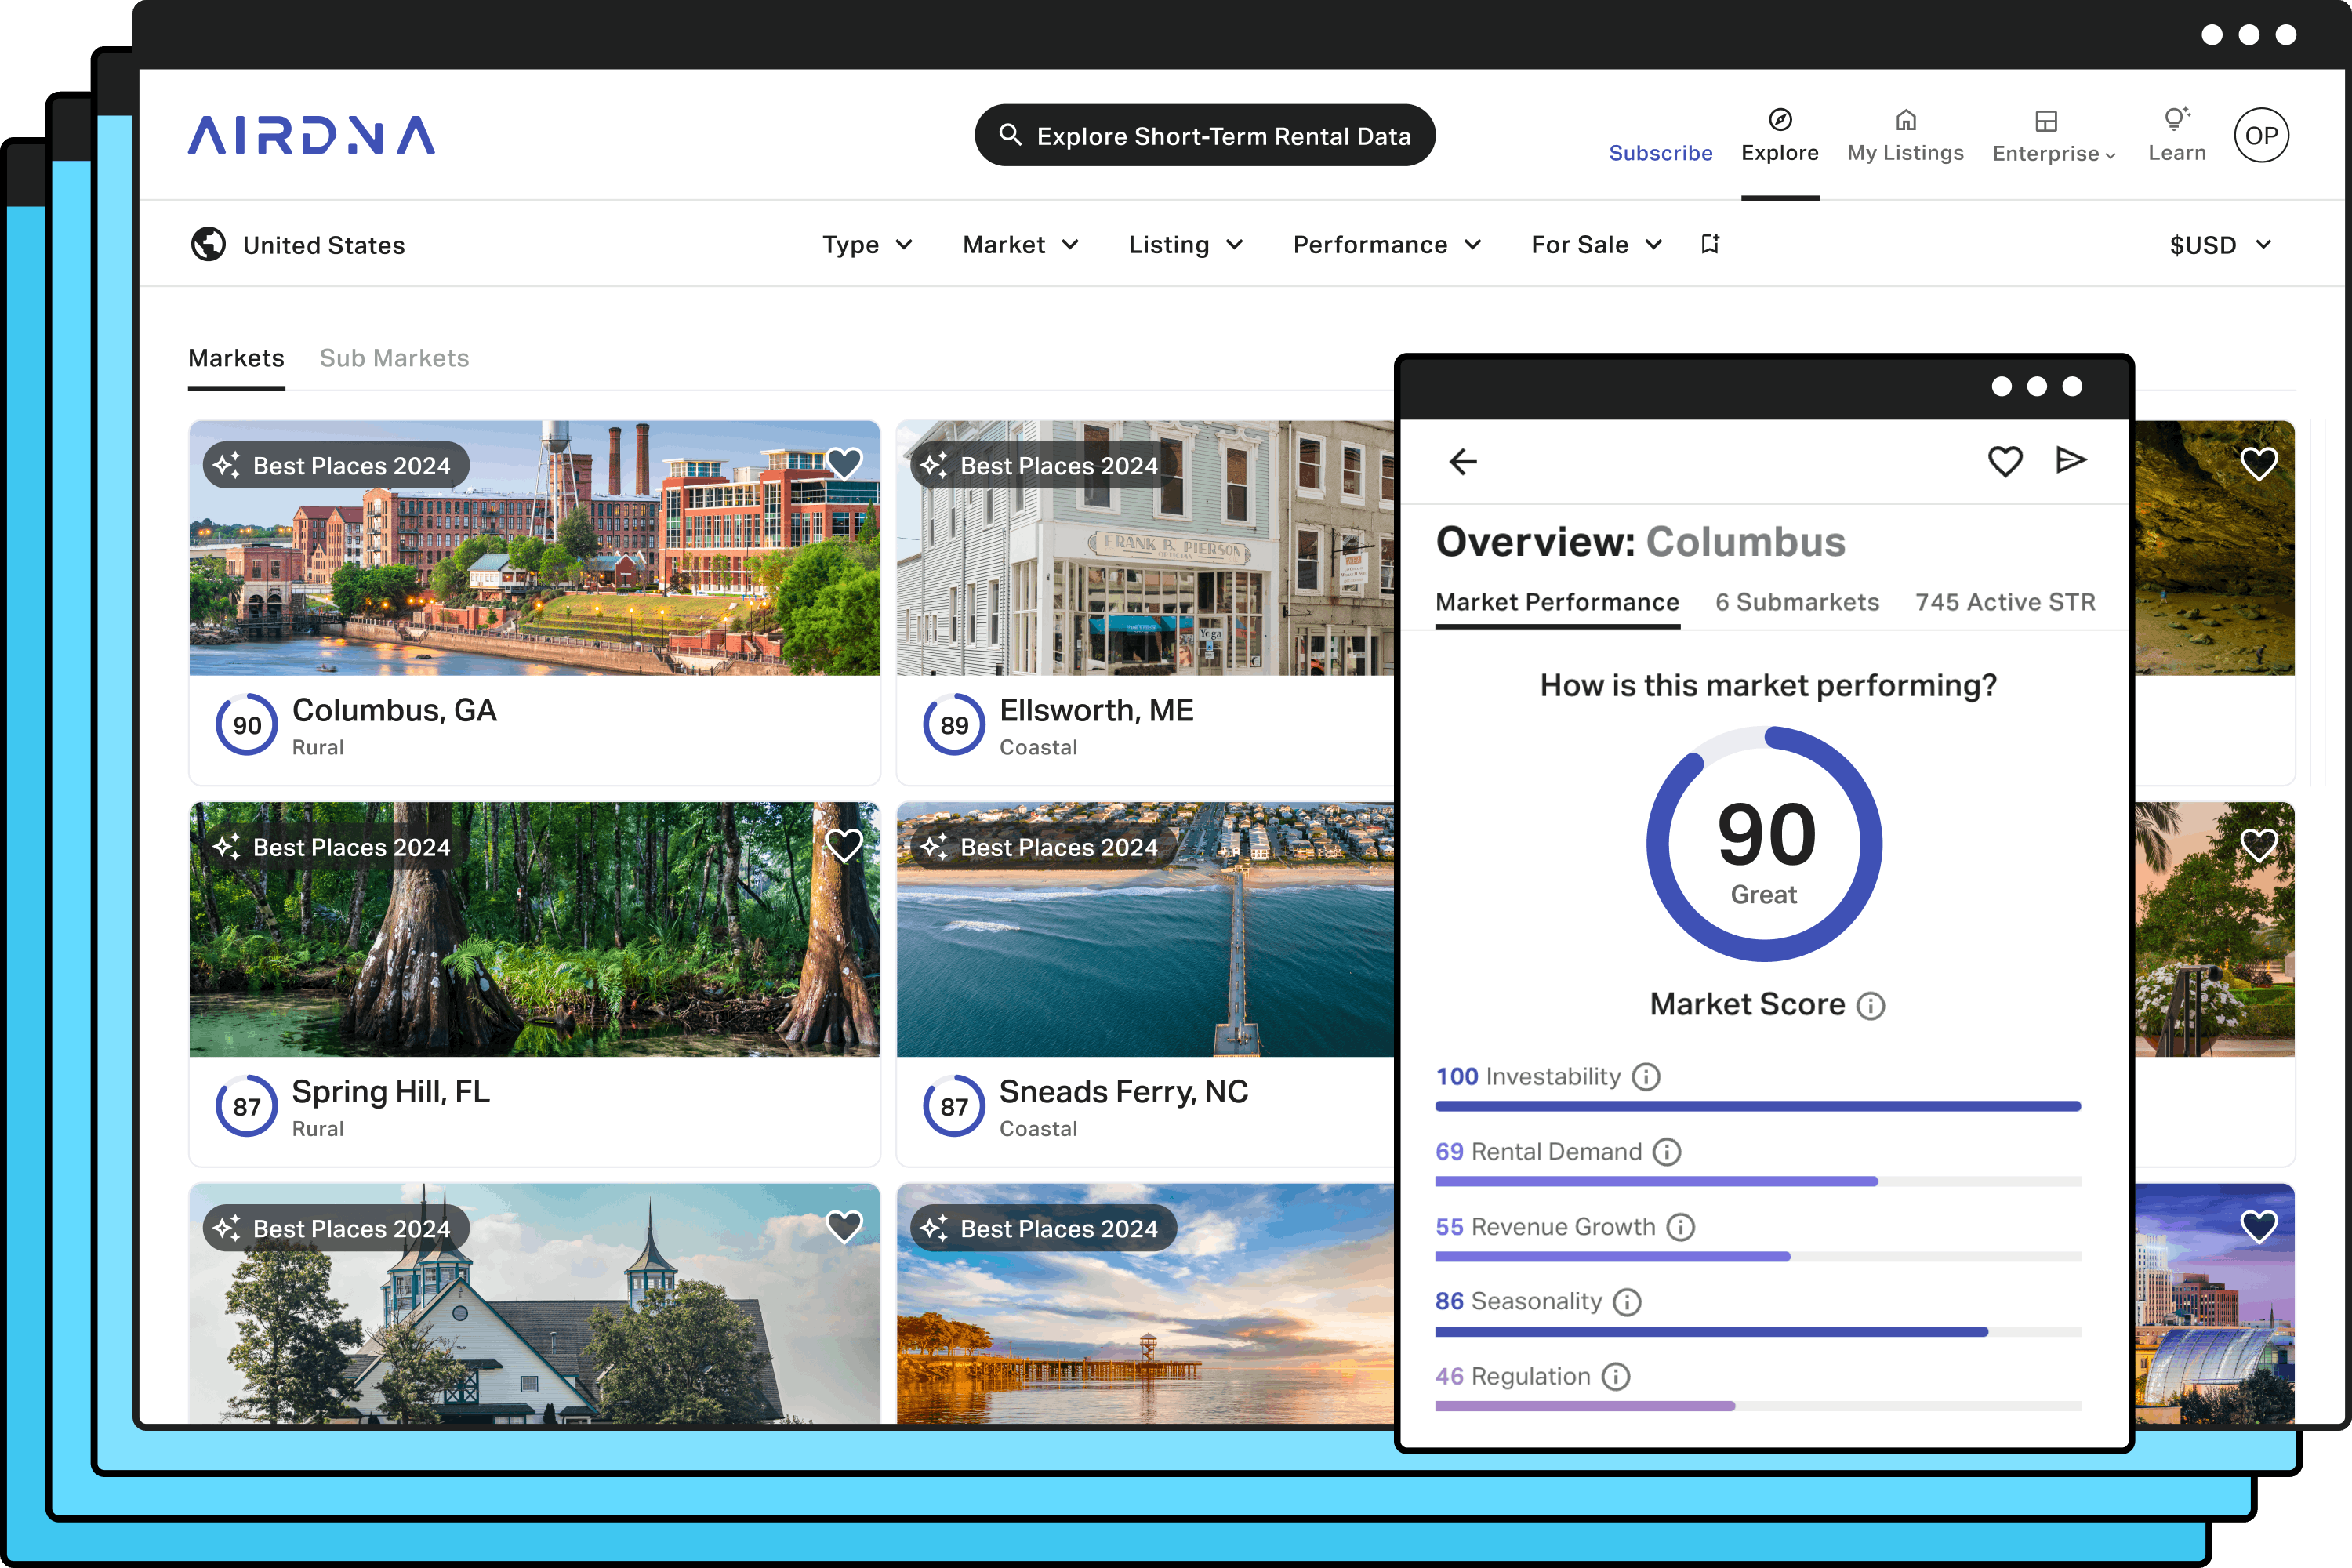
AirDNA offers a comprehensive analysis of each short-term rental market by looking at rental demand, revenue growth, investability, and regulatory considerations in that area.
The 25 best vacation rental markets in 2024 are concentrated in states like Florida (7), Ohio (2), and South Carolina (2). Promising markets often feature unique qualities such as coastal access, historical significance, proximity to national parks, or vibrant local arts and outdoor scenes, making them attractive to a wide range of travelers.
"RevPAR should grow in 2024, giving Airbnb hopefuls reason to consider entering the best short-term rental markets"
"Keeping up means not only referencing this list but also personalizing our data to your own portfolio"
How often are rentals booked throughout the year? We use a combination of the trailing 12 months (TTM) occupancy rate and booked listing growth rates.
The TTM occupancy rate tells you, on average, how often a rental was booked over the last year. For example, a TTM occupancy rate of 70% means that 70% of all available listing nights were rented over the past year. Booked listing growth rates refer to how much the number of rented properties (like Airbnb homes) increased over a certain time. When combined, this metric shows how travel demand varies in each market.
Did properties earn more this year than they did last year? This metric is calculated by looking at how revenue per available rental has changed for properties that were booked over the past two years.
This metric measures how profitable a property is likely to be compared to its purchase cost. It does this by taking into account the average potential rental income in the area, subtracting the average operating costs for the property, and then dividing that by the typical home value in the same area for similar types of properties.
We also consider the number of short-term rentals in each zip code to make sure the home values align with the potential earnings in that market. Together these data points combine to create our ultimate proprietary ranking metric for the best short-term rental markets, the AirDNA Investor Score.
We consider both current regulatory risk for STR investors and the potential for future regulations in our assessment of top short-term rental locations. Our perspective is focused on real estate investors, so we classify municipalities that limit STRs to either hosted stays (where the property owner is present during the guest’s stay) or primary residences as highly restrictive. We highlight markets with significant regulations in the market write-ups for that location.
Unlock your vacation rental cheat code
Make hosting and investing a breeze with every insight you need, all in one place, and always up-to-date.