Airbnb Occupancy Rate: What’s Considered Good and Why It Matters
Published: October 13, 2025
Last updated: October 30, 2026

Jamie Lane
Key Takeaways
- A good Airbnb occupancy rate usually falls between 60% and 70%, but the ideal range depends on your market, seasonality, and pricing strategy.
- The average Airbnb occupancy rate in the U.S. is 54.4%, based on AirDNA data analysis. Use this as a baseline, not a benchmark.
- Occupancy rate is only part of the equation. Profitability depends on balancing bookings with pricing. Tools like AirDNA help hosts measure both.
If you’re an Airbnb host or short-term rental investor, occupancy rate is one of the most important numbers you can track. It tells you how often your place is booked, signals how you compare to similar listings, and helps answer the big question: Am I making the most of this property?
In this guide, we’ll break down:
- What occupancy rate really means
- What a good Airbnb occupancy rate looks like
- How to interpret it through the lens of profit, not just bookings.
You'll also learn how to benchmark your performance with real data, spot trends in your market, and use AirDNA to make smarter pricing and strategy decisions.
What Is Airbnb Occupancy Rate?
Occupancy rate is the percentage of time your vacation rental is booked out of the time it’s available. You calculate occupancy rate by dividing booked nights by the total available nights and multiplying it by 100 to get a percentage.
For example, if your cabin is available year-round (365 nights) and gets 90 bookings, your occupancy rate is about 25%—meaning it was rented a quarter of the year.

What Is a Good Airbnb Occupancy Rate?
A good Airbnb occupancy rate typically falls between 60% and 70%, though it depends on your market and pricing strategy. The average Airbnb occupancy rate in the U.S. is currently 54.4%, according to AirDNA. However, what matters most is that your rate supports revenue, not just a full calendar.

What’s considered “good” ultimately varies based on location, seasonality, property type, and price point. A luxury beachfront home may earn more with fewer, high-paying guests, while a budget-friendly city apartment could stay booked most nights but generate less income overall.
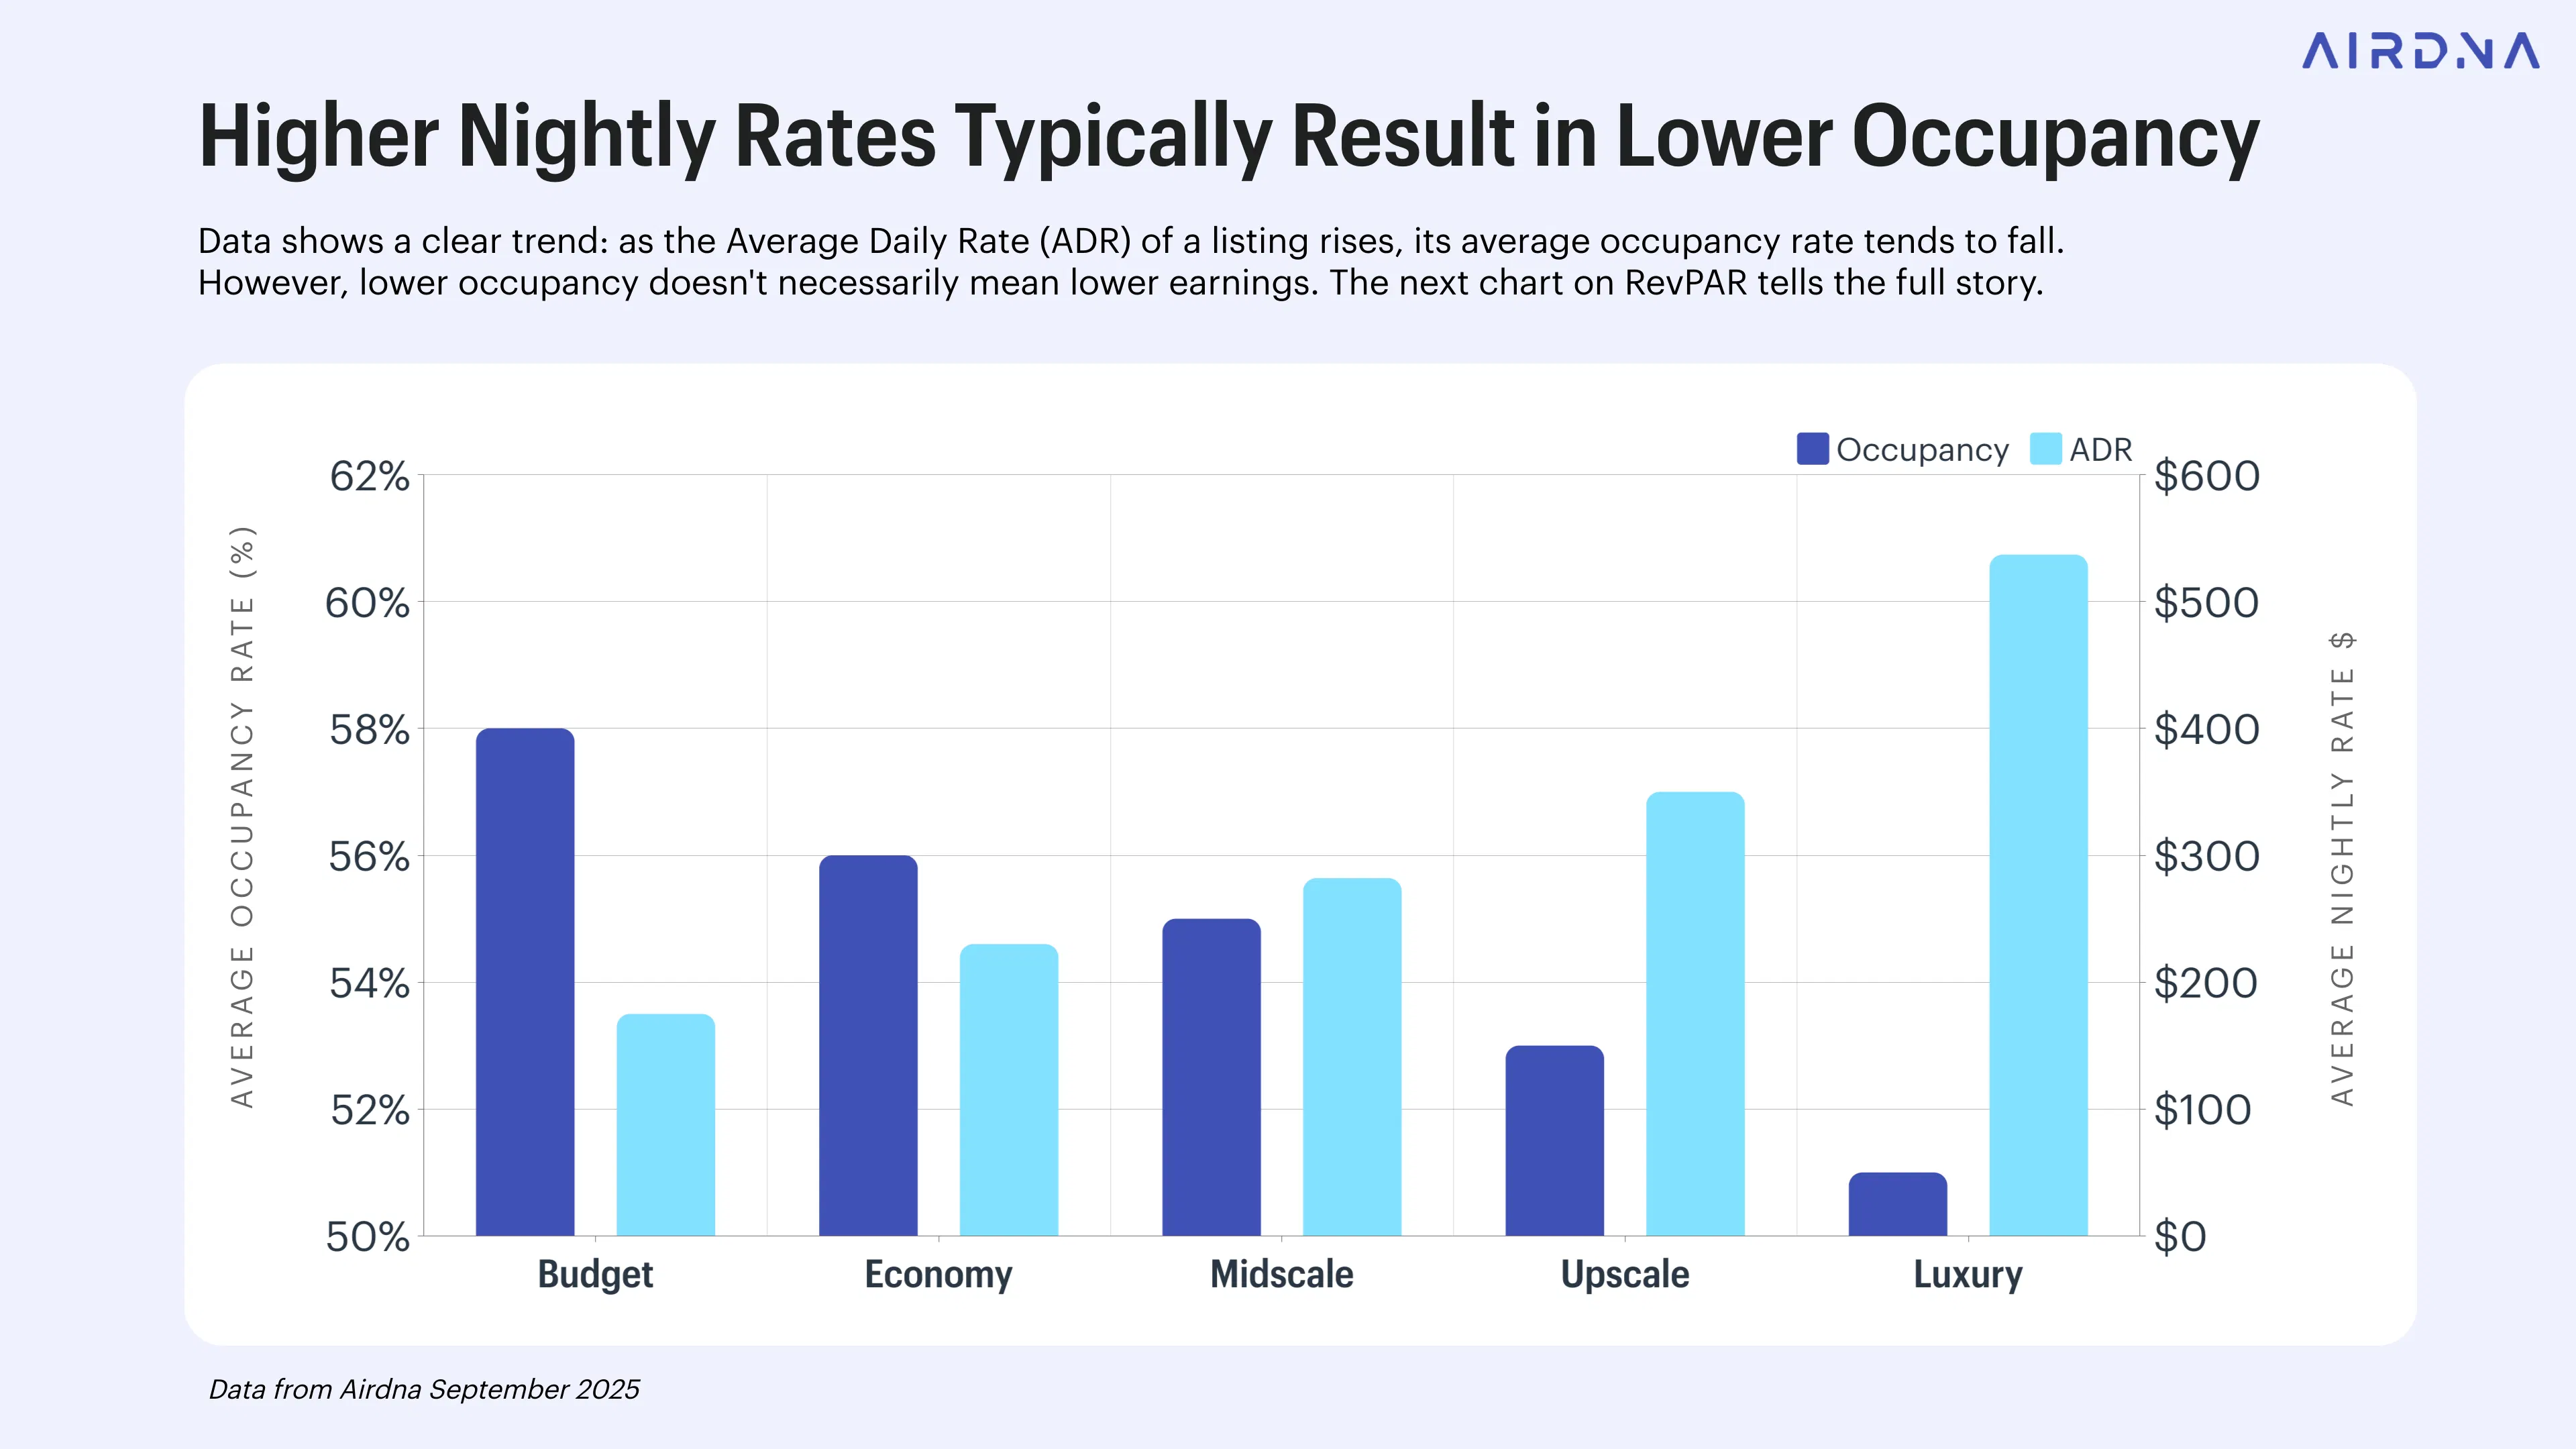
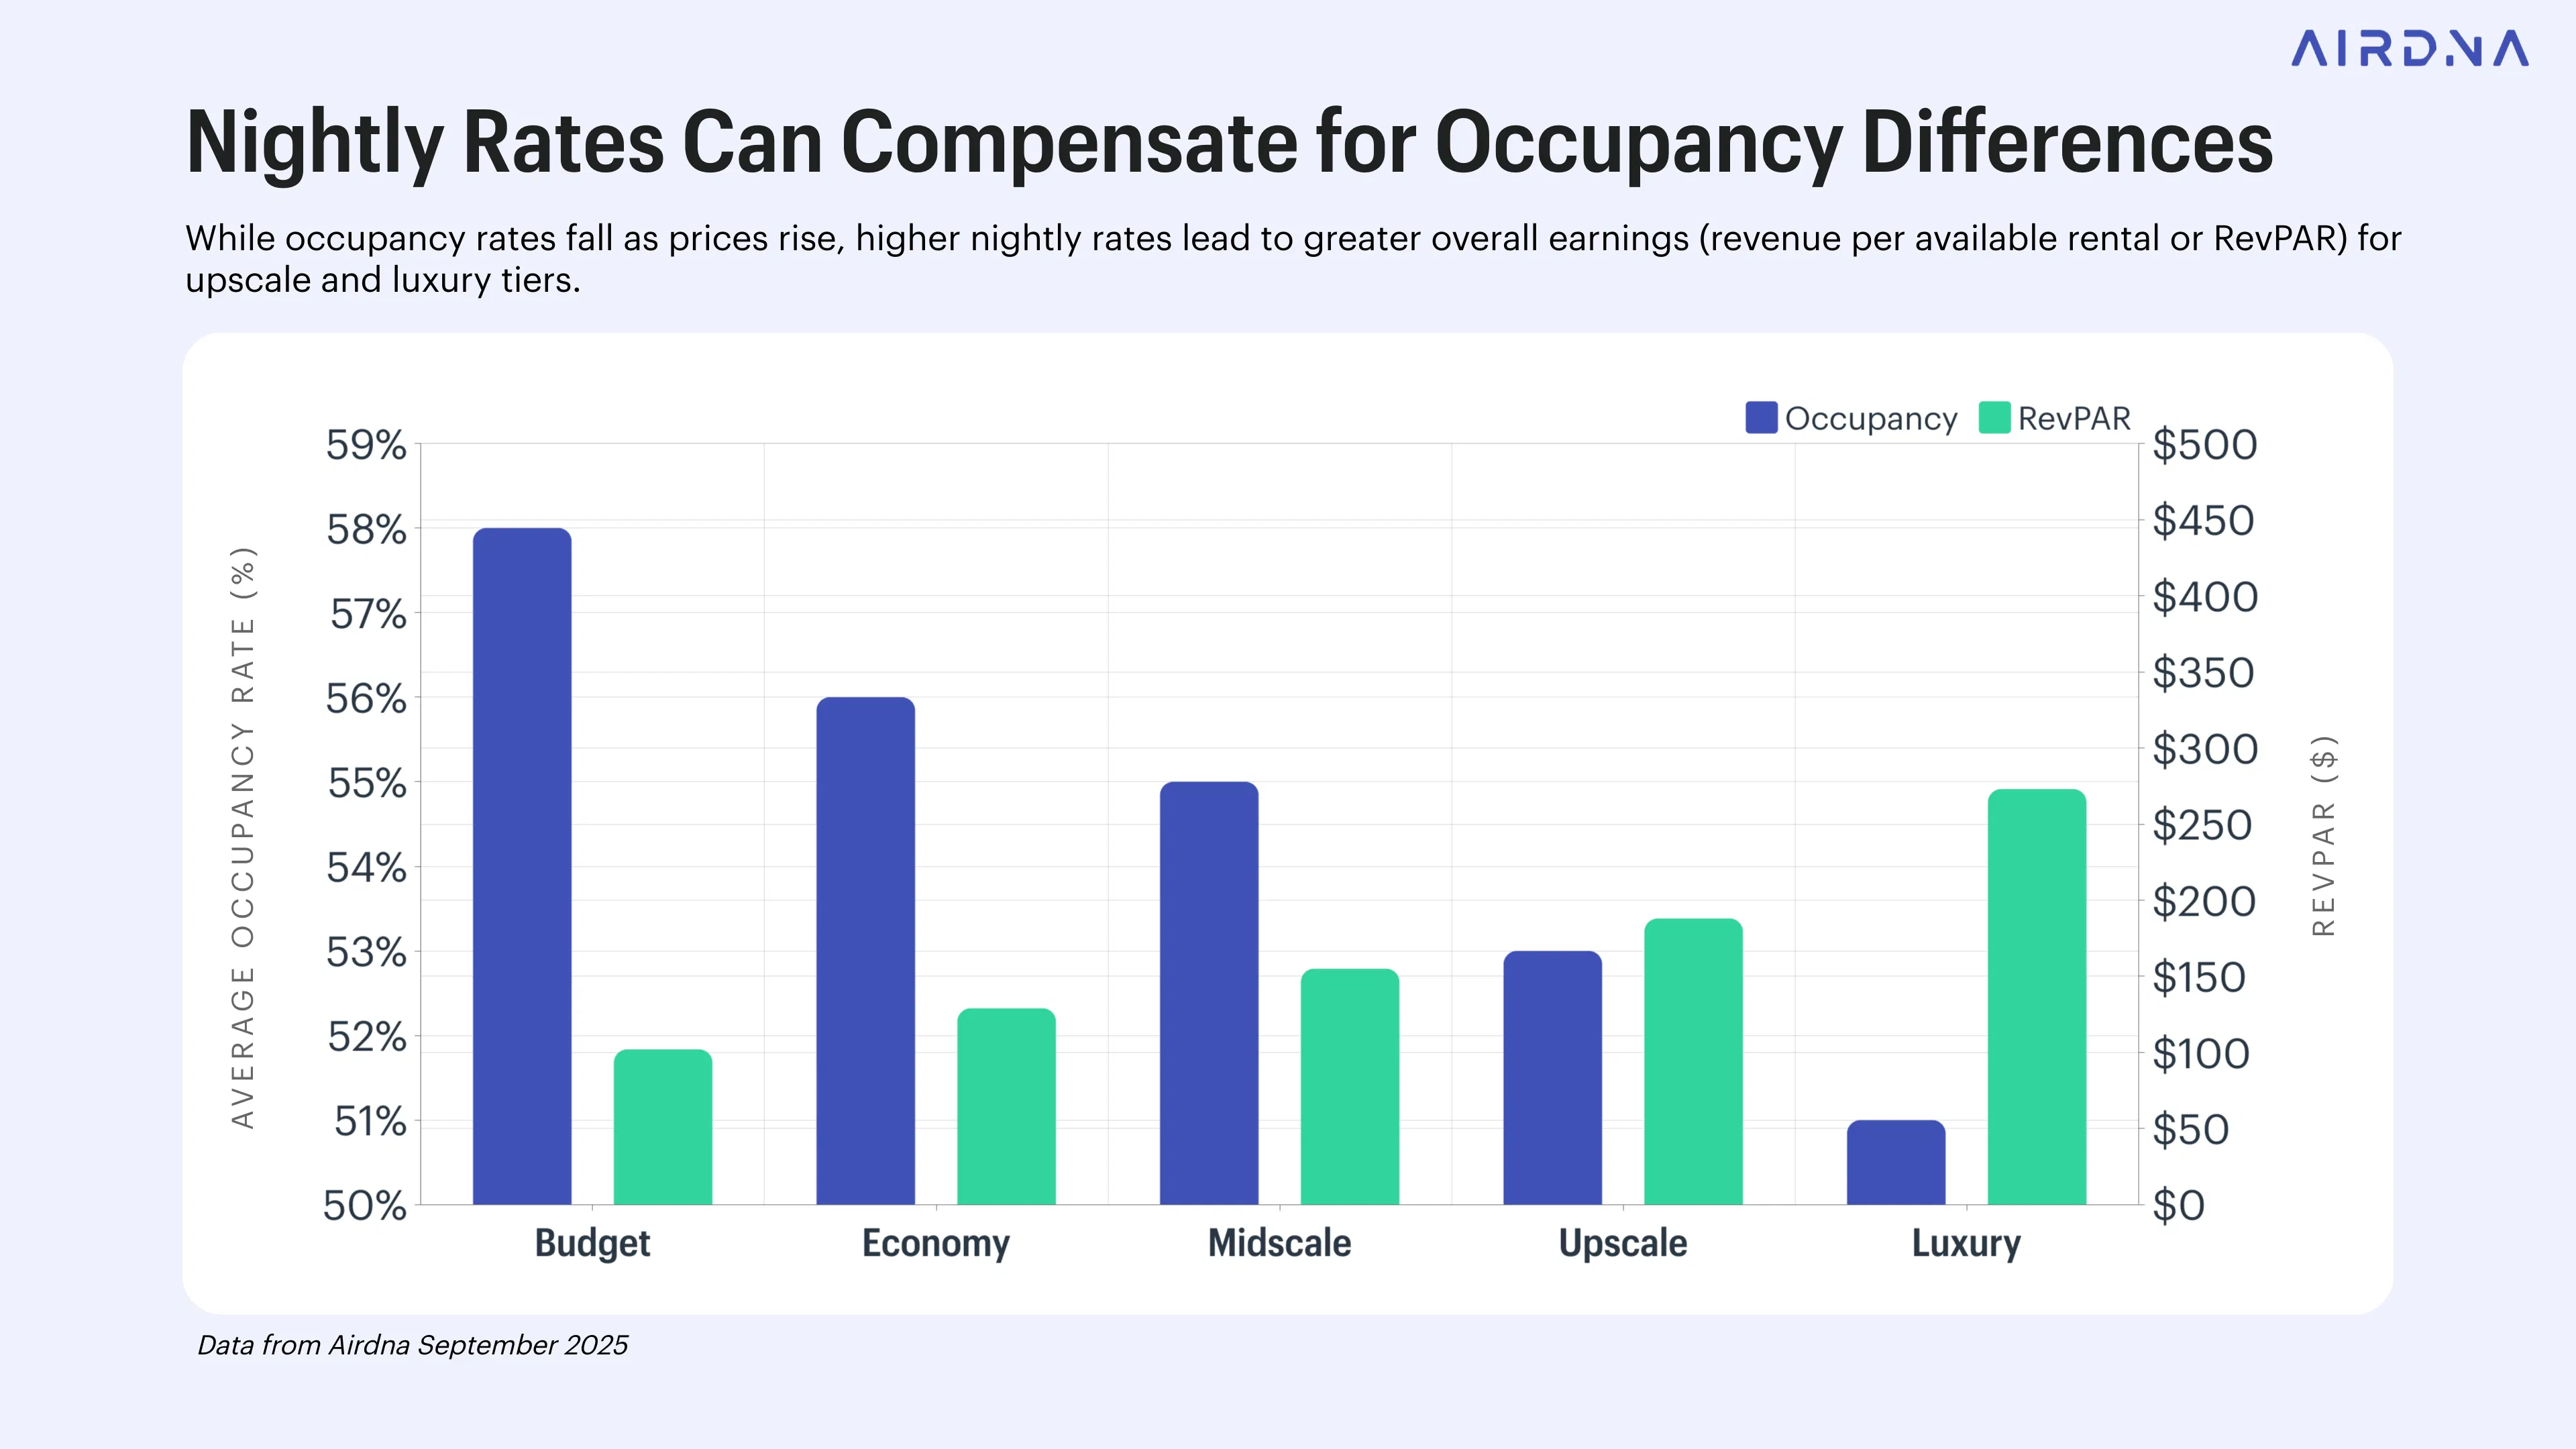
In fact, AirDNA data shows that lower price tier and urban listings often achieve higher occupancy, but usually at lower average daily rates (ADR). Upscale and seasonal properties tend to have fewer bookings but higher earnings per night, thanks to stronger pricing power.
If you're in a competitive or price-sensitive market, higher occupancy might be necessary to meet your goals. In higher-rate or seasonal markets, fewer bookings can still reflect strong performance.
At the end of the day, a good Airbnb occupancy rate is one that fits your strategy, reflects your market, and drives meaningful revenue—not just one that fills dates.
Why Your Airbnb Occupancy Rate Matters
Occupancy rate tells you how often your place is getting booked, how you stack up against similar listings, and whether your strategy is actually working. It is actually one of the most useful signals you have to understand and improve your property’s performance.
Unbooked nights = lost revenue
You can’t go back and re-sell a night once it’s passed. Every vacant night is income you’ll never recover, which makes maintaining strong occupancy key to maximizing earnings.
It shows how your listing is performing
If your occupancy is lower than similar listings in your area or tier, that can be a sign something’s off, whether it’s pricing, photos, or guest experience. Tracking occupancy over time helps flag performance issues early so you can make improvements before they impact your bottom line.
It helps you balance bookings and earnings
Occupancy ultimately ties back to profitability.
A high occupancy rate might look great, but if you're only getting it by charging low rates, you could be leaving money on the table. On the other hand, fewer bookings at a higher nightly rate might bring in more overall.
It helps you read market demand
High occupancy often signals strong local demand, while lower average occupancy might mean your area has seasonal lulls or growing competition. Understanding these patterns helps you fine-tune pricing and marketing to stay competitive.
It informs your next move
Upgrades like a hot tub or faster Wi-Fi might boost occupancy, but the only way to know for sure is to track changes over time. Looking at performance before and after improvements lets you evaluate return on investment (ROI) and decide what’s worth investing in.
How to Calculate Your Airbnb Occupancy Rate
Understanding the occupancy rate of your Airbnb property is pivotal for optimizing your rental strategy. Yet, it all comes down to a single equation.
The Airbnb occupancy rate formula
Reserved Days / Available Days x 100 = Occupancy Rate
With that in mind, here's a simple guide on how to calculate Airbnb occupancy rates:
Step-by-step calculation for occupancy rate
Example Calculation:
Imagine you own a house on the water in North Carolina and you're evaluating its performance on Airbnb over the last 12 months. The property was available for 340 days and booked for 240 days within this timeframe.
Reserved Days: 240
Available Days: 340
Occupancy Rate Calculation: 240/340 x 100 = 70.58%
Of course, if you'd rather not wrestle with spreadsheets and a calculator, tools like AirDNA can do the heavy lifting for you (we’ll show you how that works later).

How to Interpret Your Airbnb Occupancy Rate
It’s easy to assume a high occupancy rate means your listing is doing well. Booked = successful, right? Not always.
Imagine this: One property is booked 70% of the time at $100 per night. Another is booked 50% of the time at $300 per night. Despite having more vacancy, the second property earns significantly more. So while occupancy is helpful, it doesn’t tell the whole story.
To get a clearer picture, you need to look at how often you’re booked and how much you’re charging. Revenue per available rental (RevPAR) is the metric that multiplies your nightly rate with your occupancy to give you a well-rounded understanding of your performance.
We saw in the previous graph that luxury listings, for instance, have an average annual occupancy of 51% and an average nightly rate of $537. The resulting RevPAR (0.51 x 537) is $273.
Another way to calculate RevPAR is to divide your total revenue by your number of available nights. In the case of luxury listings, spreading your earnings across the higher relative number of vacant nights quickly brings that impressive $537 number down by several hundred dollars to a more modest $237.
Despite that, upscale and luxury listings typically book fewer nights but earn more per stay because of stronger nightly rates. AirDNA data shows that lower-priced listings tend to have higher occupancy, but often generate less overall revenue. We have a dedicated article on RevPAR to help you better understand this metric and how it interplays with occupancy.
Before deciding whether your occupancy rate is “good” or “bad,” ask:
- Am I earning enough per night to justify how often I’m booked?
- Could fewer bookings at a higher price actually boost my revenue?
- Is my pricing aligned with my market and property type?
The goal isn’t just to stay booked. It’s to earn the most from the nights you do book.
That’s where data makes all the difference. Knowing how similar listings (called comp sets) in your market are priced (and how often they’re booked) can help you fine-tune your strategy, whether that means raising your rates, adjusting your availability, or repositioning your listing altogether.
Read our article on How to Compare Airbnb Prices of Similar Listings to learn more.
Top 10 Markets With Highest Airbnb Occupancy Rates
When it comes to occupancy, one of the smartest things you can do is compare your listing to others in your market. What’s considered “good” in one area might be average (or even underperforming) in another.
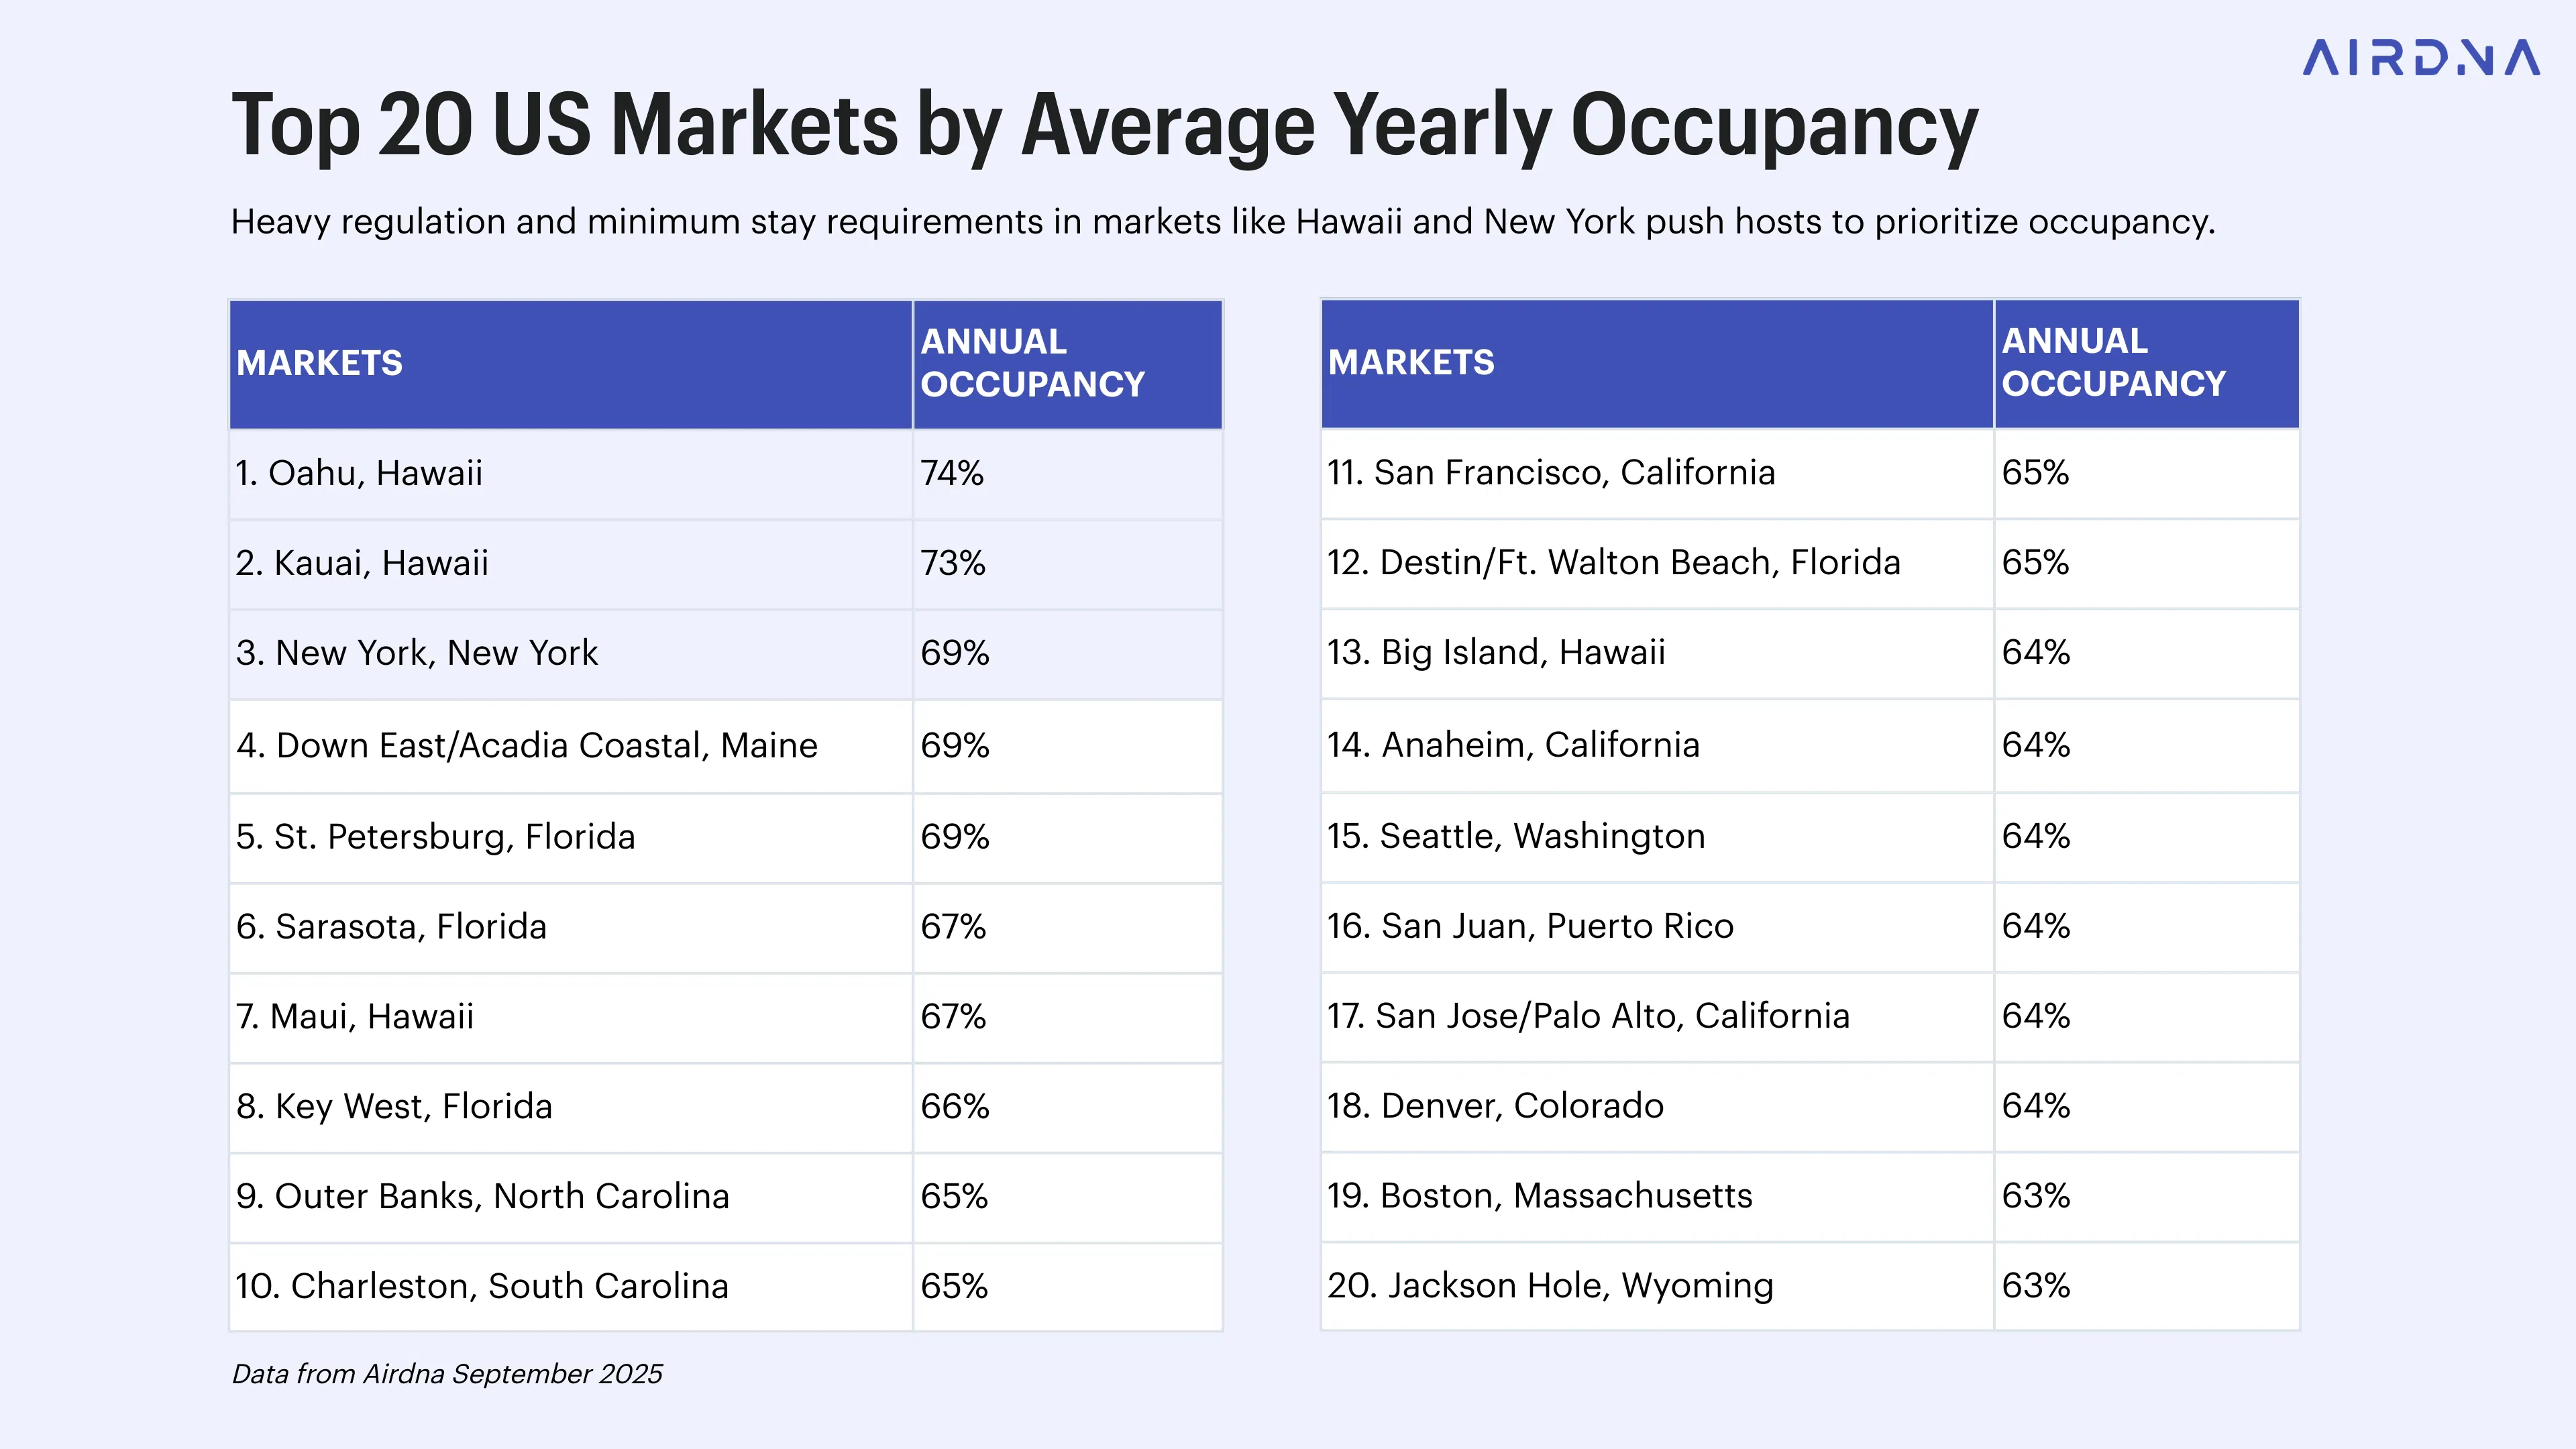
AirDNA’s latest data shows the top 20 U.S. markets by average yearly occupancy, and the numbers vary widely by location. Hawaii dominates the list, with Oahu (74%) and Kauai (73%) leading the pack. That’s partly because of strict regulations and minimum stay rules that limit how many short-term rentals can operate and how long guests can stay. If guests are required to book stays 30 days or longer, then occupancy naturally trends higher. Plus, Hawaii is a year-round short-term rental market, meaning that there is little seasonality and occupancy remains consistent instead of dipping during certain months.
New York City also ranks high at 69% occupancy, for similar reasons. Regulations implemented in 2023 require operators hosting stays under 30 nights to be present during guest stays and host a maximum of two guests. This change motivated many Airbnb hosts to adopt a 30-day minimum stay to avoid these requirements, resulting in long continuous stays that support higher occupancy.
For hosts that chose to stick with stays under 30 days, the tight local rules reduced supply and ultimately increased demand for compliant Airbnbs.
Other high-performing spots include vacation destinations like the Outer Banks, Key West, and St. Petersburg, Florida, along with big-city markets like San Francisco, Seattle, and Boston. Tourism, business travel, and events help keep calendars full in these metropolitan areas.
If your property is in or near one of these markets, use this data as a benchmark. It gives you a sense of what’s possible and helps you gauge whether your occupancy rate is on track or could use some attention.
How the Market Affects Your Airbnb Occupancy Rate
One of the biggest factors behind your occupancy rate is simply where your property is…not just the city or town, but the type of market you’re in.
AirDNA data shows that coastal destinations and large urban centers have the highest average occupancy rates.

Despite being highly seasonal, coastal markets boast some of the highest average occupancy rates because the highs of peak summer season more than compensate for the lows of slow winters. Urban listings, on the other hand, benefit from weather-agnostic attractions like conferences, festivals, concerts, and robust food scenes that keep the occupancy rate relatively consistent over the course of a year.
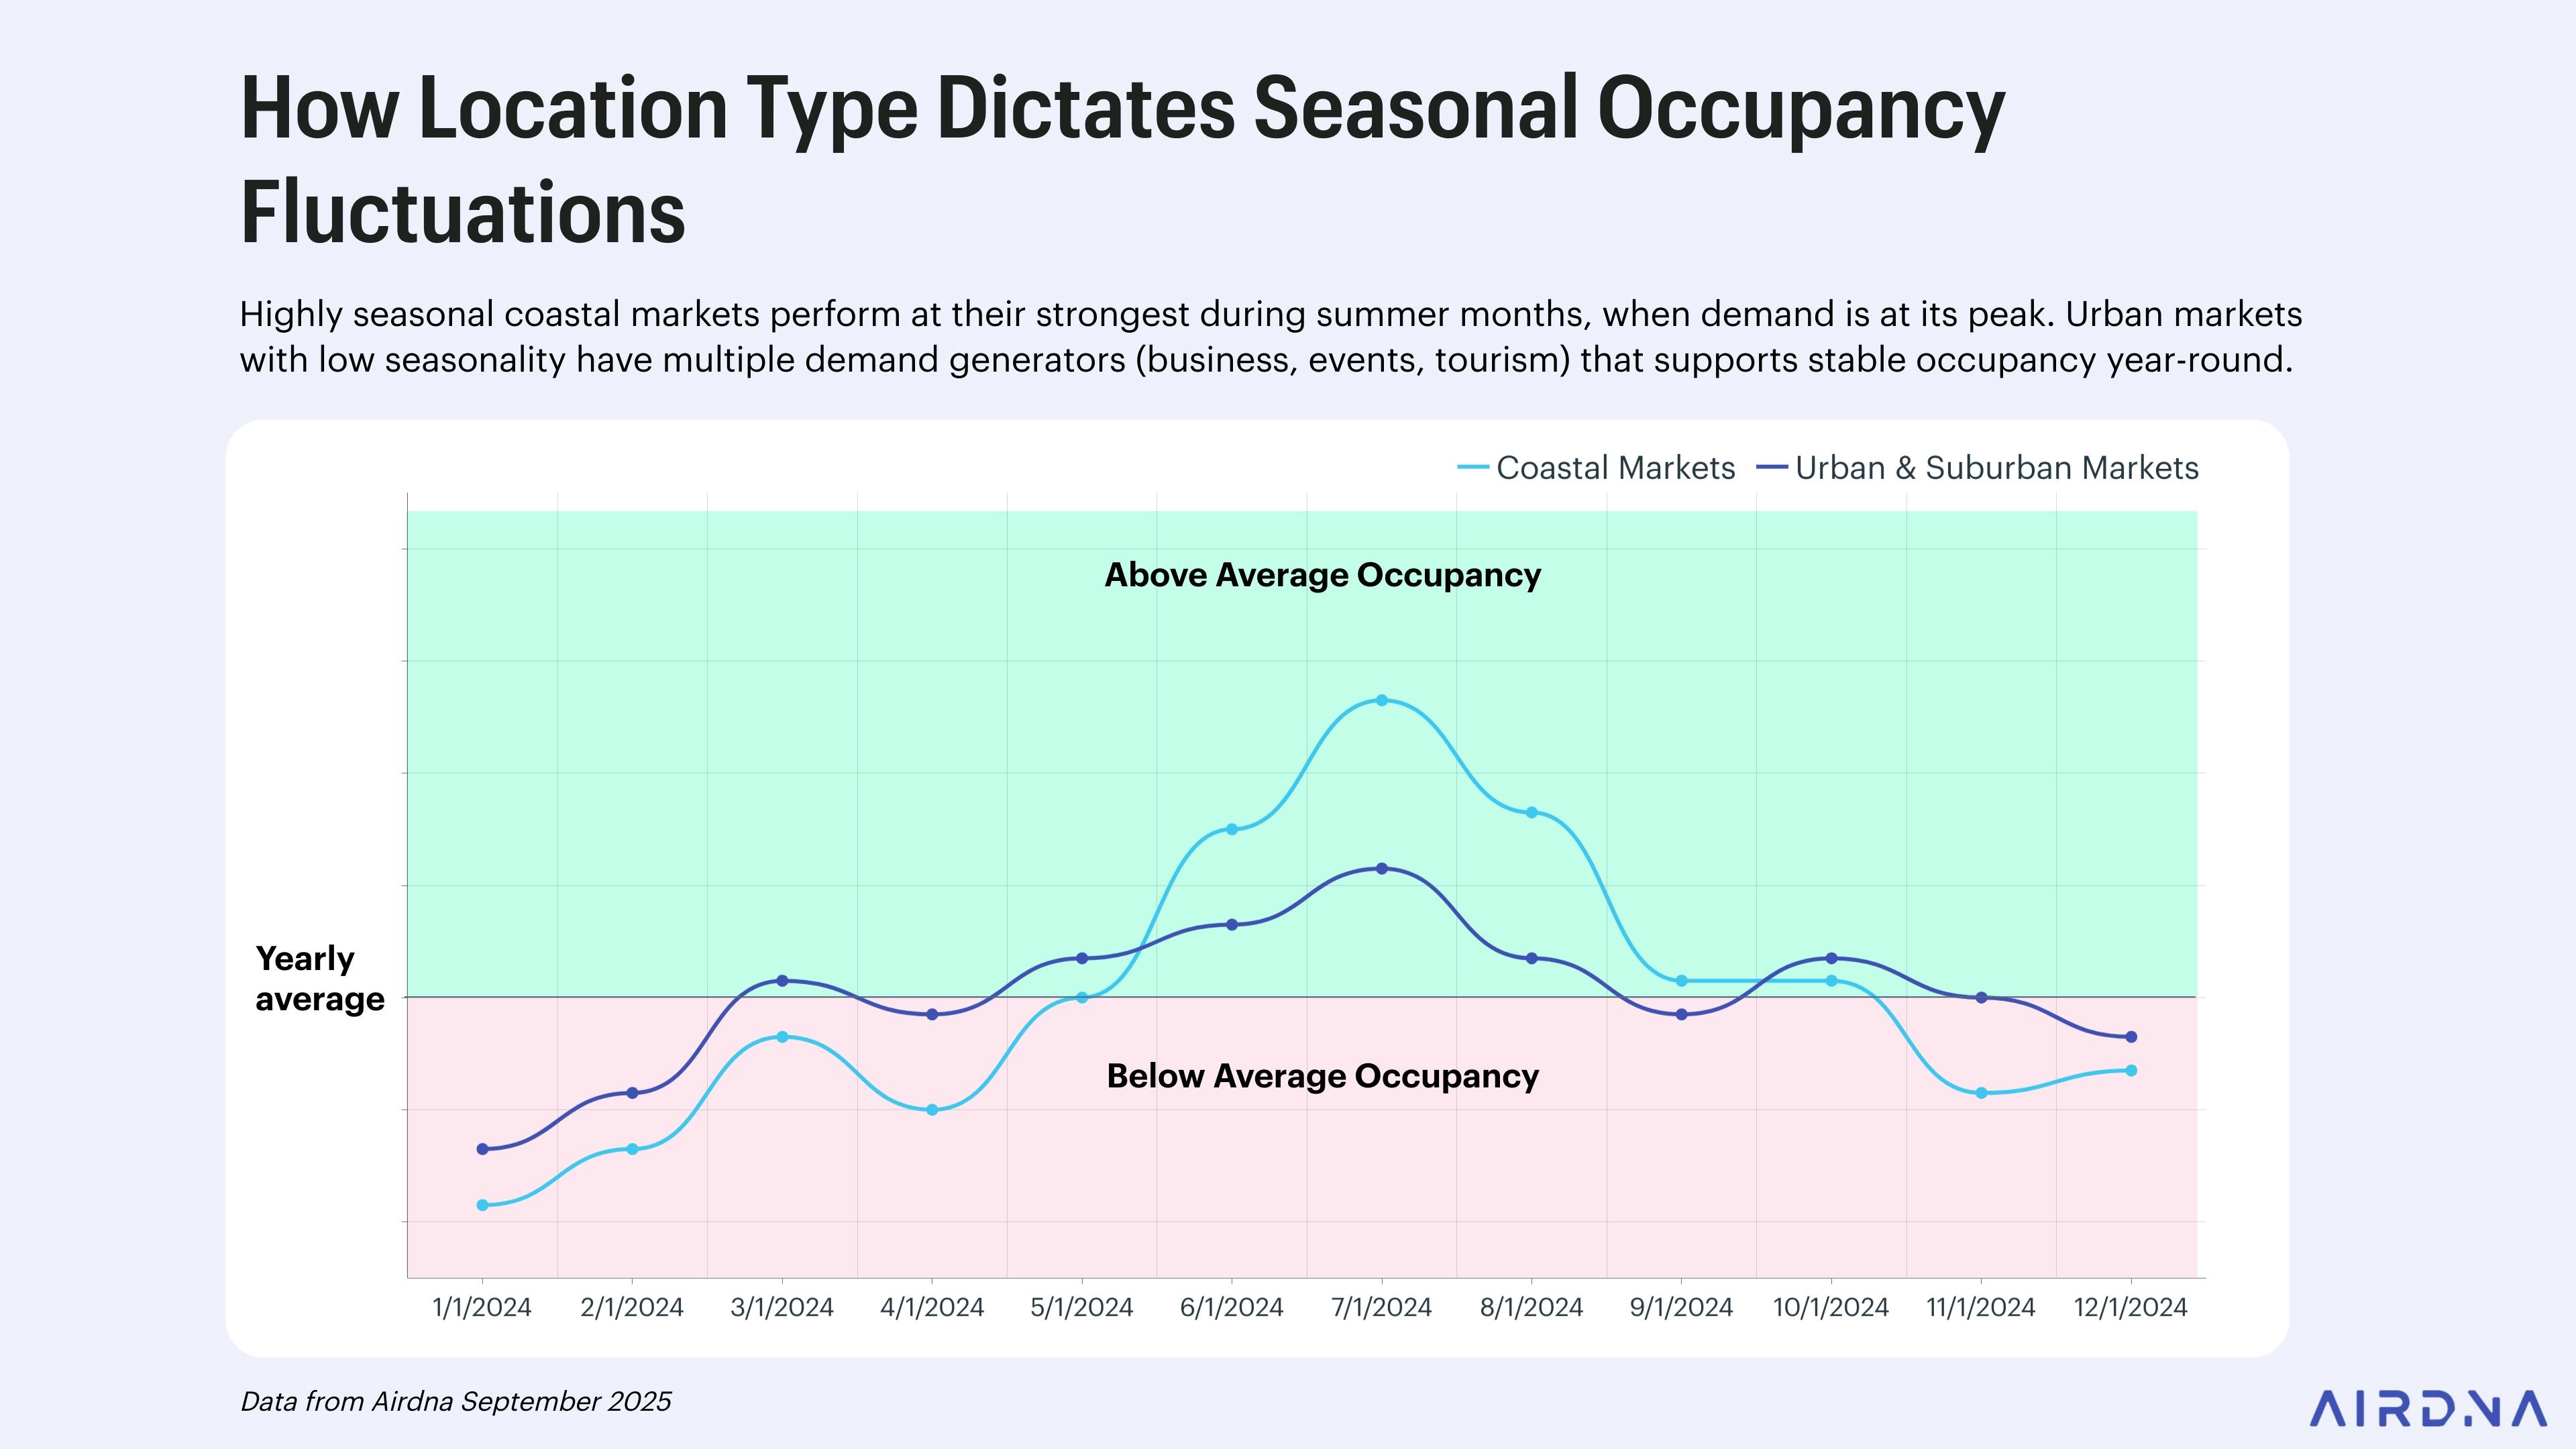
You can learn more about how seasonality affects occupancy and other key metrics like ADR and RevPAR in our deep dive on Airbnb seasonality.
At the end of the day, the goal isn’t to match your Airbnb occupancy rates to your specific market type all the time. It’s to know what’s realistic for your area and to focus on revenue. A lower occupancy rate can still be profitable if your nightly rates and overall earnings are strong. The strongest benchmark for your property is not the overall market, but your competitors on a listing level.
In other words, location type sets the stage, but smart, localized strategy drives the results.
How to Use AirDNA to Analyze Your Airbnb Occupancy Rate
Want to know if your occupancy rate is where it should be? Here's how to use AirDNA to get a clear benchmark based on your property's size, style, and market.
Step 1: Define your location and property type
Let’s say you’re a private host with a 3-bedroom upscale home in a coastal destination or an investor exploring similar opportunities.
If you were an investor, you might use the Market Type filter to exclusively explore beachfront areas.
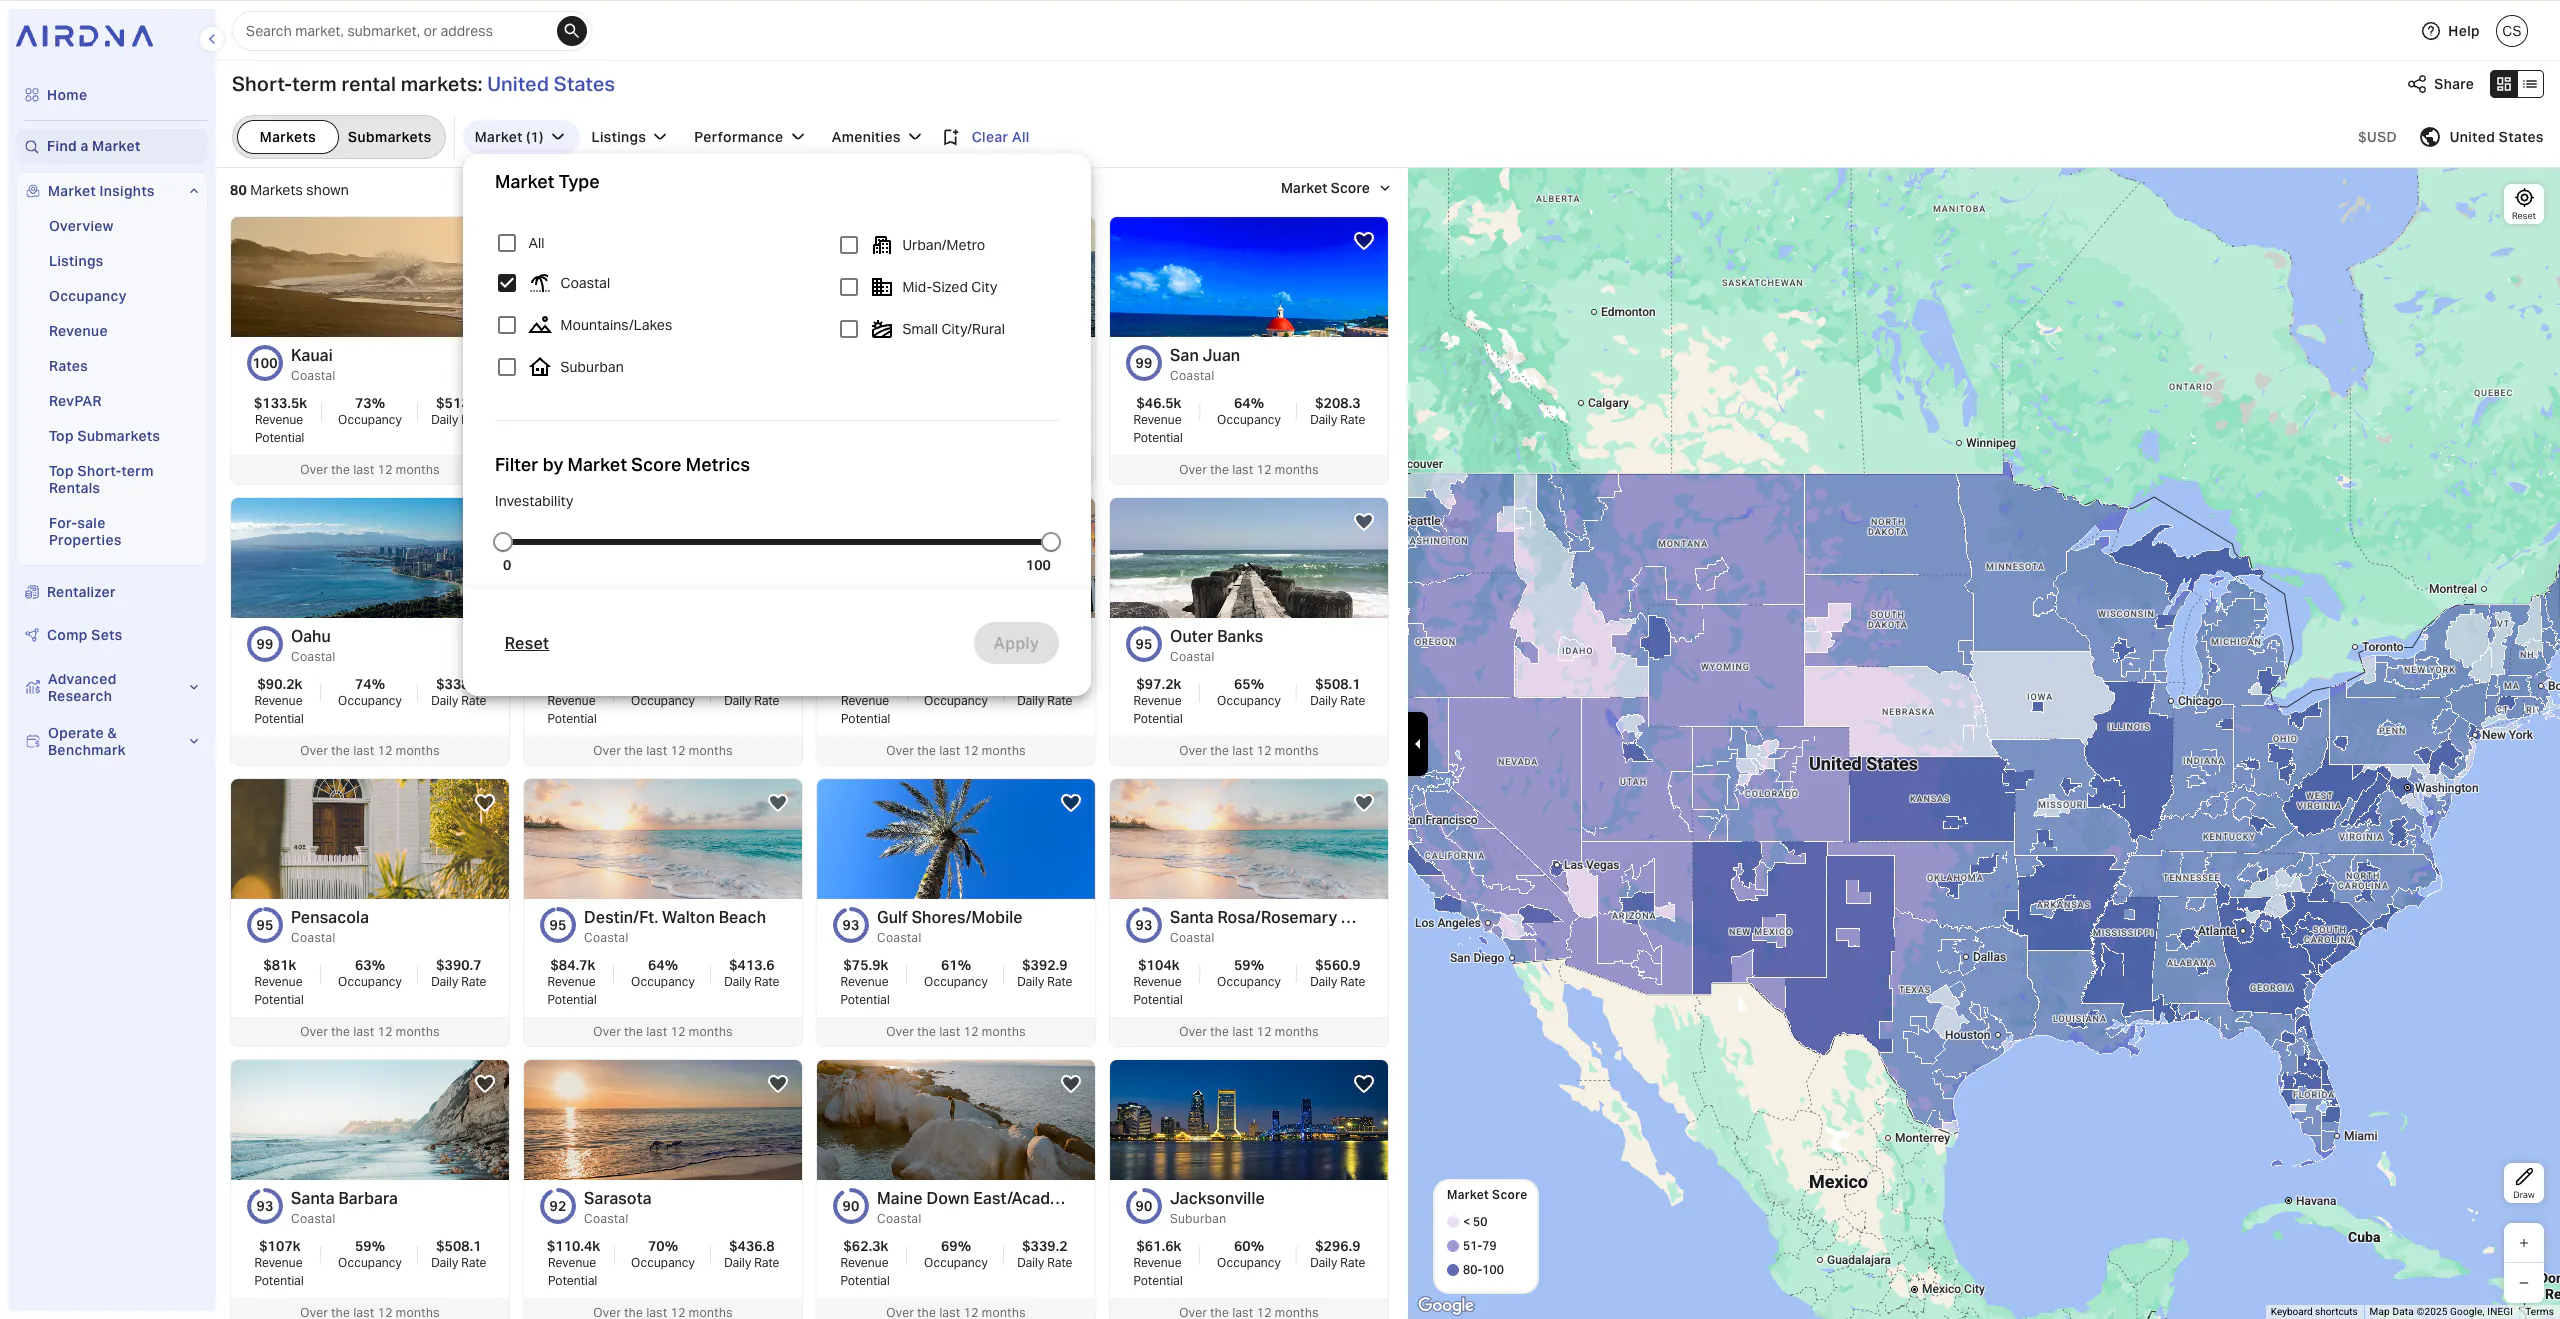
Step 2: Set your filters in AirDNA
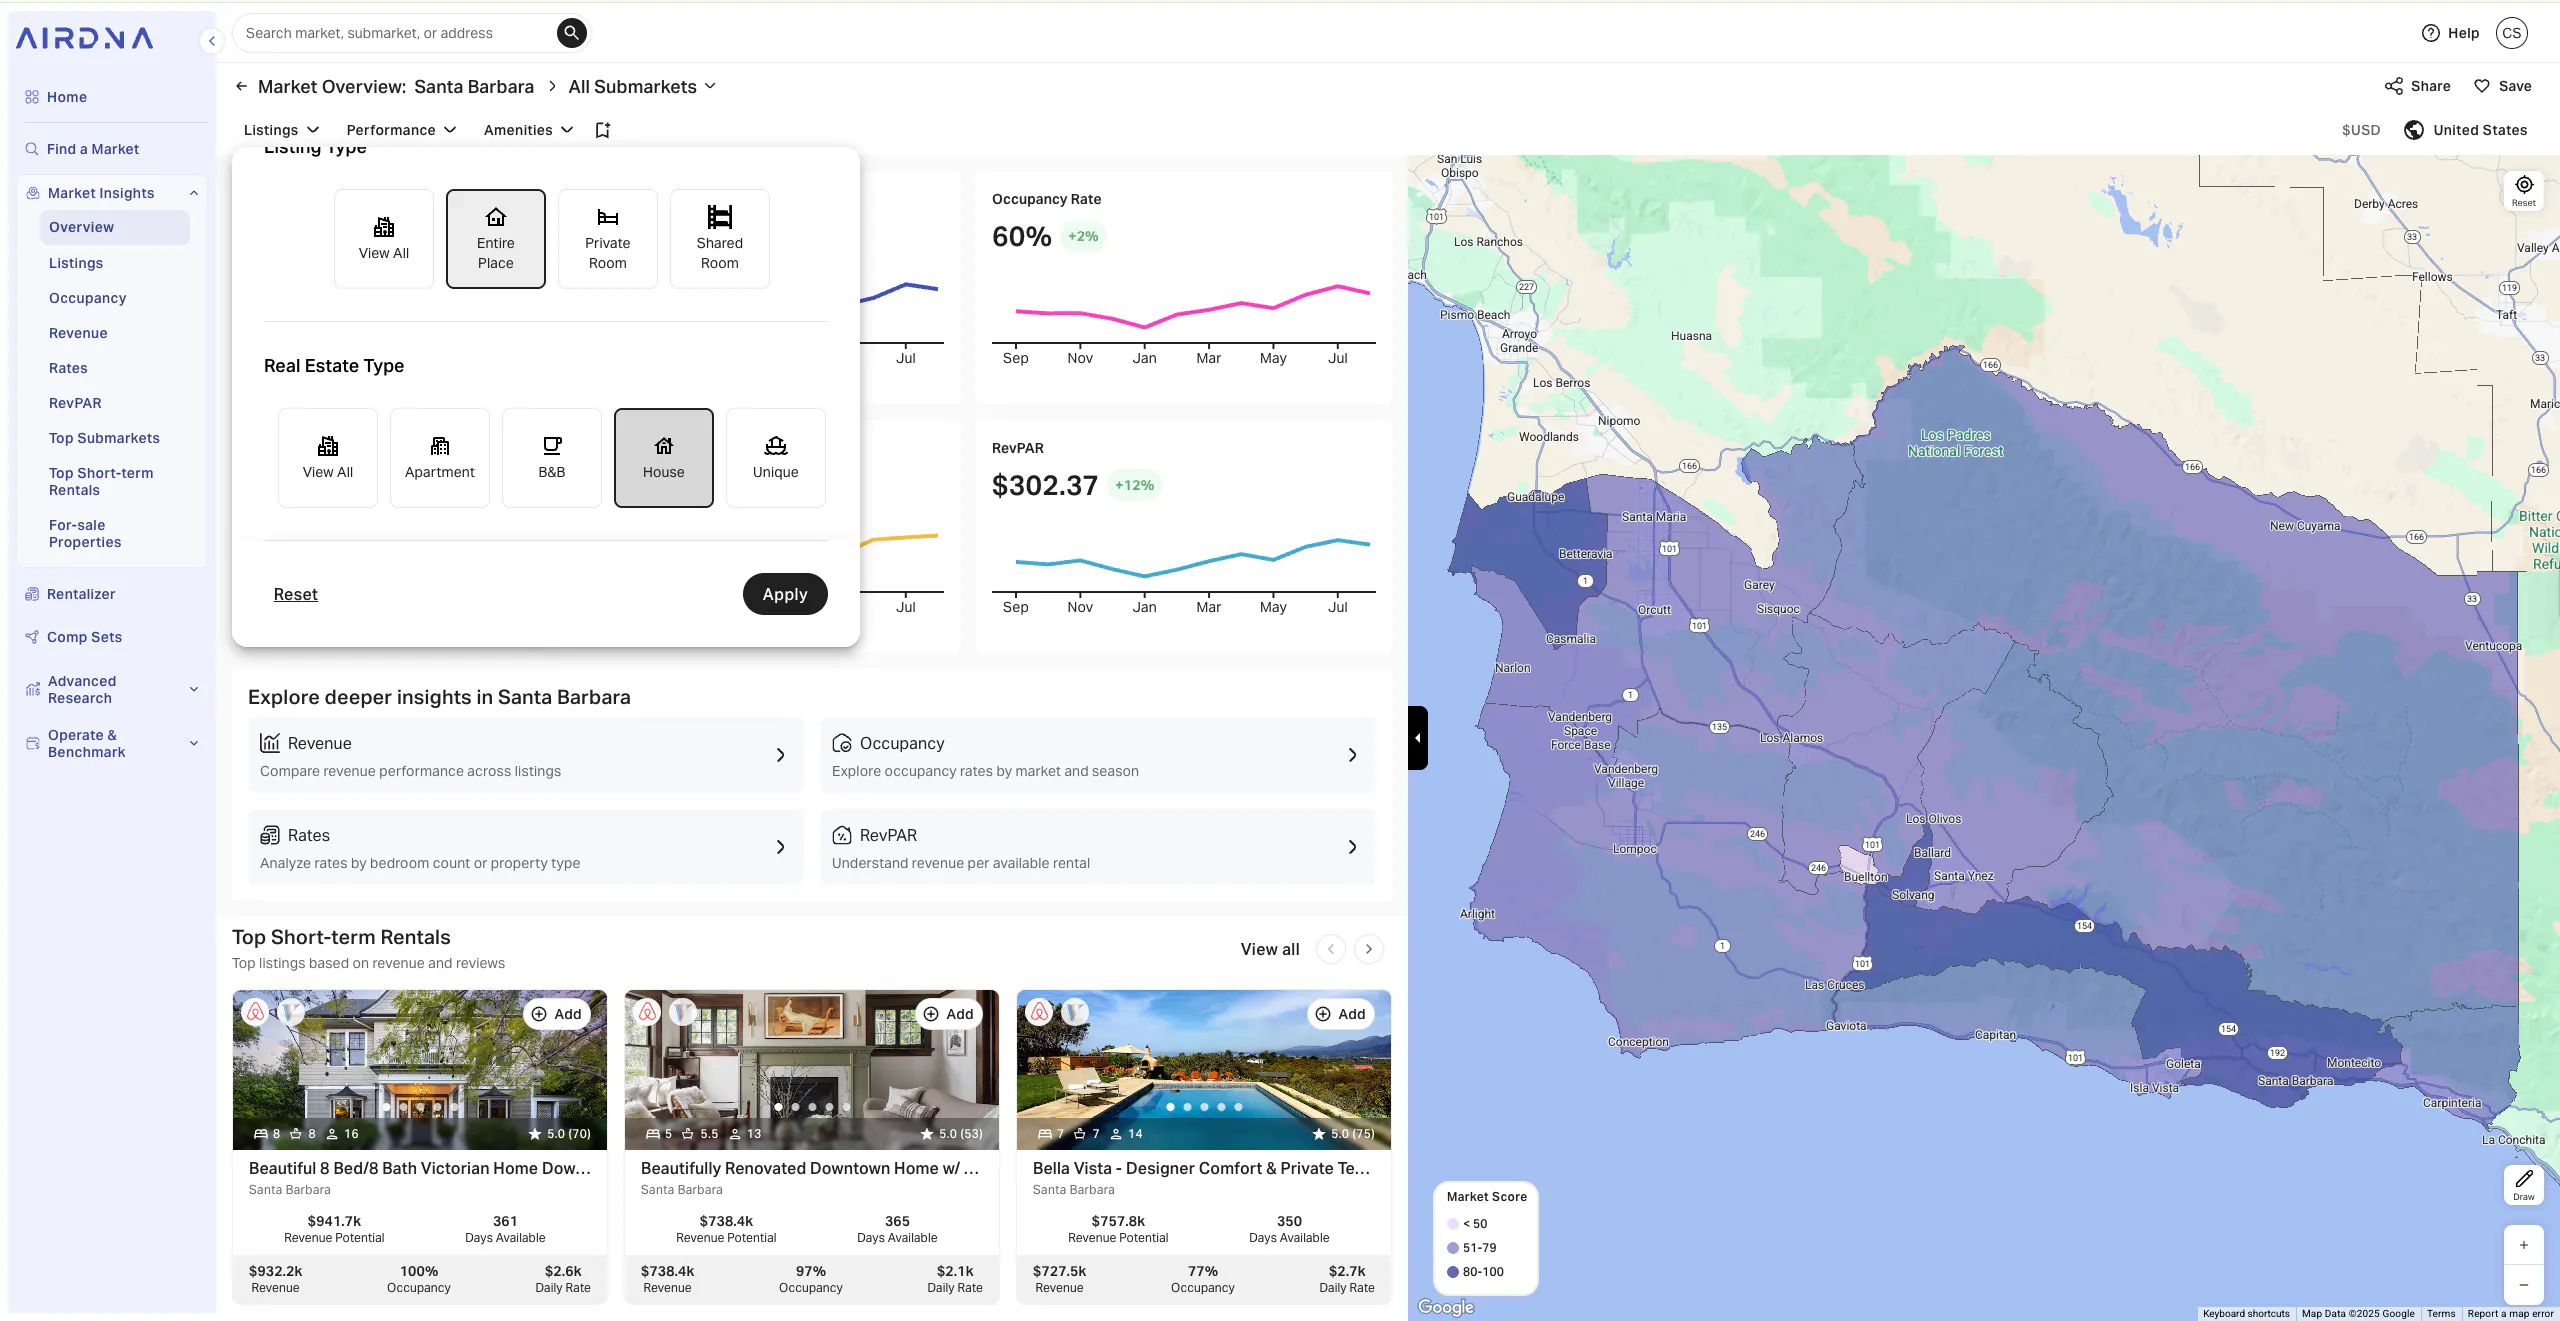
Start by selecting your market and submarket. For this example, we’ll use Santa Barbara.
Next, filter for:
- Property type: Entire home
- Bedrooms: 3
- Property class: Upscale
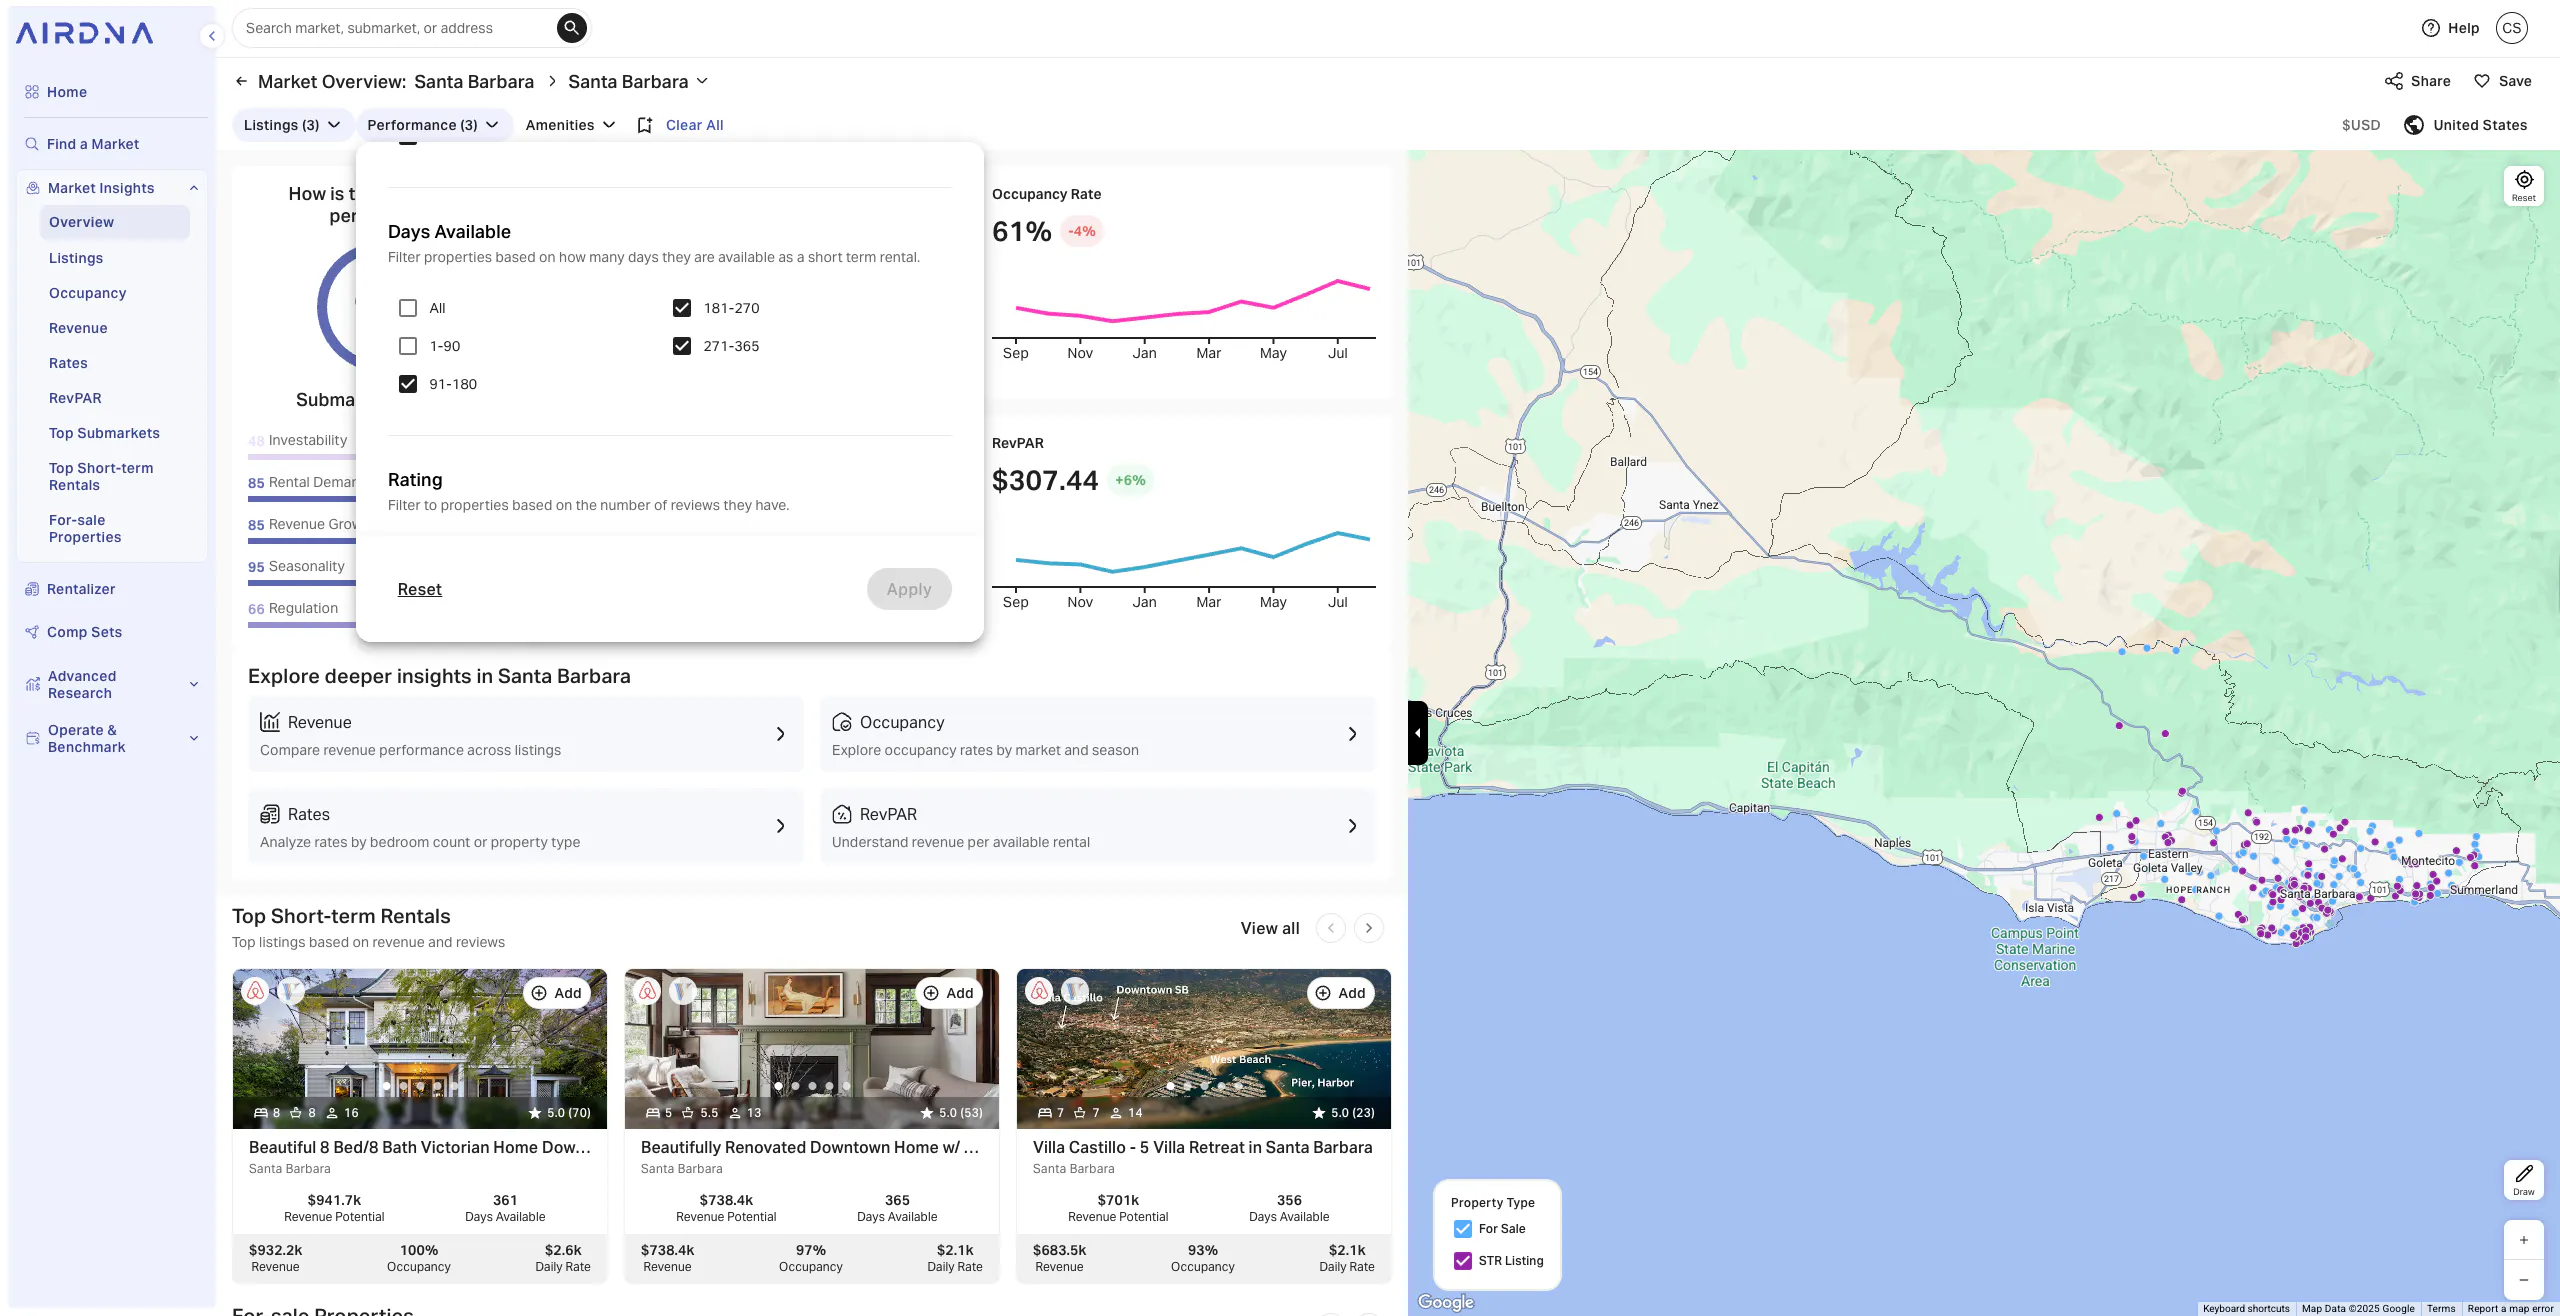
- Availability: At least 90 days per year.
Setting a 90-day minimum helps weed out opportunistic hosts that offer their properties inconsistently. It narrows down performance insights to professional hosts operating during peak season. Be wary of setting a longer availability minimum in seasonal destinations—even successful Airbnbs often close up shop for the winter in coastal areas.
Assuming that you’re an individual operator, you can also exclude professionally managed properties from the results. Short-term rentals under property managers and hosts with large portfolios may have different performance patterns than a mom-and-pop Airbnb host. The goal is to analyze performance information for active short-term rental listings that are most relevant to you because of their similarity in both property type AND hosting style.
Step 3: Analyze occupancy trends
Head to the Occupancy tab in the left-hand navigation menu for your selected market and filters. You’ll find several charts that break down how listings like yours perform across the year.
Here’s what to look for:
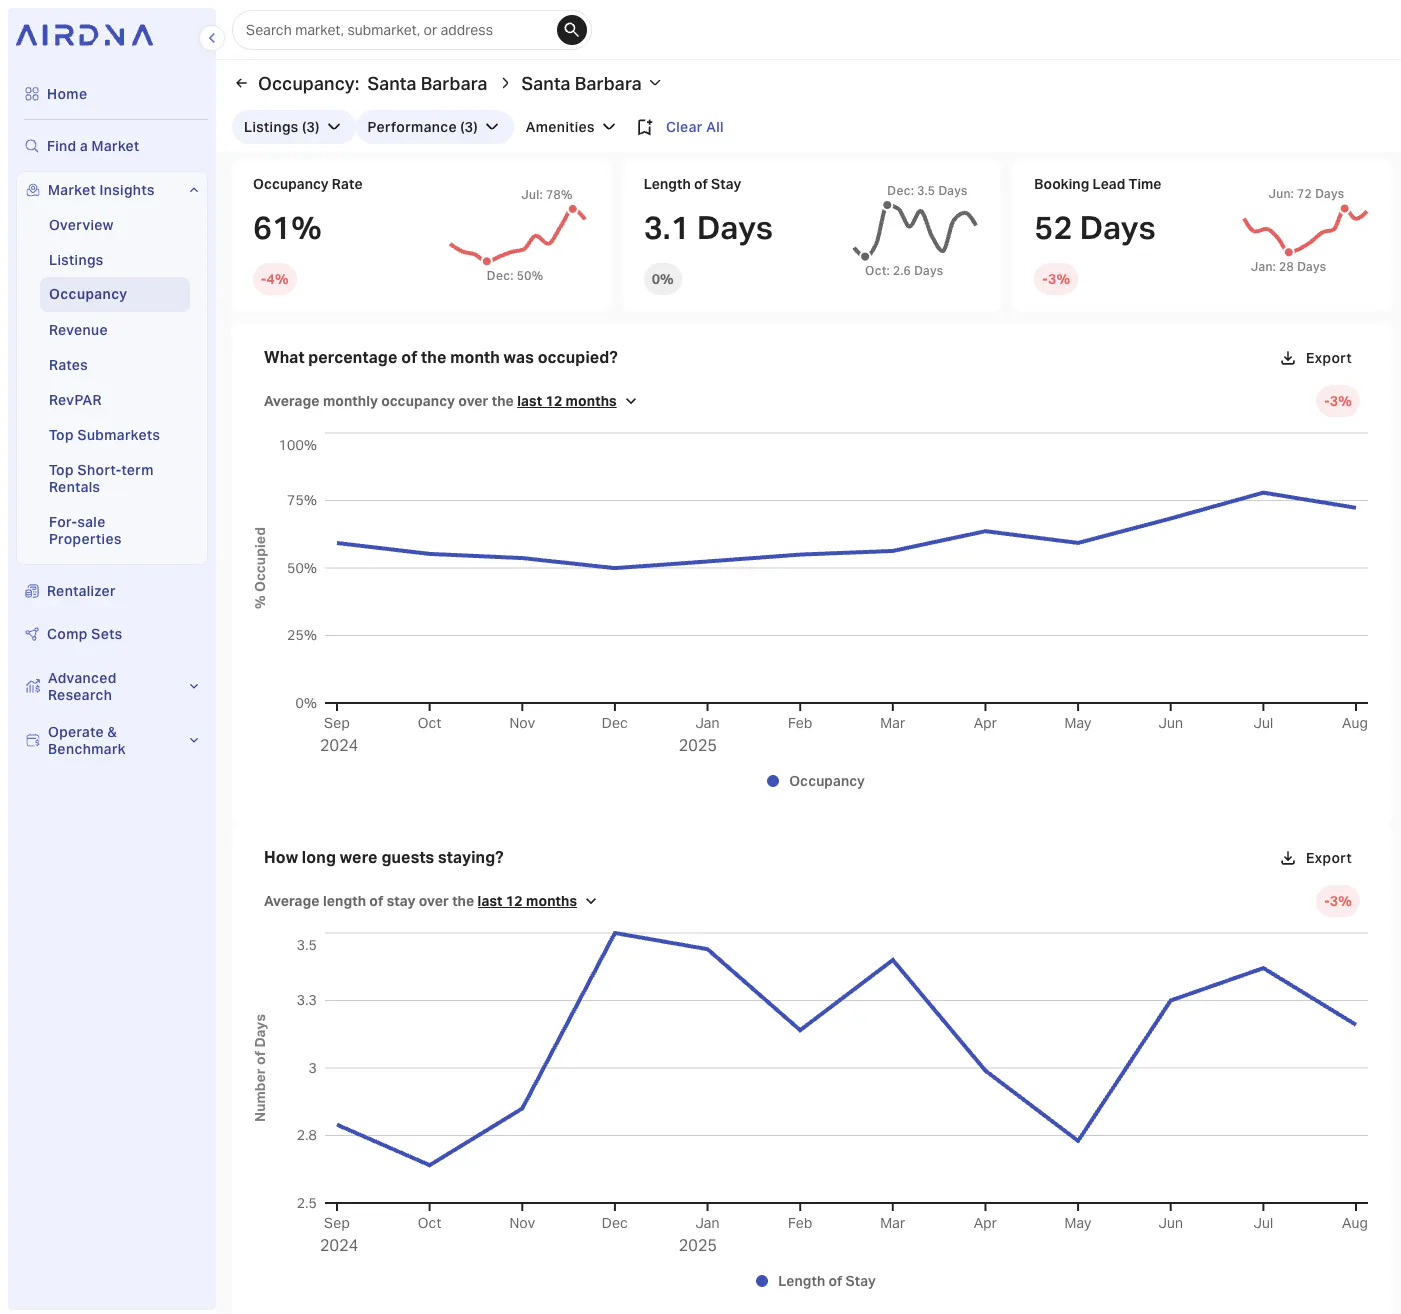
- Average occupancy: In our Santa Barbara example, it’s around 61%. This gives you a solid benchmark to compare your own performance against or set expectations as an investor.
- Seasonal highs and lows: July peaks at 78%, while December dips to 50%. This shows how bookings fluctuate and helps you manage revenue expectations and plan your pricing strategy, marketing, or maintenance in slower months.
- Year-over-year changes: Compare this year’s occupancy rates to last year’s. Are bookings trending up or down? That could point to shifts in demand, increased competition, or pricing pressure in your market. In the case of Santa Barbara, we can see that seasonal highs and lows are becoming more extreme.
Use this data to set realistic goals and fine-tune your strategy. If you're well below average, it might be time to reassess your pricing, listing quality, or amenities. If you're outperforming, it's a sign your approach is working and you may even have room to raise your rates.
Step 4: Refine your benchmark
From here, you can layer on even more detail, like filtering for specific amenities (e.g., pool or hot tub) to see how features impact occupancy. This helps ensure your benchmark reflects how your actual listing is positioned in the market. It also helps you identify value-adds to your property that could make a difference to your occupancy and bottomline
With this level of insight, you’re not guessing . . . you’re basing decisions on real, on-the-ground data.
Step 5: Connect your Airbnb listing to AirDNA
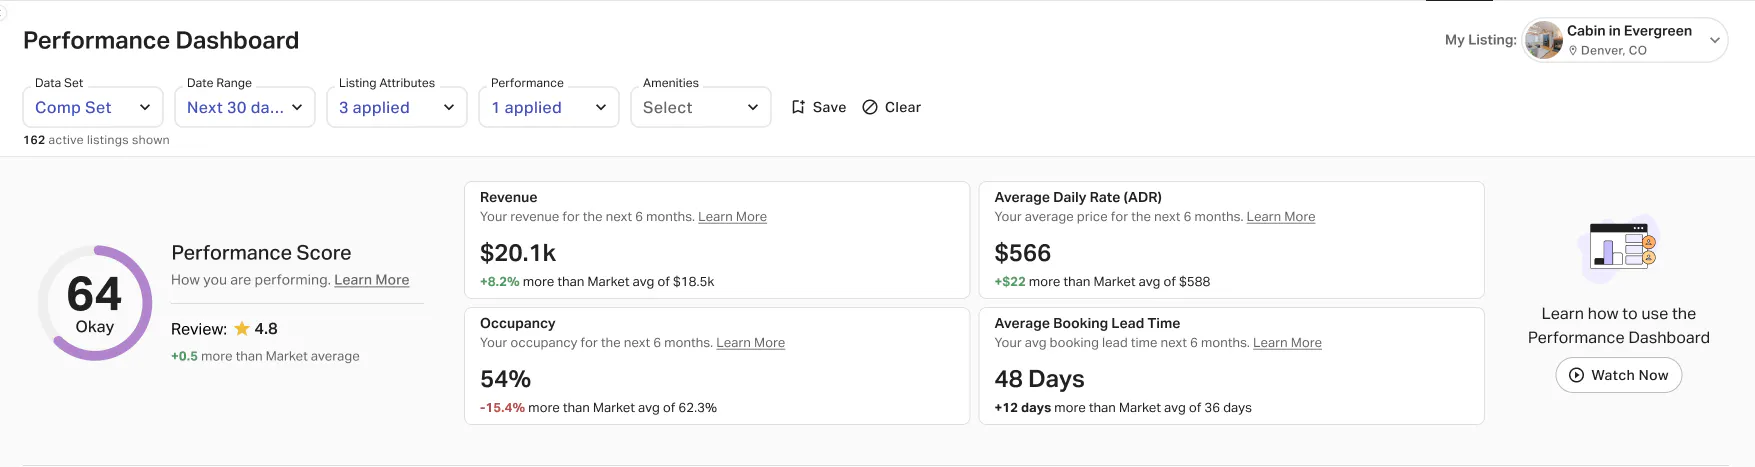
Once you’ve done your market research, you can get insights specific to your particular property by connecting your Airbnb listing to AirDNA. We automatically generate a comp set of similar properties in your area and show you how well you’re performing in comparison. See how your occupancy rate and other metrics stack up to your comp set or the market average in the days to come.
Are you being booked at the same rate for future dates as your top competitors? Are your prices higher or lower over the next 30 days than other short-term rental listings that are competing for those nights? Performance benchmarking unlocks a whole new level of insight into your occupancy rate.
How to Increase Your Airbnb Occupancy Rate
So, your occupancy rate is lower than you'd like. Now what?
The first step is figuring out why. Maybe your pricing isn’t competitive. Maybe your listing isn’t showing up where it should, it’s not optimized for Airbnb’s search algorithm, or it’s not cross-listed on enough OTA platforms.
Once you know what’s holding you back, you can start making smart changes: adjusting your rates, updating your photos, or adding amenities guests in your area actually care about.
We’ve put together a full guide on how to increase your Airbnb occupancy rate using data-backed strategies. For now, just know that low occupancy isn’t the end of the story. It’s just a sign there’s room to grow.
Frequently Asked Questions:
What is a good occupancy rate for an Airbnb?
A good Airbnb occupancy rate typically falls between 60% and 70%. That range often means you're attracting consistent bookings without underpricing your property. What's considered “good,” however, depends on your market, seasonality, and listing type. For example, luxury listings may do well with fewer, high-paying guests, while lower-priced or urban listings often rely on high occupancy to drive revenue.
What is the average Airbnb occupancy rate?
According to AirDNA data, the average Airbnb occupancy rate in the U.S. is 54.4%. That figure has held fairly steady the last few years as the market stabilized after the post-pandemic travel surge. Some high-demand markets like coastal destinations or major cities can exceed that average, while rural or highly seasonal areas tend to fall below it.
How do you calculate your Airbnb occupancy rate?
To calculate your Airbnb occupancy rate, divide the number of nights your property was booked by the number of nights it was available to book, then multiply by 100:
Occupancy Rate = (Booked Nights ÷ Available Nights) × 100
Let’s say your listing was available for 340 nights over the past year and booked for 240 of them. Your occupancy rate would be:
(240 ÷ 340) × 100 = 70.6%
This number gives you a simple snapshot of how often your place is getting booked. Just remember—it doesn’t tell the full story on its own. To really understand performance, compare your rate to similar listings in your market and look at metrics like RevPAR to see how your pricing stacks up.
Where can you see Airbnb occupancy rates?
You can view your own occupancy rate in your Airbnb host dashboard. If you want to see how your property compares to others in your area, AirDNA gives you access to market-wide occupancy data, broken down by location, property type, price tier, and season. This makes it easier to understand whether you're outperforming, on track, or falling behind . . . and what to do about it.
What is the 80/20 rule for Airbnb?
The 80/20 rule suggests that around 80% of your revenue often comes from just 20% of your bookings, usually peak weekends, holidays, or repeat guests. These high-value stays tend to carry more weight than everyday bookings.
With AirDNA data, you can identify which calendar dates, guest types, or pricing strategies drive the bulk of your income. When you know where your profits are really coming from, it’s easier to double down on what’s working (and stop guessing).
ARTICLE SUMMARY
What does a “good” Airbnb occupancy rate actually look like and what does it say about your listing’s performance? This guide breaks down how to interpret, benchmark, and optimize your occupancy rate using real short-term rental data.
Jamie Lane
AirDNA Chief Economist
He is responsible for data analysis, thought leadership, and leveraging advanced analytical techniques to provide new insights into short-term rental market trends. Native to Atlanta and an Airbnb host himself, Jamie enjoys cycling, mountain biking, backpacking, running, and playing in a dart league in his free time.