European Market Review: April Setback Offset By Year-Over-Year Growth in Summer Demand
Published: May 22, 2024
Last updated: February 24, 2025

Linda Rollins
With Easter’s shift to March, April demand took a tumble last month. Demand nights across the European continent totaled 29.7M, rising 1% year-over-year (YOY). Compared to March’s 28.8% YOY increase in demand, however, this was a steep decline.
Despite sluggish demand, listing growth did not slow. Listings increased 15.7% YOY in April. With listing growth in the double digits and weak demand growth, occupancy declined 11.7% last month. This represents a sharp reversal from the 10.4% occupancy growth we saw in March.
At a Glance: April STR Performance in Europe
- Available listings were up 15.7% year-over-year (YOY)
- Demand increased 1% YOY
- Average daily rates (ADR) rose 5.2% YOY to 165 €
- Occupancy was down 11.7% YOY and down 14.1% compared to 2019
- RevPAR declined 7.2% YOY to 83 €
- Booked nights increased 17.9% YOY
Looking at short-term rental (STR) performance for both March and April, we see performance align with overall growth trends we’ve seen in Europe this year.
Demand growth over the last two months averaged 12.5% YOY while available listing growth averaged 17.7% YOY. With listing growth far exceeding demand growth, occupancy dipped 2.6% YOY but average daily rates (ADRs) kept growing at a rate of 7.2% YOY.
March & April Combined STR Performance
- Available listings increased 17.7% YOY
- Demand increased 12.5% YOY
- Average daily rates (ADR) rose 7.2% YOY to 163 €
- Occupancy was down 2.6% YOY and down 7.3% compared to 2019
- RevPAR grew 4.5% YOY to 84 €
- Booked nights increased 16% YOY

The State of the European Economy
The European economy avoided recession in 2023 with an annual GDP growth of 0.4%. In its macroeconomic projections report in March, the European Central Bank (ECB) forecasted 0.6% GDP growth for the European economy in 2024, a slight decline from its December projection of 0.8%. The first quarter of 2024 saw GDP growth of 0.3%, but growth is expected to pick up in the second half of 2024.
The ECB maintains that private consumption will continue to be the main driver of economic growth in 2024. Private consumption is expected to increase by 1.2% due to declining inflation, a resilient labor market, and growing household disposable incomes.
As of April 2024, inflation for the Euro area stood at 2.4%. The ECB projects that inflation will decline from an average of 5.4% in 2023 to 2.3% in 2024. Employment growth was 1.4% in 2023 and, while 2024 will see a slowdown in growth, total employment is still expected to grow 0.5%. The ECB predicts that wages will grow by 4.5% in 2024 thanks to continued strength in the labor market.
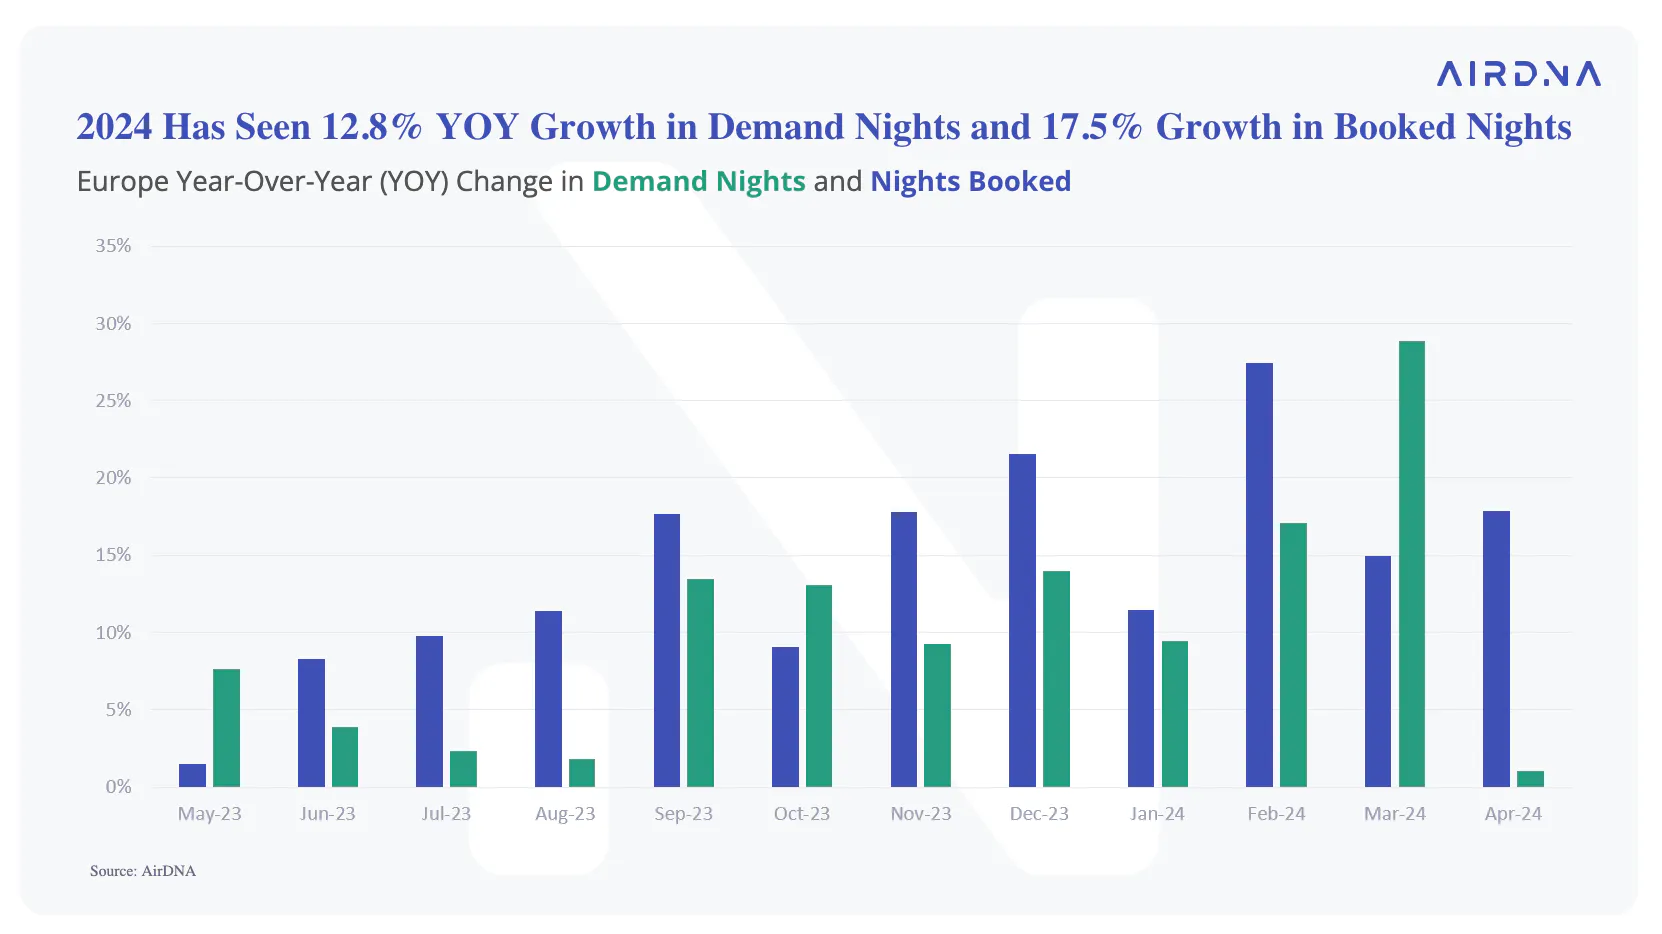
Growth in STR demand and booked nights thus far in 2024 also offers good reason to be optimistic about more disposable income and consumer spending this year. Both nights stayed so far and nights booked for future travels have been at all time highs for European STRs. The year-to-date growth in nights stayed averages 12.8% YOY and growth in booked nights averages 17.5% YOY.
Listing Growth Continues to Climb while ADR Growth Declines
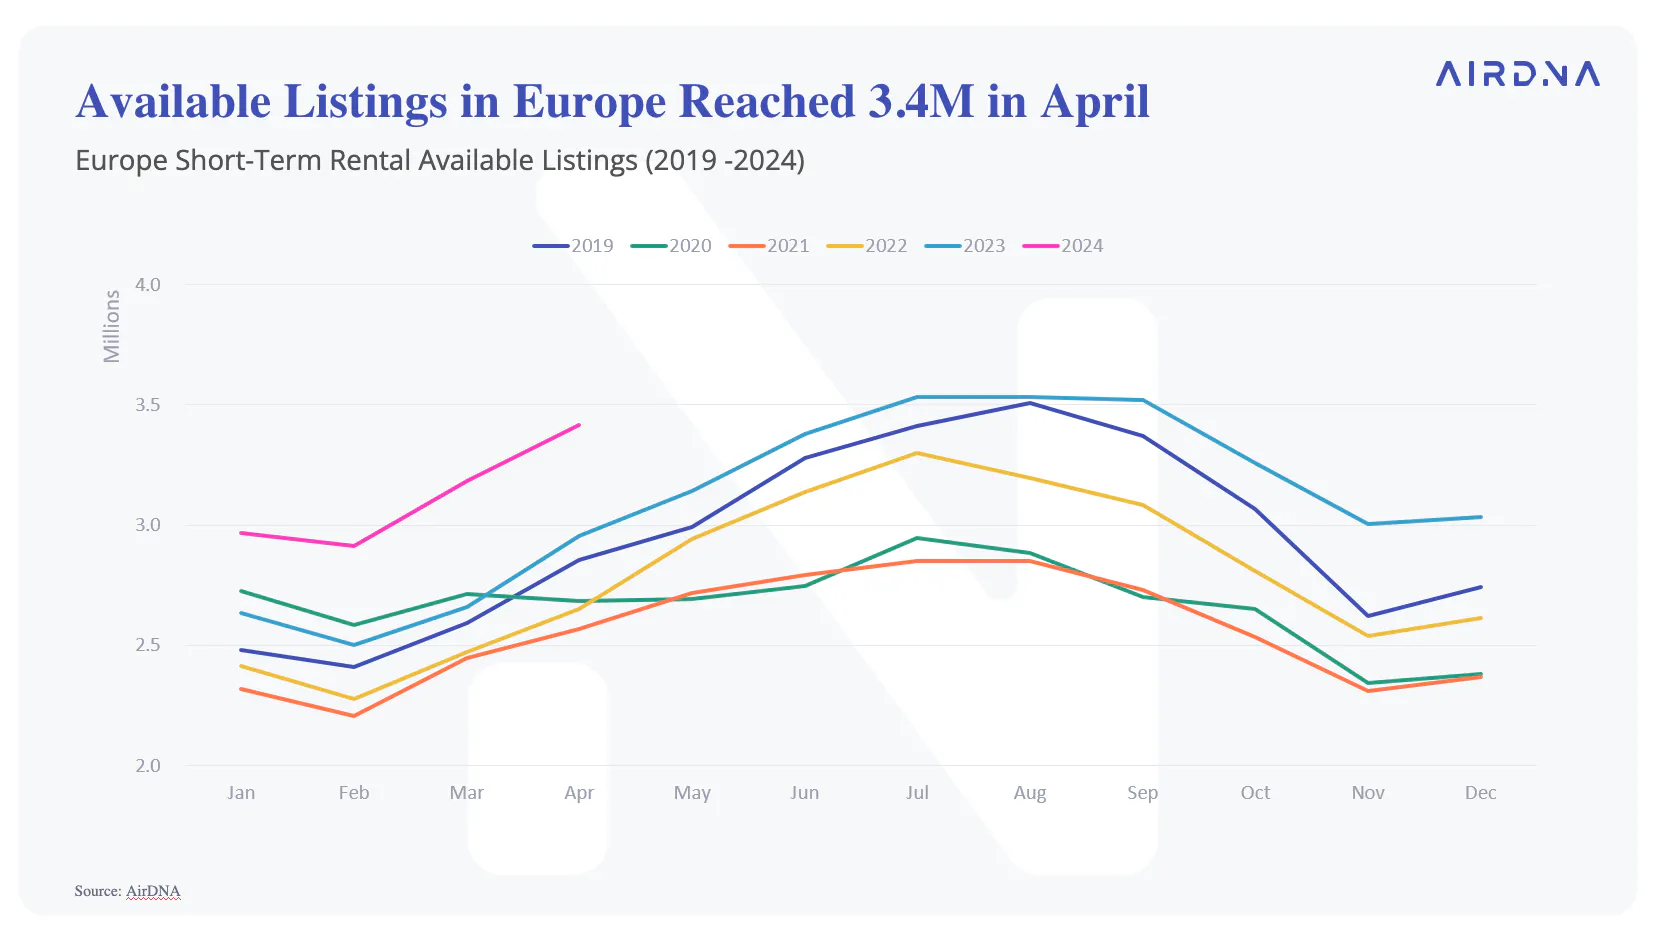
With summer just around the corner, the number of listings on the market is ramping up quickly. Available listings totaled 3.4M in April, up 7% compared to March. New listings continue to add fuel to supply growth. The European continent added 137K new listings last month, which made up 4.3% of all available listings in April.
New listings can sometimes shift aggregate ADRs in a market. Our repeat rent index (RRI) isolates the performance of existing properties and removes the effect of new listings. By comparing RRI to the ADR performance of new and existing properties (mix shift), we’re able to identify how new properties impact total market performance.
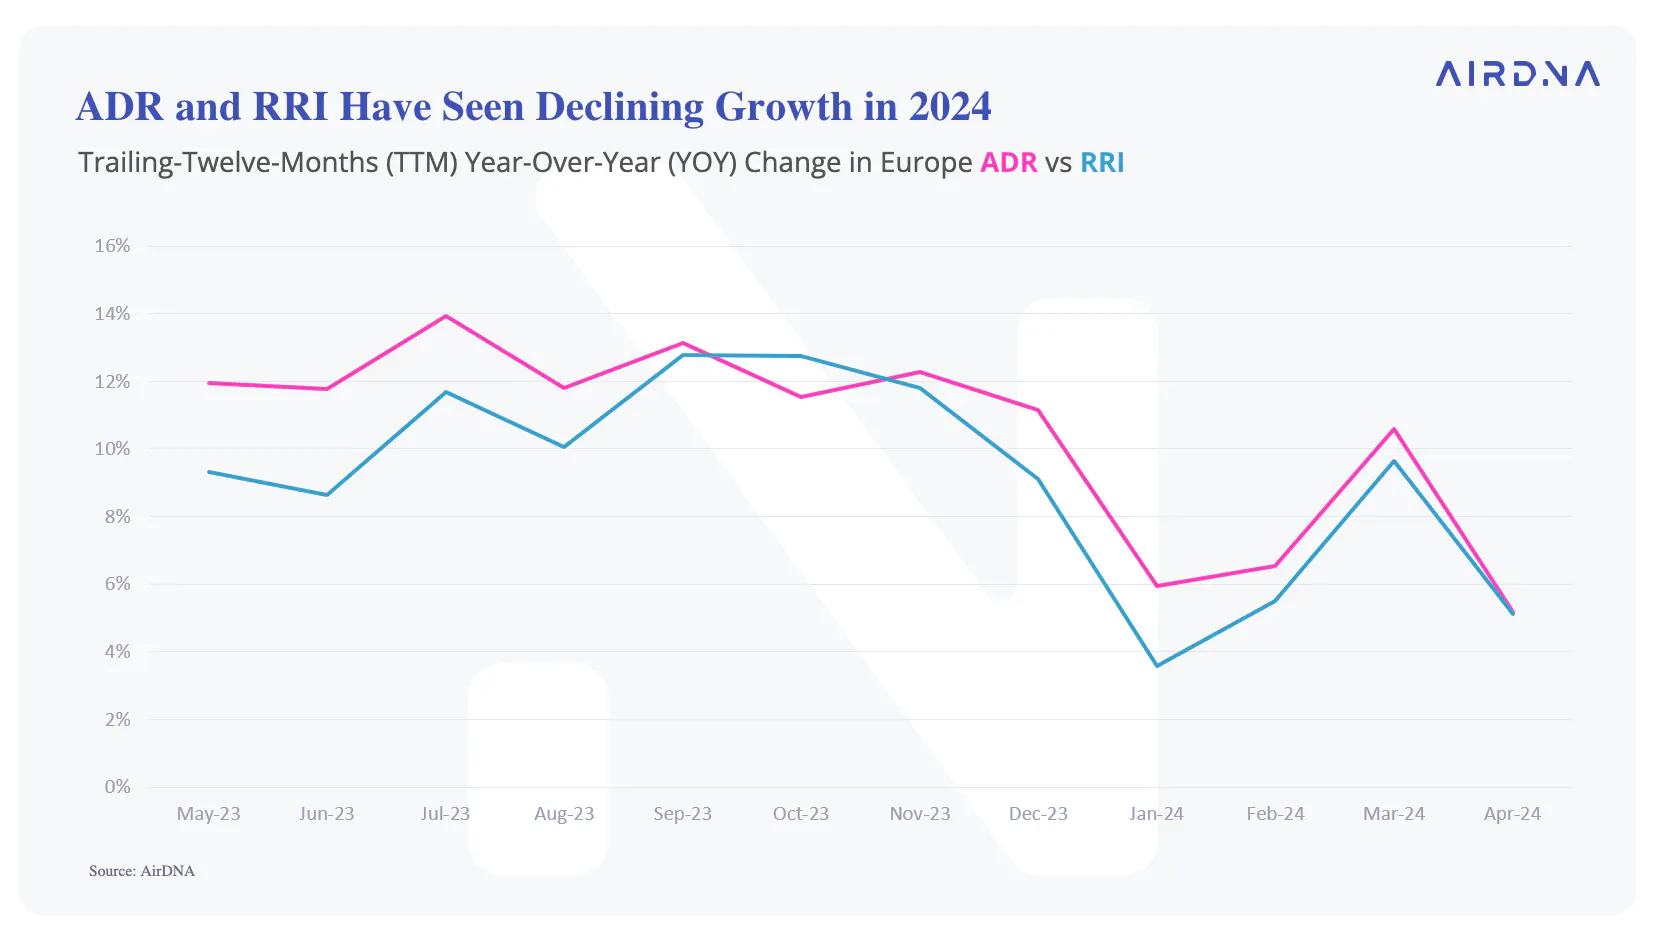
So far for 2024, we’ve seen similar growth rates for RRI and ADR for Europe. This indicates that new listings are charging comparable nightly rates (ADR) to existing supply.
However, ADR and RRI growth this year has slowed significantly compared to summer and fall of last year. In the second half of 2023, YOY ADR growth averaged 12.3% while RRI growth averaged 11.4%. With declining occupancy chipping away at the pricing power of hosts, averaged YOY ADR growth has slowed to 7.1% while YOY RRI growth has averaged 6% so far in 2024.
ADR and RRI Growth Varies by Country
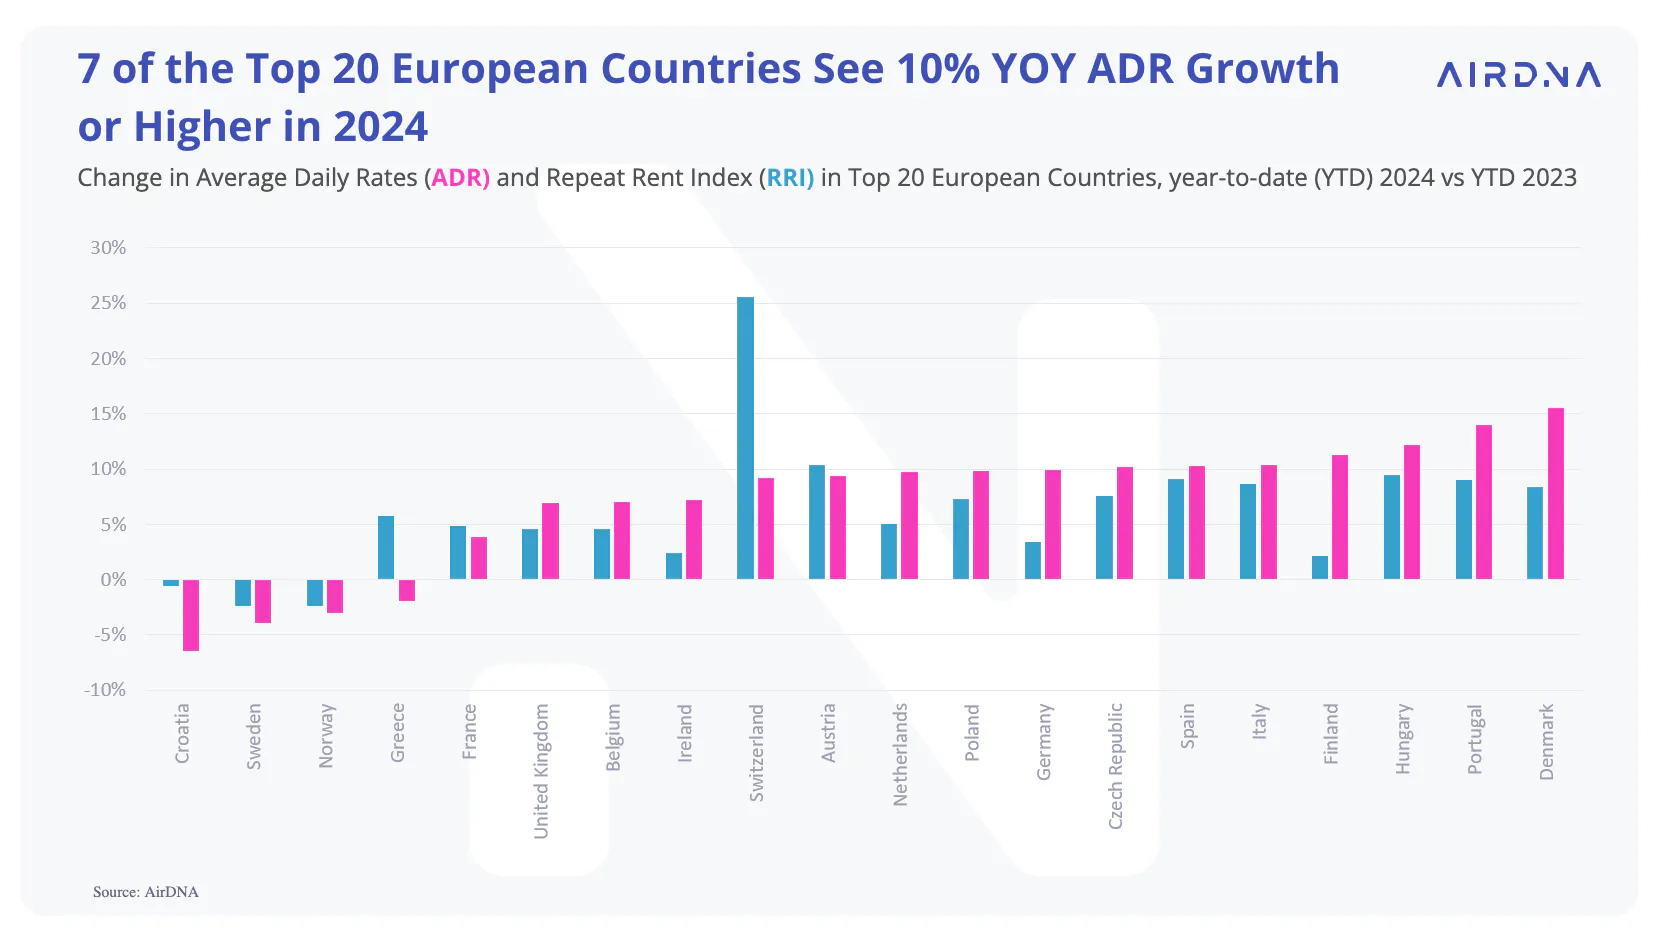
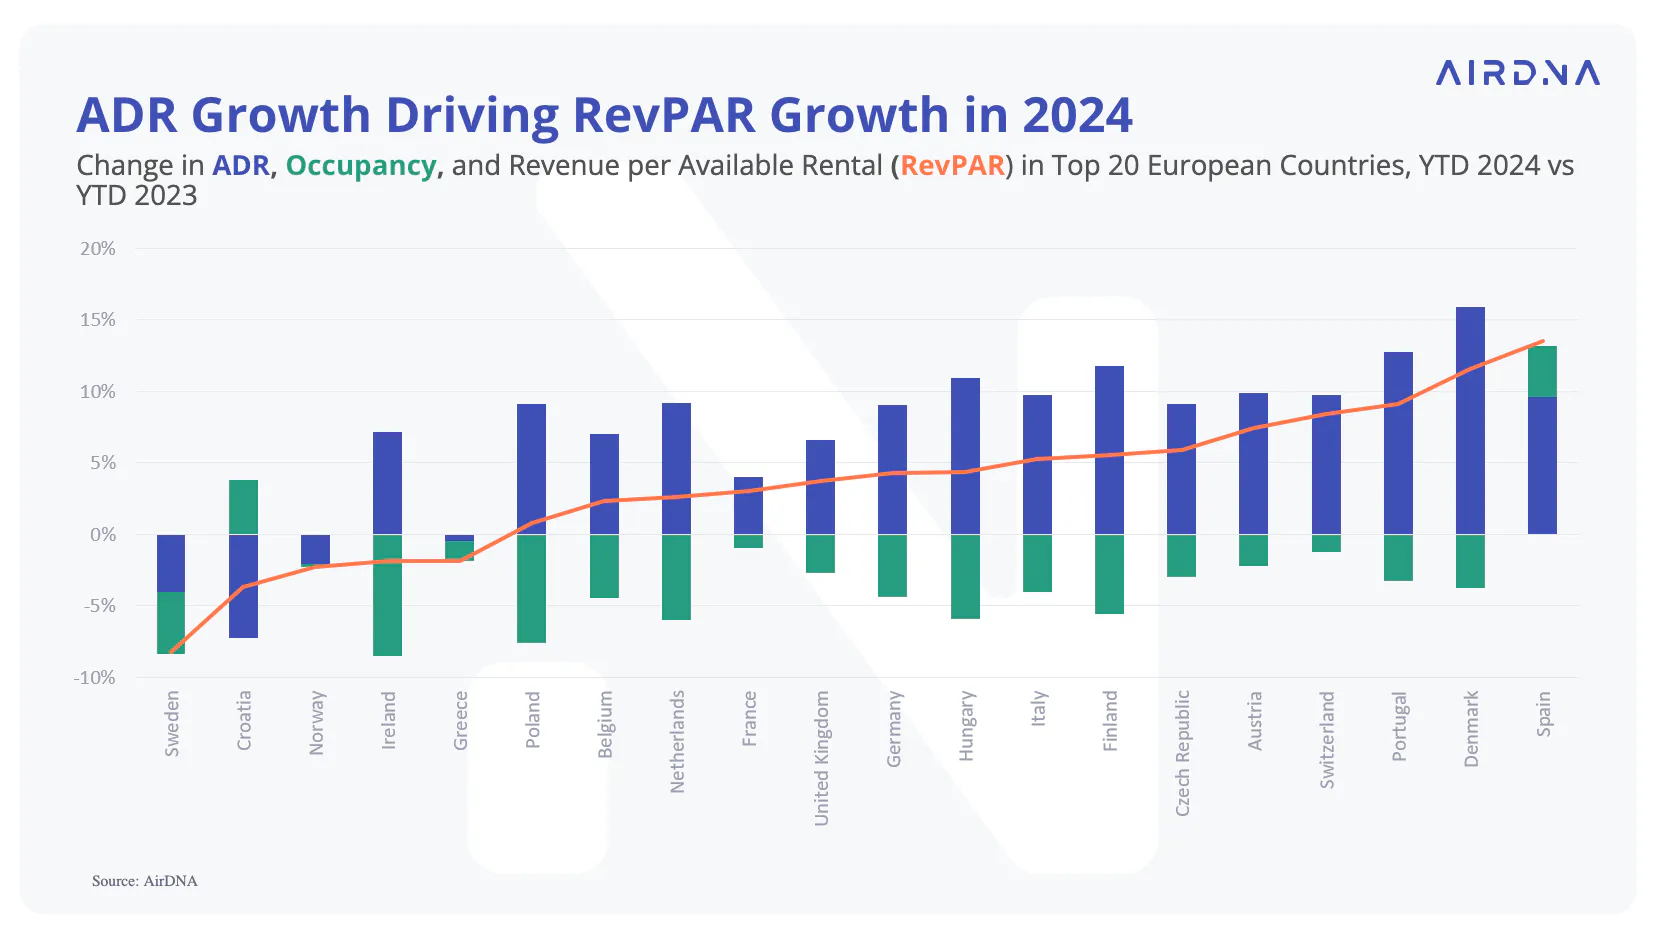
Among the top 20 European countries, year-to-date ADR growth ranges from -6% to 15% year-over-year (YOY).
Countries that are leading YOY ADR growth so far this year are:
- Denmark (+15.5%)
- Portugal (+14.0%)
- Hungary (+12.2%)
In all three countries, more expensive new listings are playing a big part in driving up overall ADRs in the market. In Denmark, for example, ADR growth for the overall market is an impressive 15.5% YOY. RRI growth, which only looks at pricing power changes for existing hosts, is more modest at 8.4% YOY.

In Portugal, rates for existing properties (RRI) have grown 9% YOY but rates for the overall market (ADR) have increased 14% so far this year.
Countries that have lagged in ADR growth YOY so far in 2024 are:
- Norway (-3.0%)
- Sweden (-3.9%)
- Croatia (-6.4%)
In all three countries, the rate at which new listings are being added outpaces demand. The result is crippled occupancy and lost pricing power for hosts. New vacation rentals are entering the market at lower rates, driving down overall ADRs in all three countries.
In Croatia, for example, rates for existing properties have declined 0.6% YOY. Overall rates in the market, however, have declined 6.4% so far this year.
The two countries that are seeing the greatest difference between RRI and ADR growth are Switzerland and Finland.
In Finland, new supply growth has largely favored larger properties in the last year. RRI has seen a modest 2.1% YOY increase, but the larger and more expensive homes coming onto the market have driven overall ADRs in Finland up by a significantly larger margin of 11.3% so far this year.
In Switzerland, new STR listings tend to be for smaller properties, which has lowered overall ADR growth of the market to 9.2%. Existing properties, on the other hand, have seen an impressive 25.5% YOY growth thus far this year.
RevPAR Growth Is Driven by ADR Growth
ADR growth and occupancy growth are what comprise growth in revenue per available rental (RevPAR). With occupancy down year-over-year (YOY) in almost all of the top 20 European countries, ADR growth has largely been the driver of RevPAR growth.
Countries that have been lagging in ADR growth so far this year are seeing the weakest RevPAR growth. On the flip side, countries that have seen strong ADR growth are seeing RevPAR gains.
Spain is the only country that has seen both ADR and occupancy growth in 2024. It’s leading Europe with RevPAR growth of 13.5% YOY.
2024 Summer Is on Track to Beat 2023 Demand
Summer is just around the corner, which means the biggest season for European STR travel is almost here. Last year, stays during the summer months of June, July, and August made up 37.3% of total demand nights. Earnings during the summer months of June through August made up 40% of all short-term rental (STR) revenue in 2023.
Current demand pacing for Europe is pointing to another record breaking summer for STRs. Pacing is the rate at which reservations are made for a particular date in the future.
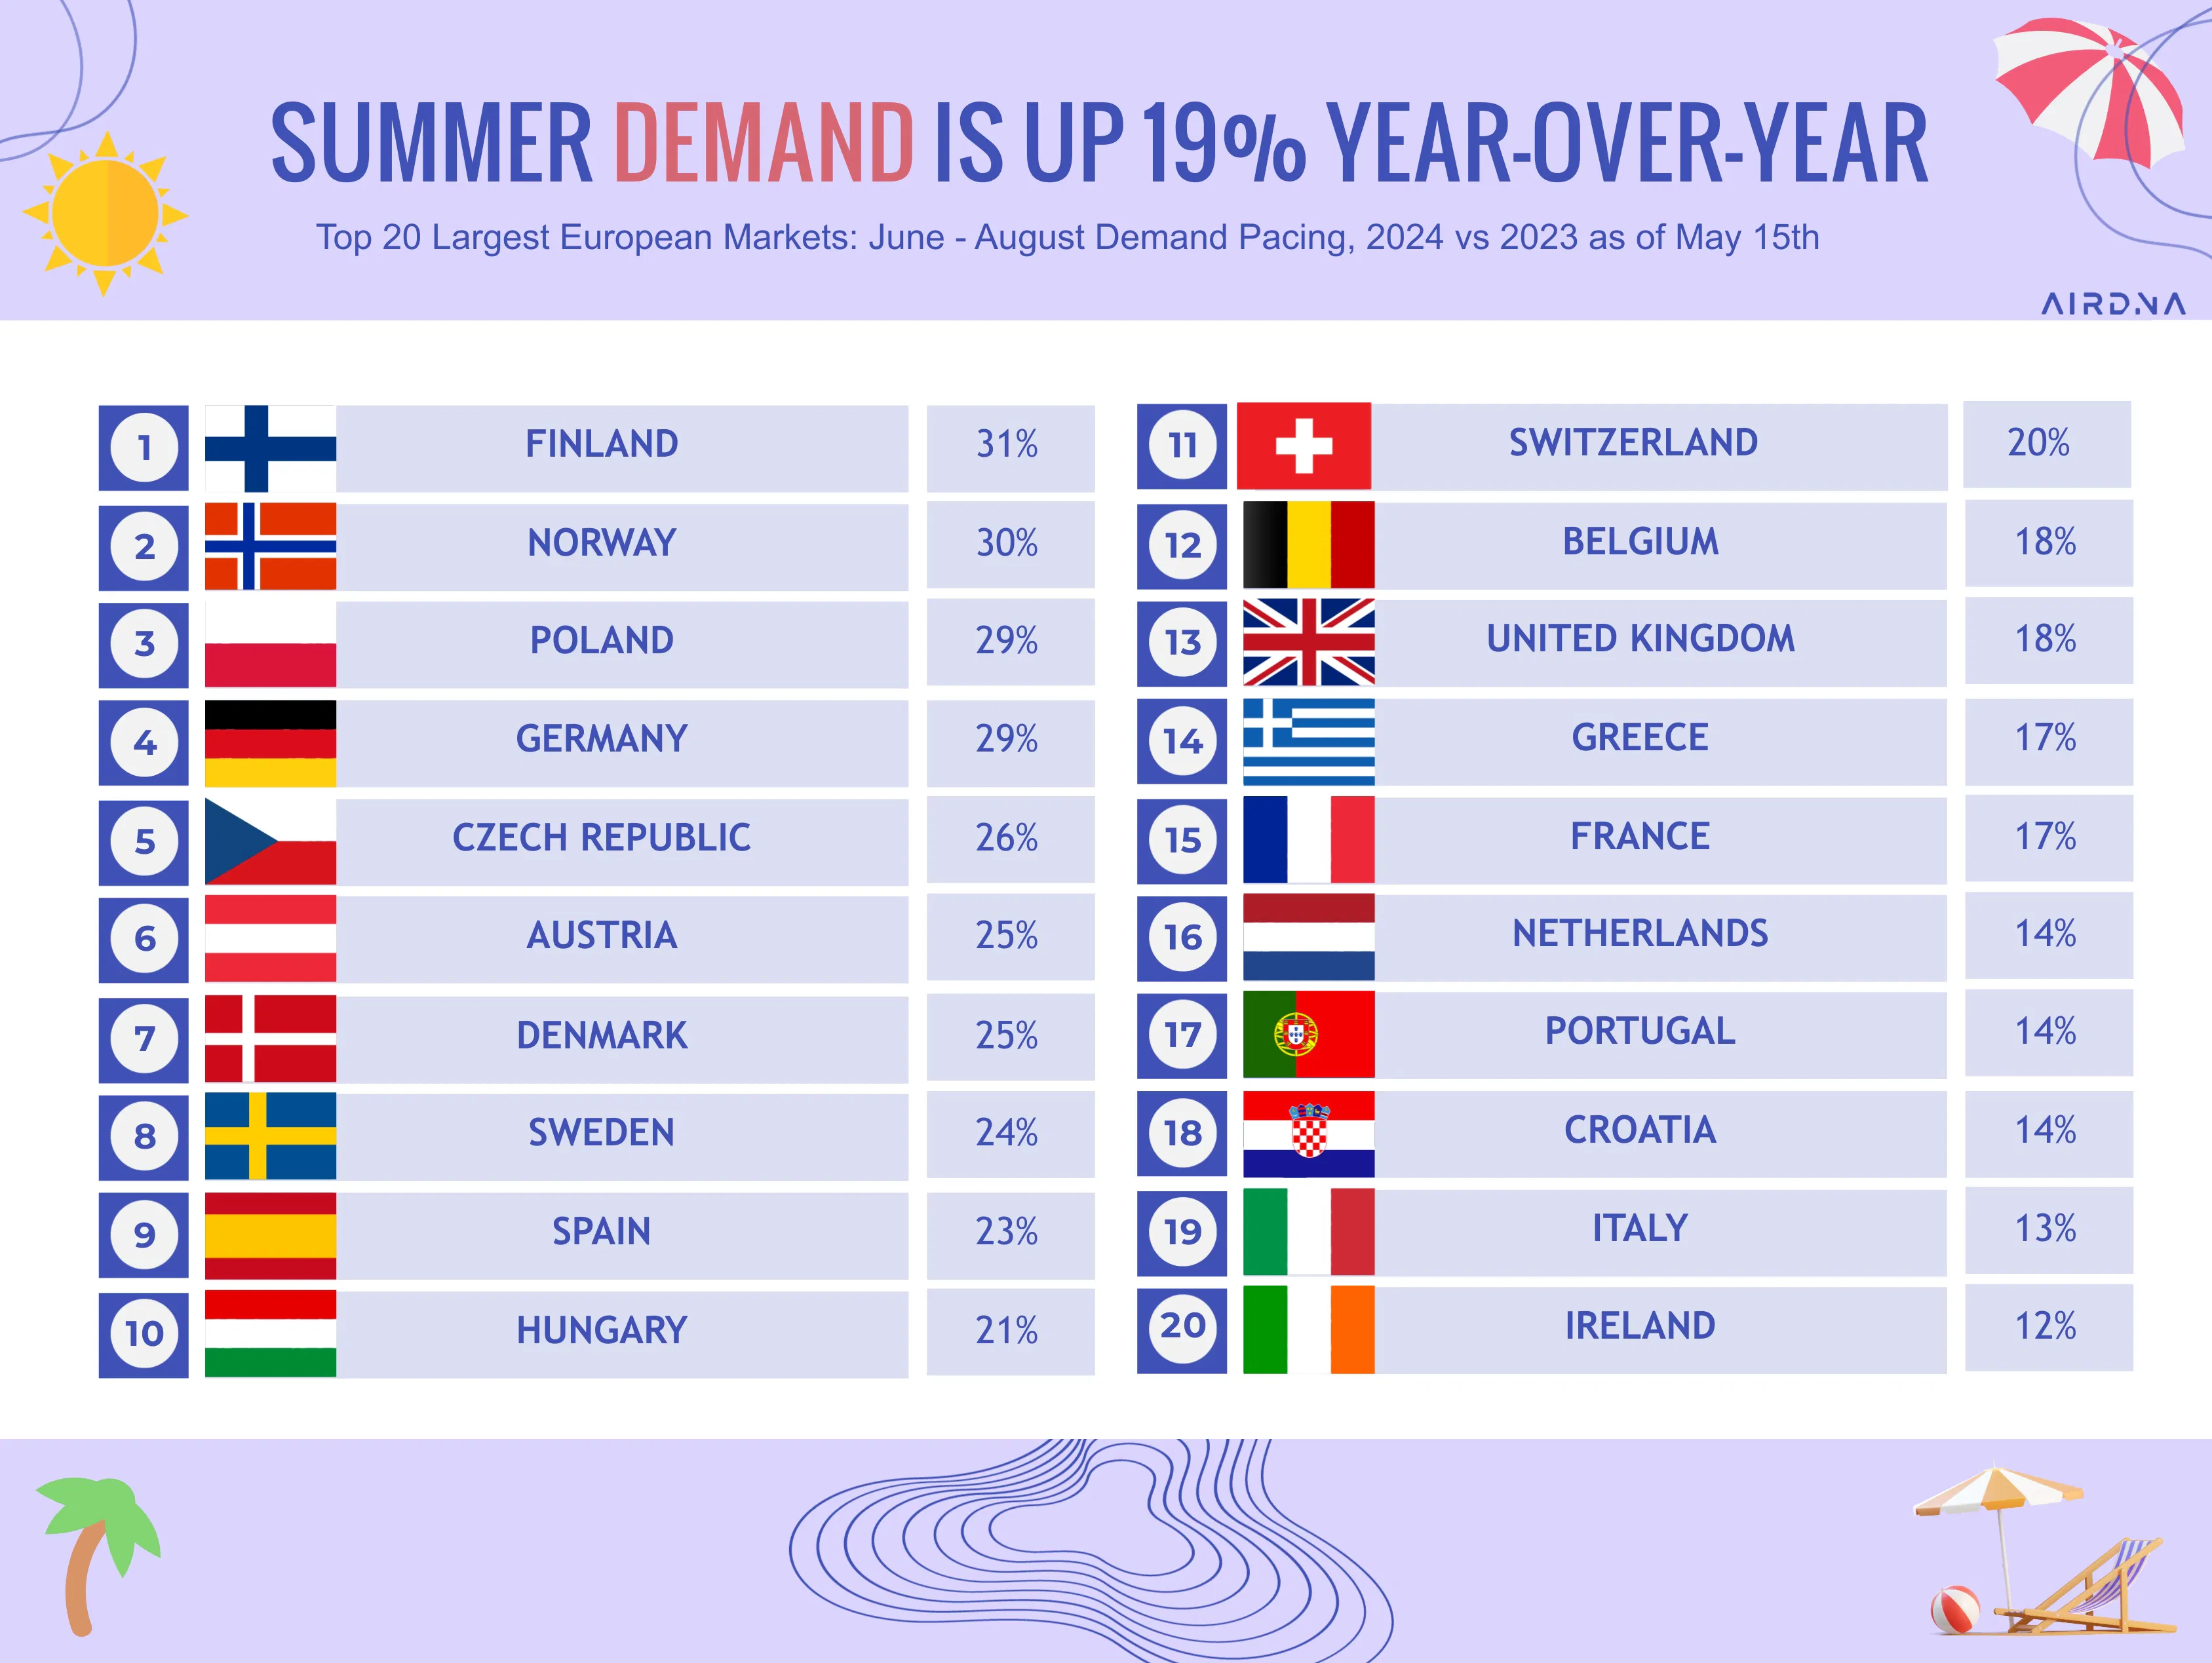
Demand on the books for June through August is up 19% YOY.
June and July are both seeing 17% YOY growth in demand pacing while August is seeing 22% YOY growth.
Among the top five countries that are seeing the most YOY demand pacing growth, a familiar list of northern and eastern European countries are taking the lead:
- Finland (+31%)
- Norway (+30%)
- Poland (+29%)
- Germany (+29%)
- Czech Republic (+26%)

Among the bottom five countries where demand pacing is lagging, we have a mix of countries where demand has been lagging over the last year (Ireland, Croatia, and the Netherlands) as well as countries that saw impressive demand growth last summer (Italy & Portugal). The latter group is potentially seeing a slowdown in demand growth this year.
- Netherlands (+14%)
- Portugal (+14%)
- Croatia (+14%)
- Italy (+13%)
- Ireland (+12%)
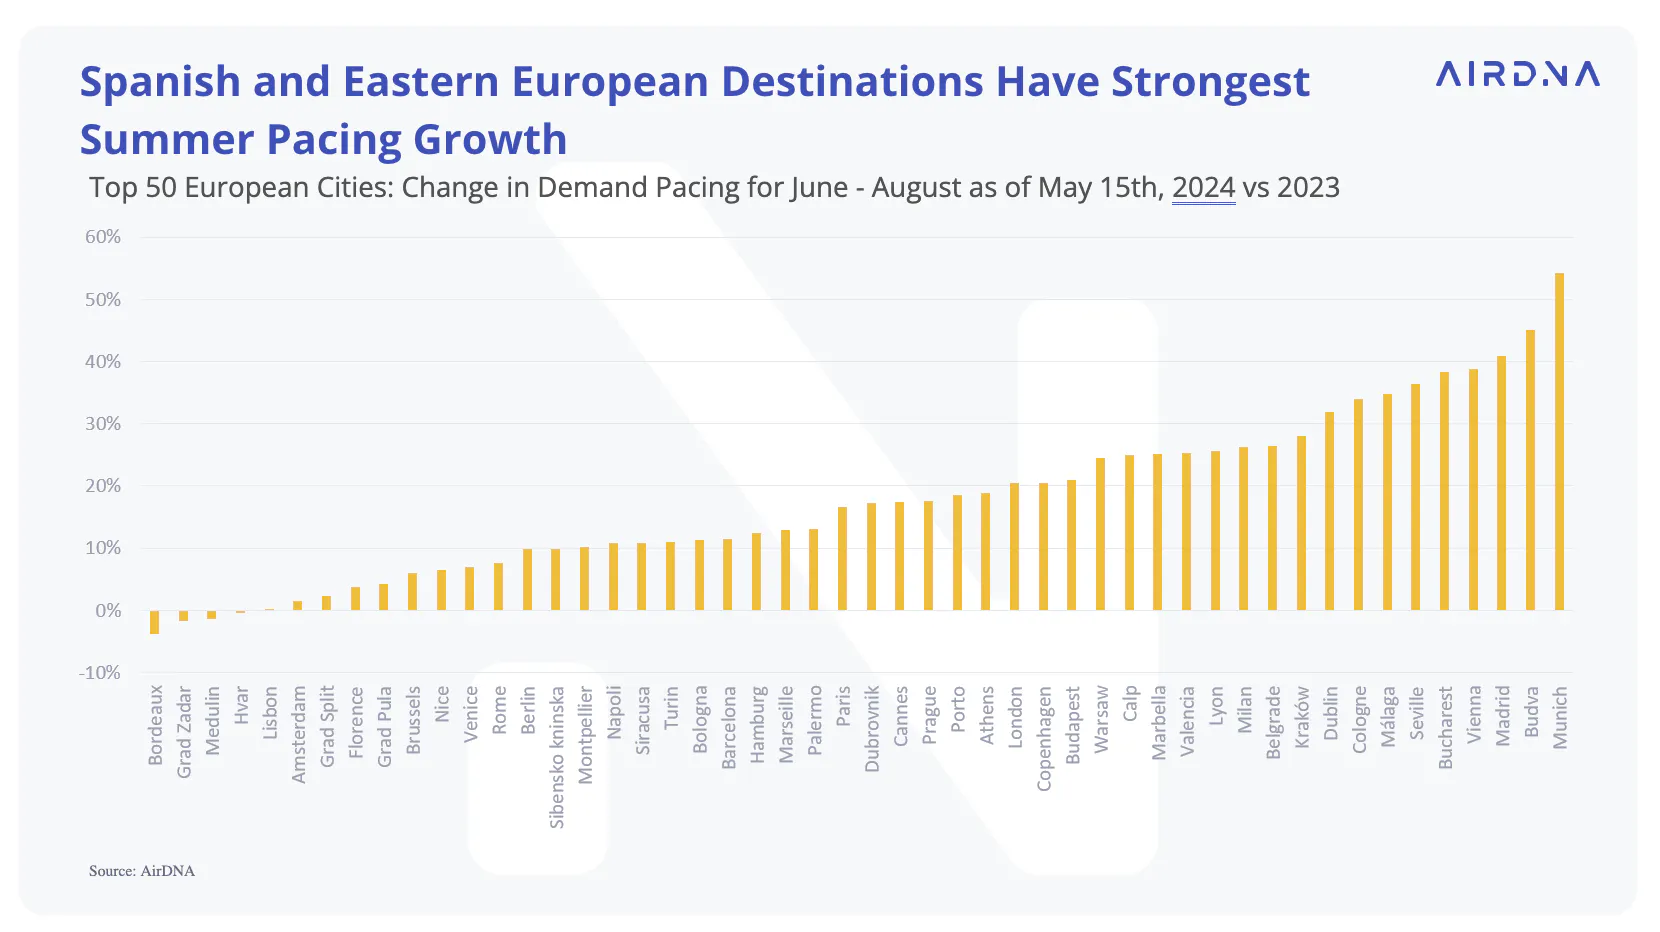
Looking at pacing for 50 European cities, we’re seeing several Eastern European capitals as well as Spanish cities ranking in the top 10 for demand pacing growth this summer. At the bottom of the list are several Croatian cities as well as a few Italian cities.
Many Summer European Stays Have Yet to Be Booked
What we’re seeing for demand on the books right now is only a fraction of what we might see as we get closer to the summer travel months.
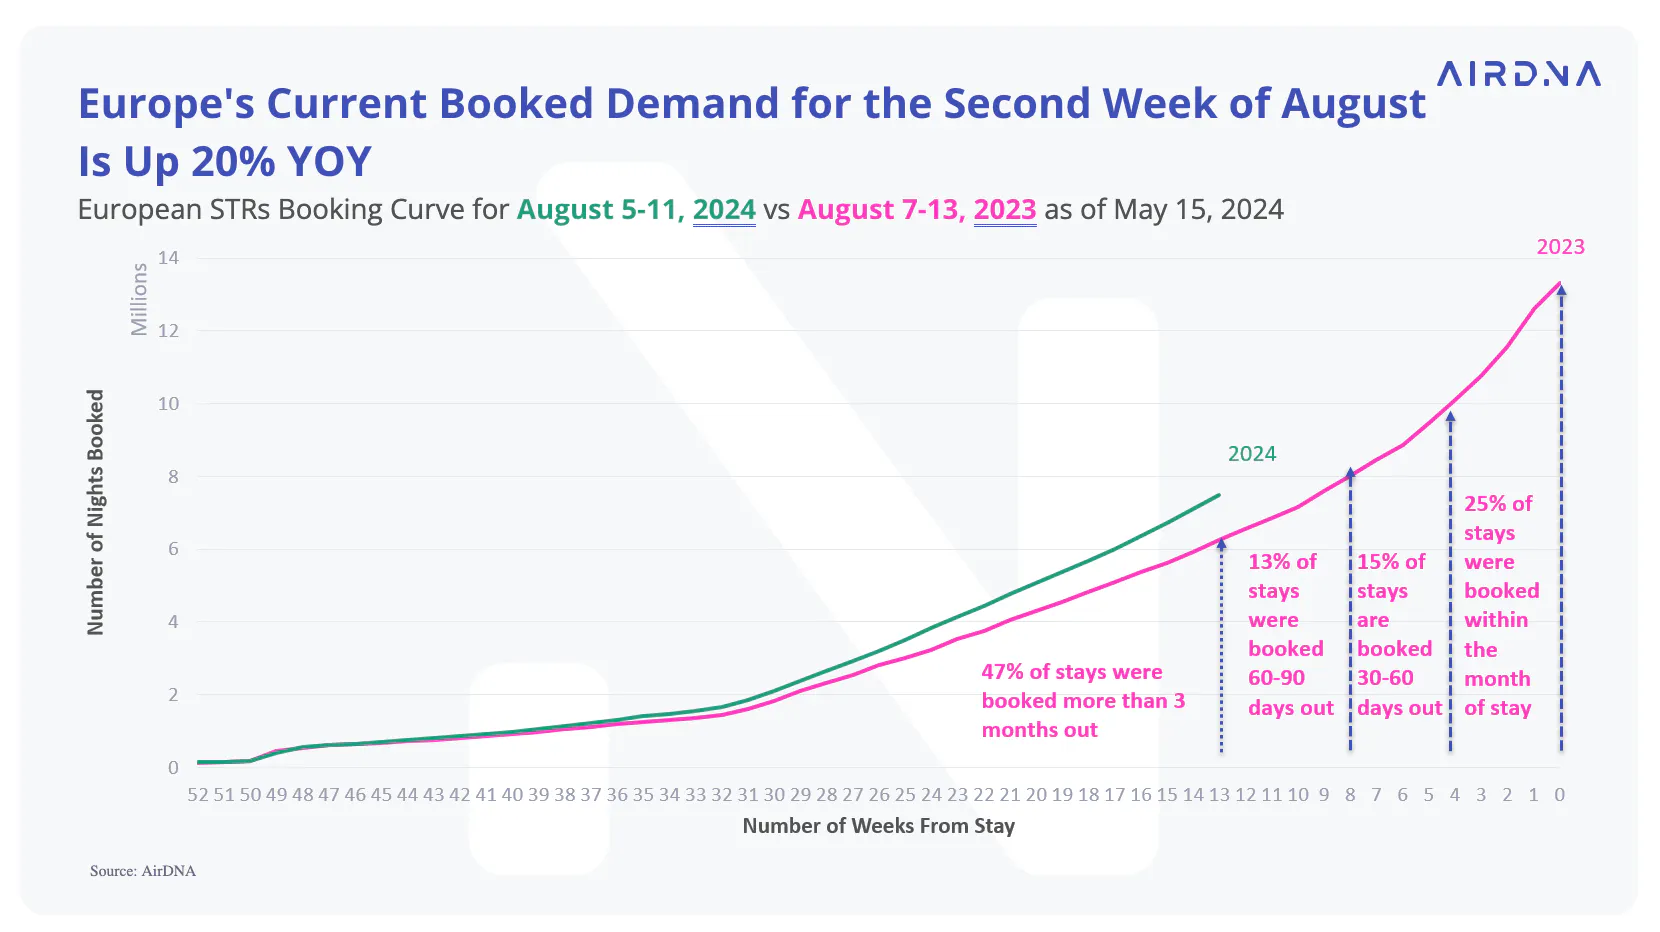
In Europe, the second week of August is typically when STR demand reaches its peak of the year. When we look at the booking curve for the second week of August last year, we see that at this time last year (about 90 days out), only 46% of stays had been booked for that week.
By 60 days out, 60% of stays for August 7-13 were booked. By 30 days out, 75% of stays were reserved. The remaining 25% of stays for the second week of August were booked within a month of the stay.
When a large percentage of stays are booked within 60 days of the stay, it means that the demand we’re currently seeing in a market can change significantly as the dates we’re analyzing approach.
If this year’s booking curve for the second week of August is similar to last year’s, then more than half of stays for the second week of August have yet to be booked. Current demand on the books is 20% higher than the same time last year, but that may change as the second week of August gets closer.
Peak Summer Season Brings Pricing Power
Pacing for booked rates is also showing promising returns for STR hosts this summer. ADRs are currently pacing 9% higher year-over-year (YOY) for June through August.
The destinations with the greatest ADR growth include a few countries that have also seen strong demand growth so far this year:
- Denmark (+27%)
- United Kingdom (+16%)
- Spain (+14%)
- Poland (+13%)
- Germany (+13%)

The countries that are seeing more modest growth in ADR pacing this summer have been seeing occupancy declines chip away at pricing power:
- Hungary (+5%)
- Norway (+4%)
- Sweden (+2%)
- Greece (+1%)
- Croatia (-3%)
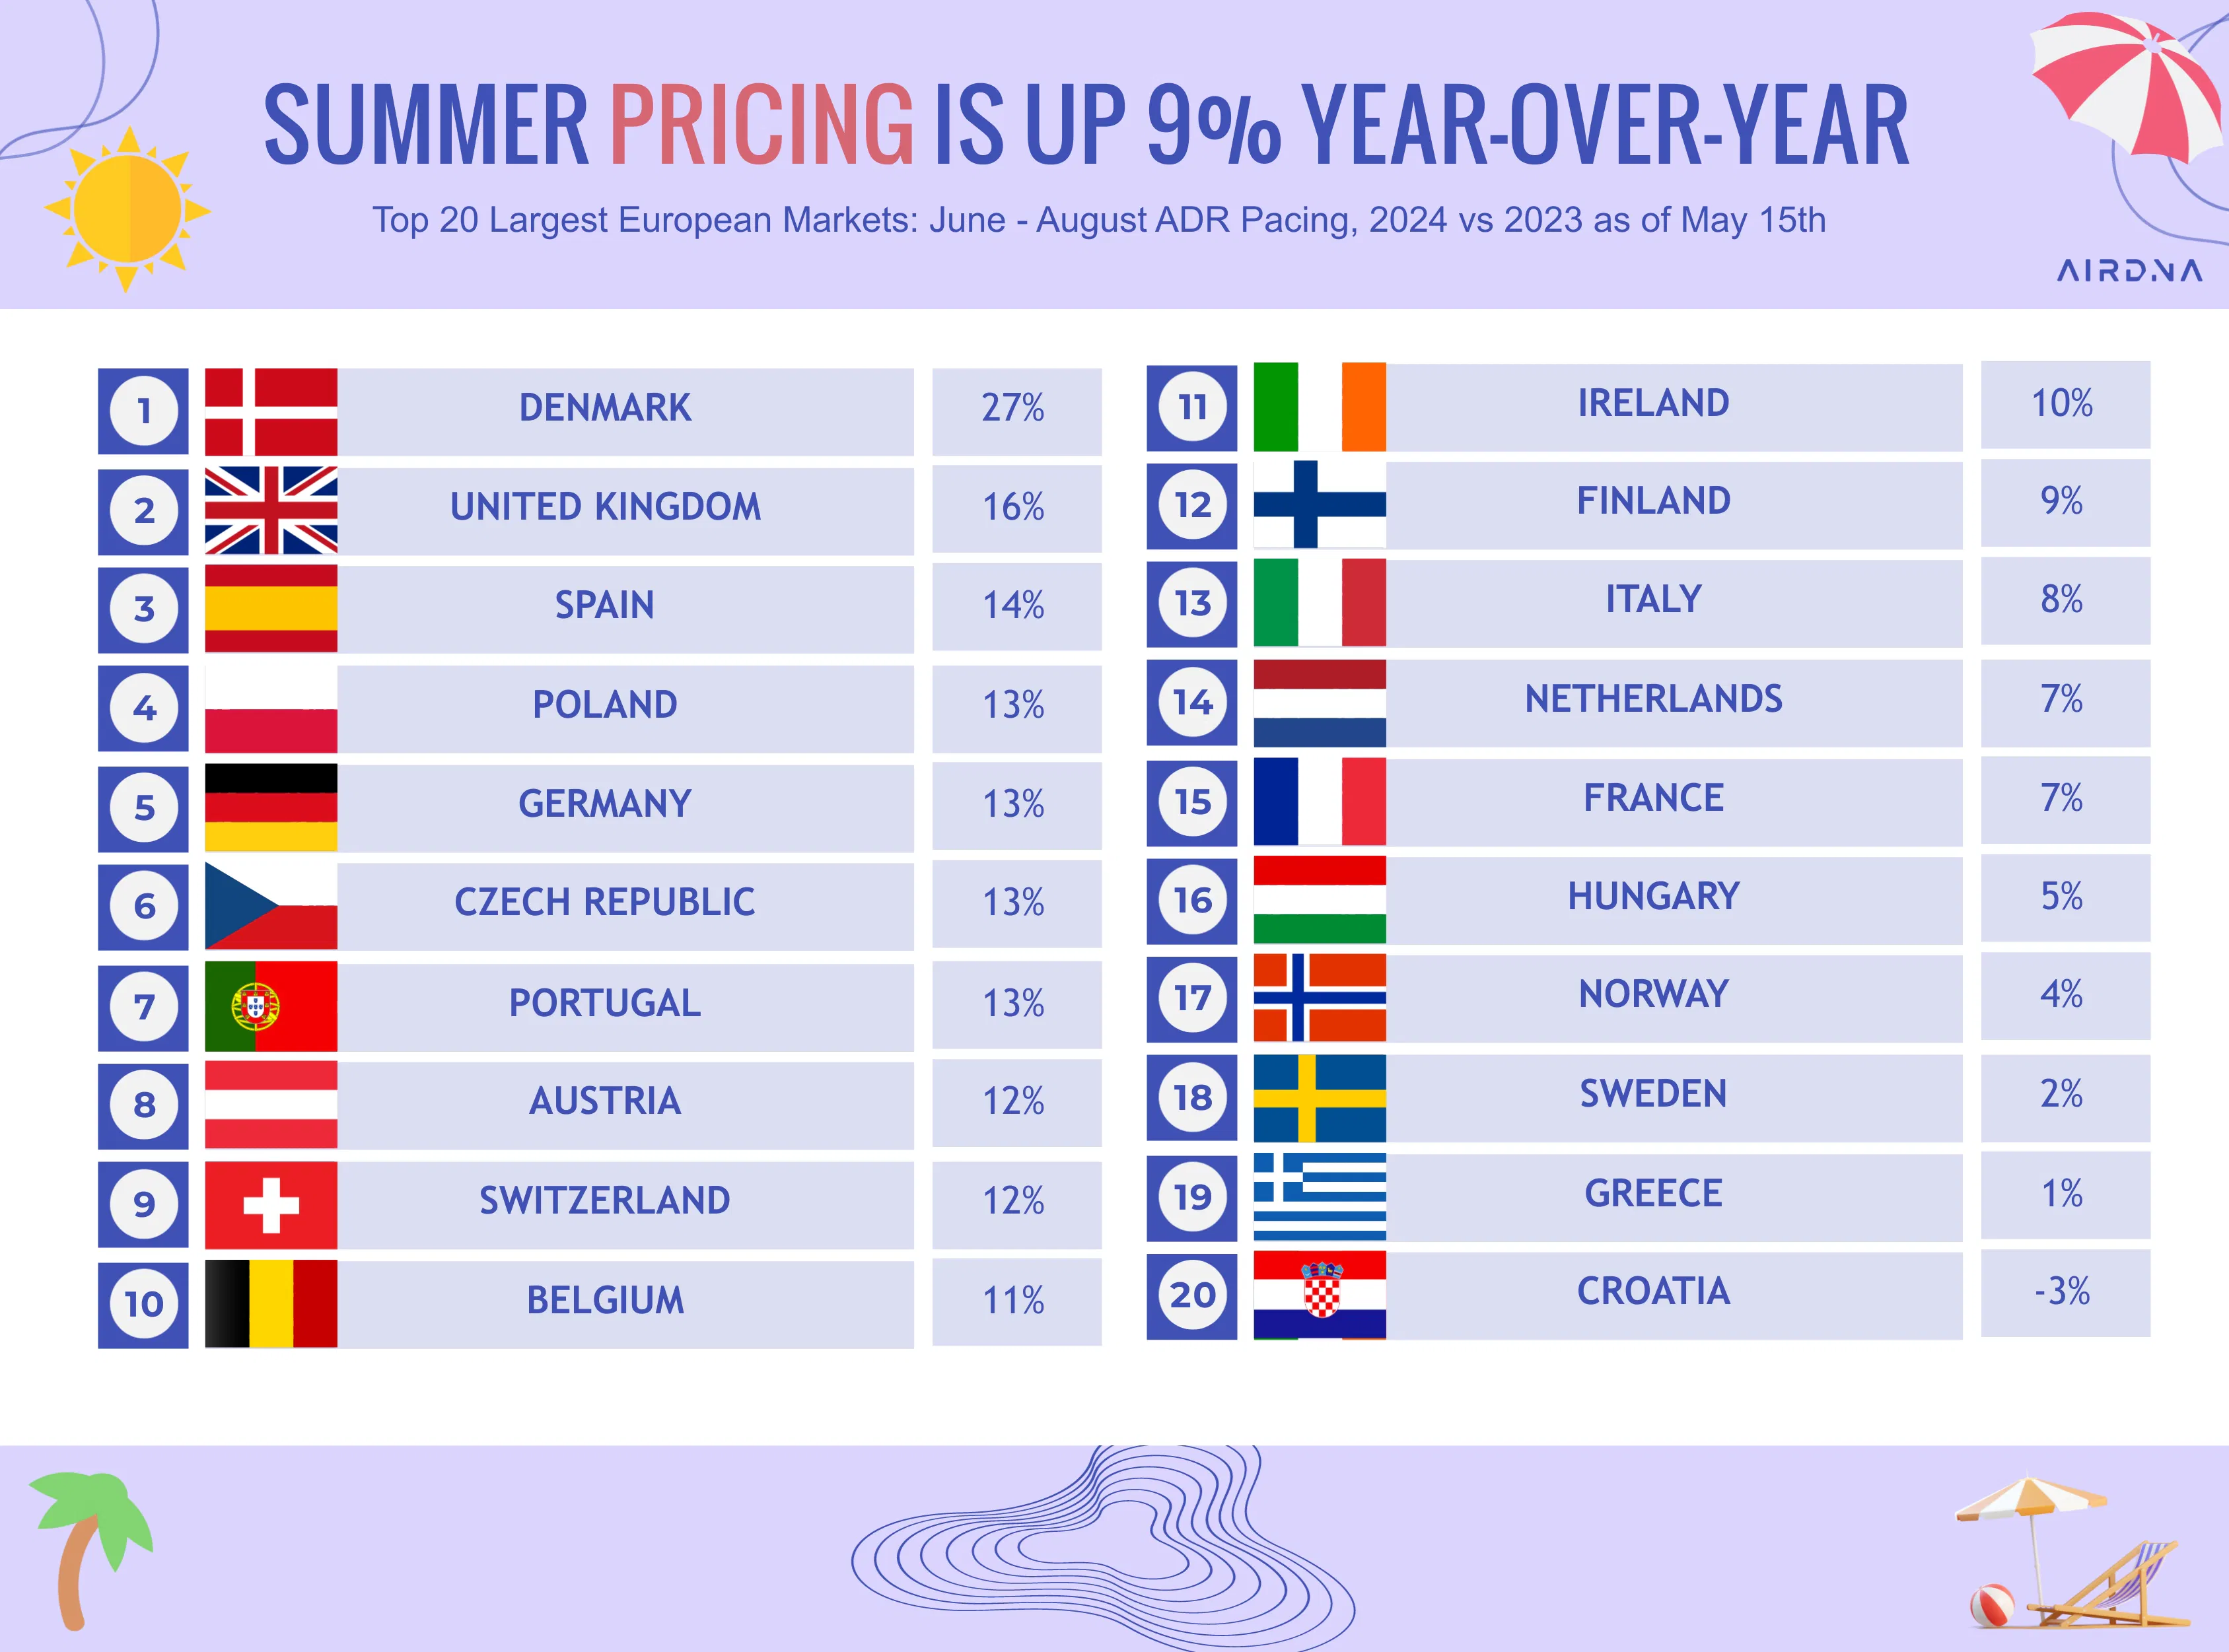
For those of you that haven’t booked your European travels yet, explore the following snapshot of how summer ADRS are currently looking across Europe. It can give you an idea of some of the cheapest and most expensive countries to travel to this summer.
Southern European destinations will likely cost you a pretty penny to travel to this summer, but eastern Europe might be a good option if you’re looking to ball on a budget.
ARTICLE SUMMARY
April saw a slowdown in demand for European short-term rentals due to Easter's early occurrence, affecting occupancy negatively despite an increase in listings. There’s reason for optimism, though, with strong booking growth and demand for summer across various European countries.
Linda Rollins
Senior Research Analyst
Linda Rollins is a Senior Research Analyst at AirDNA and a self-managing short-term rental host, which means she understands the market as both an analyst and an operator. She writes research and blogs for AirDNA and for Adapt, its revenue management tool, making her work a go-to resource for investors trying to find and size up the right opportunities, and for operators looking to understand changing market dynamics and find concrete ways to improve occupancy, rates, and guest experience. Her data is regularly cited in major news outlets, and she has a knack for bringing both the numbers and the story behind them. In her free time, Linda enjoys spending time with her family, traveling, and looking for good eats.