


U.S. Market Review: STR Market Breaks All-Time Demand Record; Phoenix Beats the Heat | AirDNA
Published: August 14, 2023
Last updated: May 5, 2026

Scott Sage
July 2023 broke the record for the most short-term rental (STR) stays in one month, with 24.1 million nights stayed, beating the previous high recorded in July 2022 by 6.5%. Although slower than June’s demand growth of 9.7% on a year-over-year (YOY) basis, the results were especially impressive amid a searing heatwave, increasing interest in off-season booking, and inflation-weary consumers looking for budget options.
Helping travelers and hosts in July was an economy that stubbornly refuses to show signs of recession. According to the Bureau of Labor Statistics, total employment picked up slightly in July, with 187,000 jobs added — compared to 185,000 in June. This was enough to leave the unemployment rate hovering near its lowest point in 50 years but also represents a sustainable level of hiring. Hourly earnings continued increasing at a moderately swift pace of 4.4% YOY, helping workers earn back some of the inflation-adjusted losses to wages seen during peak inflation.
The remaining sticking point for the U.S. economy had been the ongoing inflation in excess of the Federal Reserve target of 2%. With the latest rate hike in July, there has been some speculation that the Fed has approached the top of its interest rate cycle. The recent inflation report adds some weight to this theory, as prices increased 3.2% YOY in July, essentially the same as consensus expectations. Although slightly higher than the June rate, July inflation came off of a difficult prior-year comparison, as prices did not increase at all in July 2022.
The moderate inflation picture, sustainable hiring level, and expectation of mild economic weakness toward the end of the year point to the Fed pausing or potentially ending its rate-hiking regime. On the other hand, rate cuts that facilitate housing transactions probably will not occur until next year.
At a Glance: Key U.S. STR Performance Metrics for July 2023
- RevPAR declined 6% YOY to $228.14
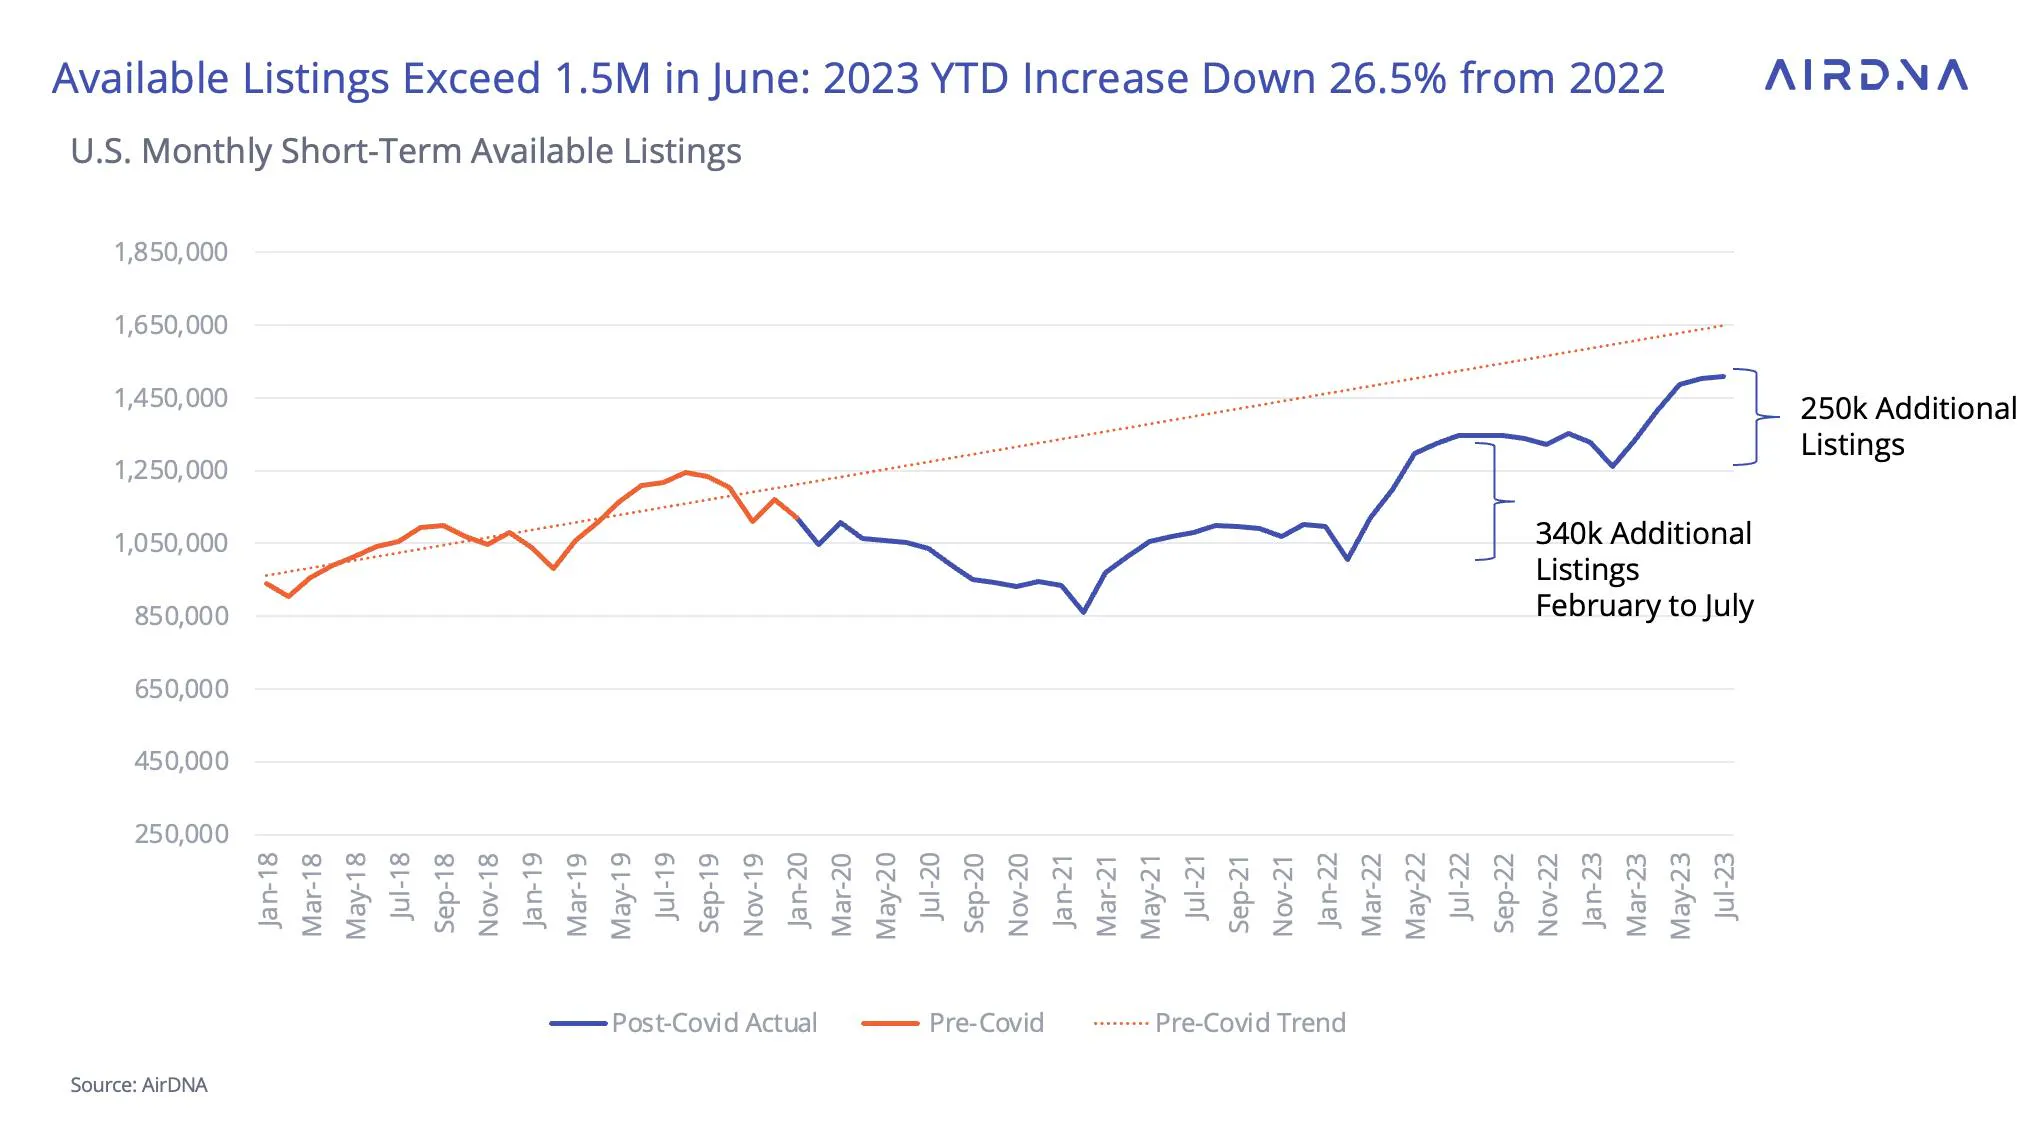
- Available listings reached 1.51 million, up 12.1% YOY
- Total demand (nights) rose 6.5% YOY
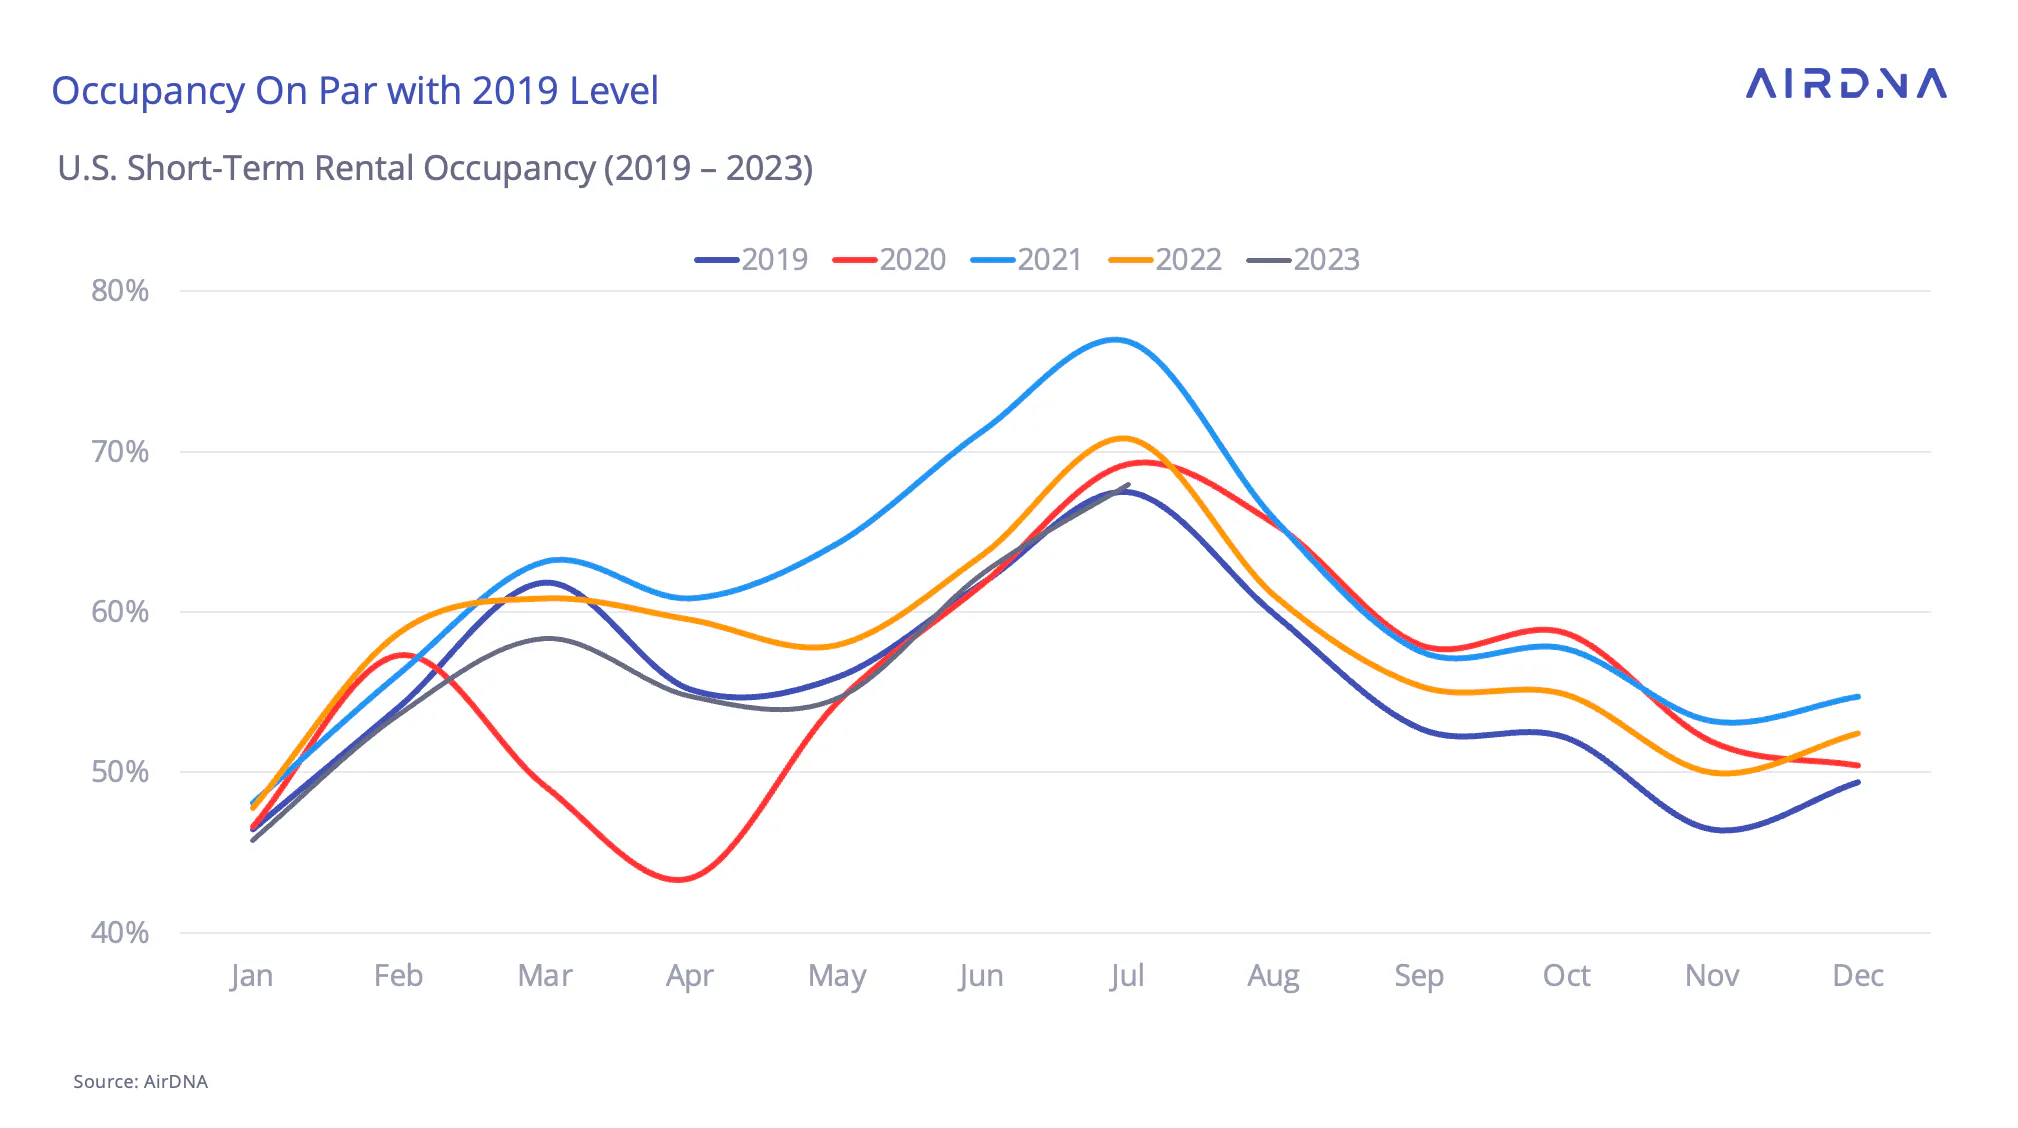
- Occupancy was 4.1% lower YOY at 67.9% (+0.6% vs. 2019)
- Average daily rates (ADRs) declined 2.0% YOY to $335.85
- Nights booked increased 7.9% YOY
Demand growth slowed in July after accelerating in June, and July’s booking growth was less than half of what it was in June. We don’t necessarily think this is the start of a downward trend for a few reasons. July historically marks the highest demand and supply month of the year, so the comparison is naturally tougher. Increasing interest in off-season tourism might also explain anomalously low demand growth during this peak month, while pacing remains strong for the fall.

- Demand nights are the nights stayed during that month
- Nights booked are reservations made during that month for any future date
Looking at the total nights stayed may help provide context. Since March, each month of 2023 has seen approximately one million more demand nights than the same month in 2022. July was not much different, with 1.4 million more nights in 2023 than in 2022; however, this difference is a smaller proportion of the busiest month than the surrounding months. Moreover, when looking at future bookings, there was no sharp drop-off in the number of bookings made in July. However in 2022, new booking patterns saw a huge boost in July and August 2022, making this year’s comparison difficult.

Supply Slows its Growth, Relieving Occupancy
Welcome news for operators is that the pace of supply — measured in monthly available listings — has been slowing markedly as well, at 12.1% YOY in July. This was slower than June’s growth of available listings of 13.7% and a far cry from July 2022, when supply in terms of available nights grew at a pace of 24.4% YOY. The change in available listings from February, the seasonal low, to July was more than 26% lower this year than in 2022.
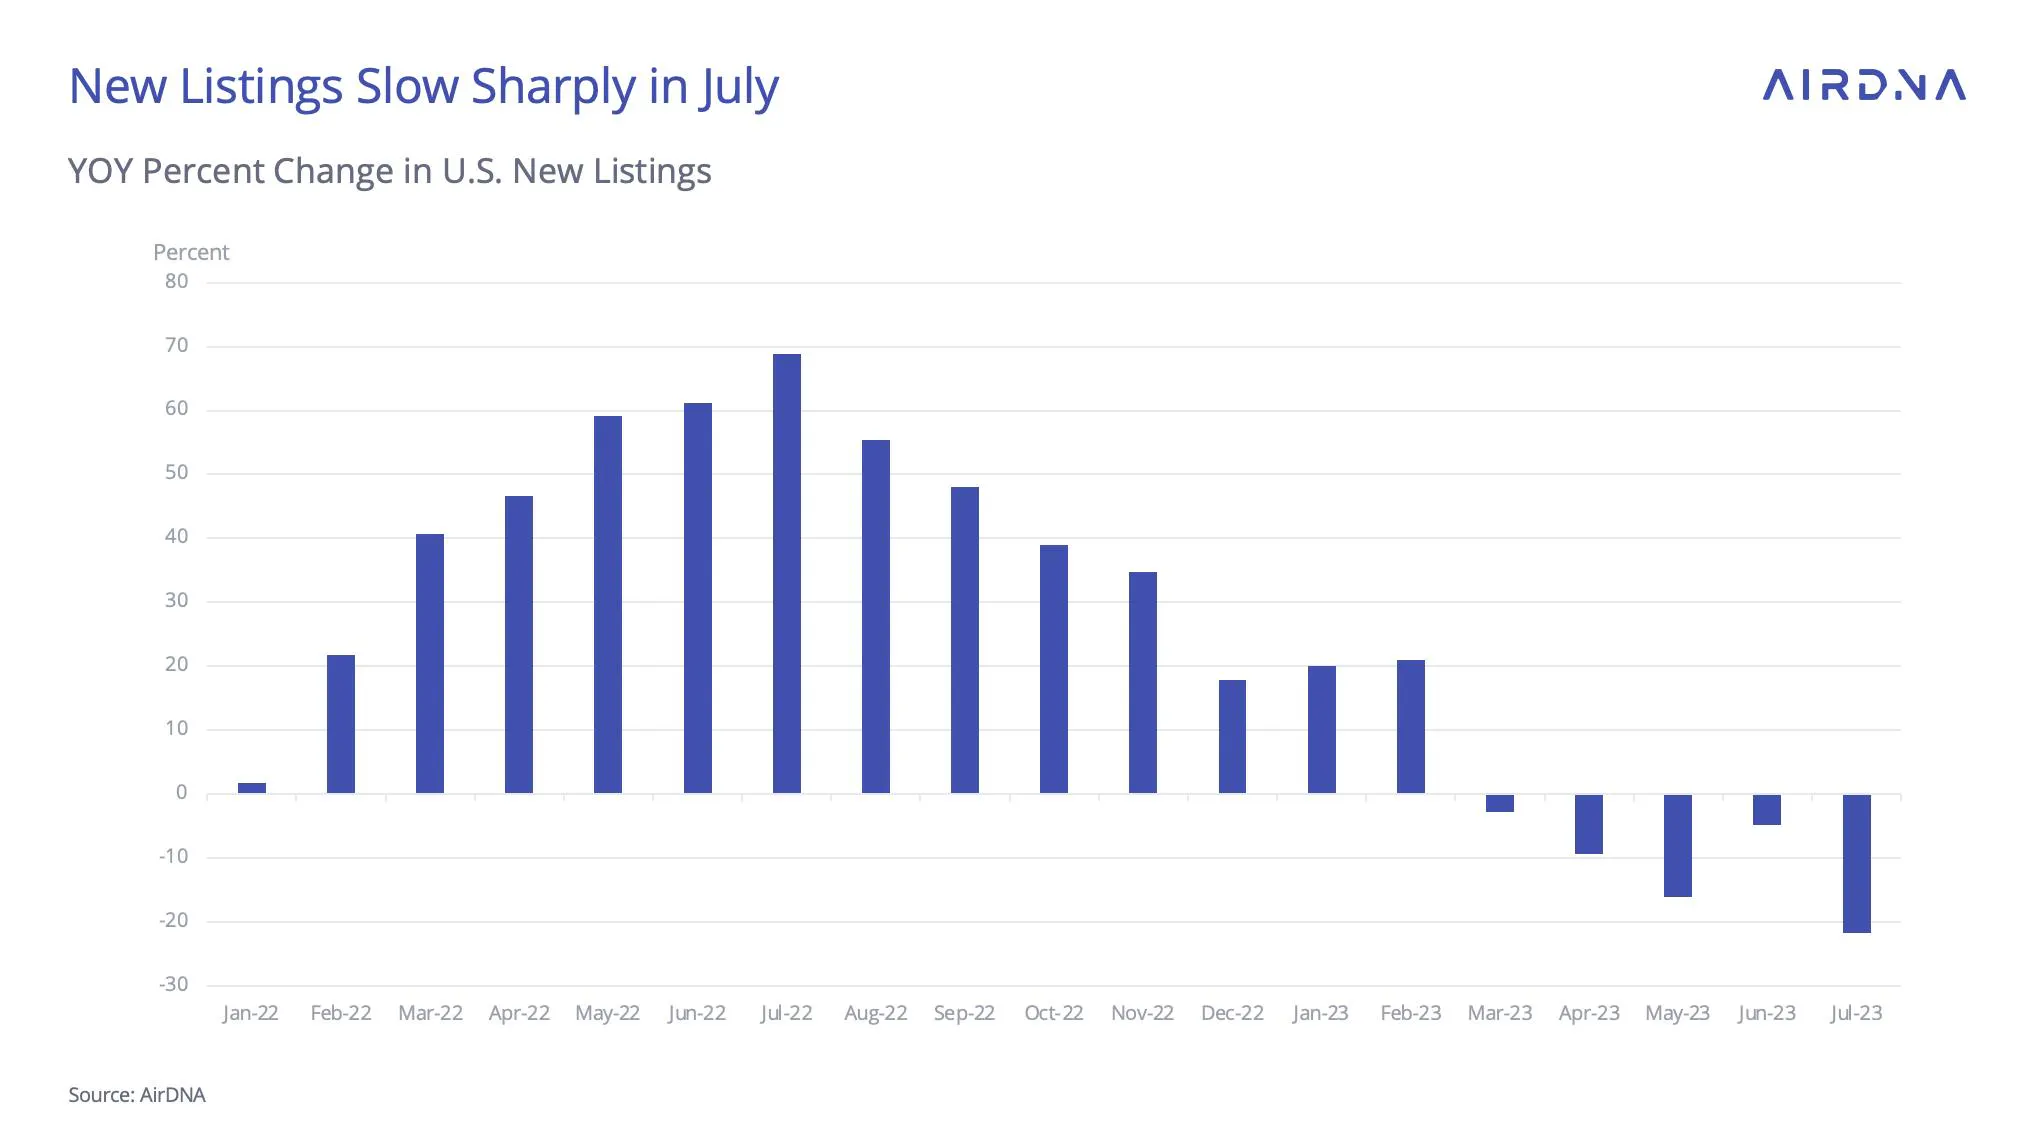
Factors such as the supply of housing, high interest rates that translate into high mortgage payments, and occupancy lower than the highs of 2021 are also impacting new supply, with July marking the fifth month in a row of new listings declining on a YOY basis. The drop in July was especially pronounced, nearly 22% below July 2022.
The slower pace of supply night increases led to occupancy just 1.8% lower than in July 2022 and is a welcome sign of the U.S. STR market finding balance after considerable supply increases.
From the beginning of 2023, occupancy has remained below 2022 levels. However, it hit 2019 levels in both June and July.
Inflation-Weary Consumers Mean Rates Drop a Little
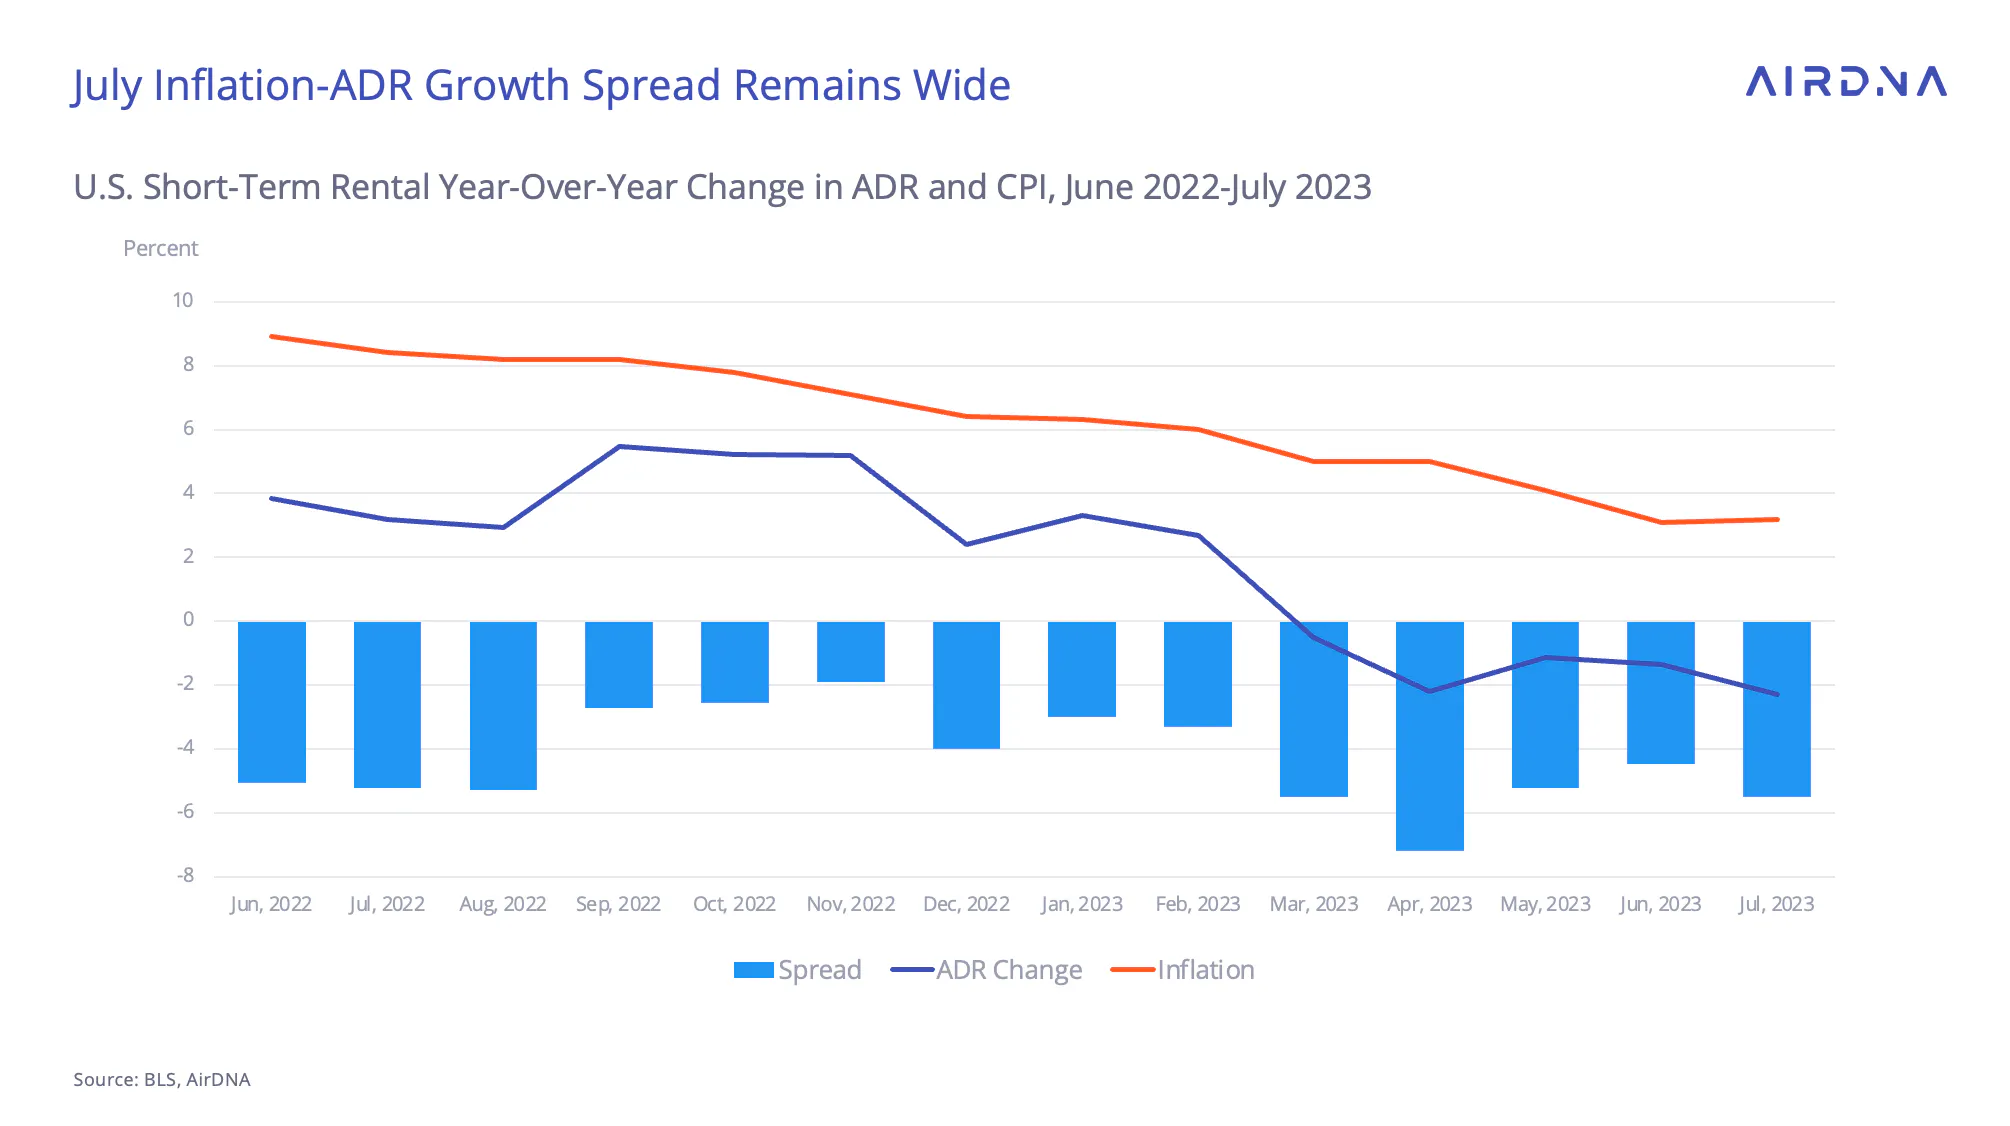
Inflation is still an important consideration, as July’s ADR slipped slightly from last year, falling about two percentage points in July. While this may appear to be a sharp departure from the 5% and higher ADR increases seen late last year, the Bureau of Labor Statistics’ consumer price index has declined dramatically, meaning that in inflation-adjusted terms, the slight decline in ADR was actually better in real terms in July than in January. Still, the spread between ADR growth and inflation remains wide. Inflation inertia has cooled considerably, but long lag times in the effect of shelter prices and uncertainty in energy prices mean that inflation could stay around 3% for several months.
Turning to location types, the slowing pace of demand growth hit all location types, with the most dramatic slowdown observed in destination/resort-coastal areas. This left small and mid-size cities as the number one and two fastest-growing location types, respectively.

Small city/rural locations were also the only locations to secure positive growth in ADR in July. Resort locations and large cities have found new competition this year as international travel has resumed. While the dollar has weakened since its peak in October 2022, the exchange rate is still relatively high. This has put pressure on many hosts to lower prices. In addition, lower inflation means that, broadly speaking, prices are increasing more slowly.

Phoenix Beats the Heat
If this summer’s blistering heatwave discouraged some from traveling to hot climates, the Phoenix/Scottsdale area must have missed the trend. Demand for STR rentals increased the most in this market, +34.6% YOY, while Phoenix set the all-time record for the hottest month in a U.S. city in July. The Coachella Valley market also posted a large gain in demand of 29.8% YOY while averaging a daily high temperature in excess of 113 degrees Fahrenheit.
It should be noted that July in these hot-weather markets is the off-season, and while posting impressive gains, Phoenix only hosted about 60% of its March total in July. Coachella in July only hosted about 87% of its April total when the eponymous music festival was held.
On the other hand, several Florida markets that regularly host summer vacations for families, and thus expect their highest demand near July saw smaller increases or even losses in the case of Orlando (-12.2% YOY).

Meanwhile, only 17 of the top 50 markets attained ADR growth. The top ADR growth markets were classic Northeastern summer getaways Long Island (+8.0%) and Cape Cod (+7.5%), as well as the big U.S. coastal gateway cities Los Angeles (+6.7%) and New York (+6.1%). Demand growth did not have a consistent relationship with pricing power, as although Los Angeles and Long Island saw relatively strong demand growth, Cape Cod and New York did not.

Strong End to the Summer
Looking at forward pacing data, August appears to be seeing a somewhat slower pace than current demand trends would indicate. Lead times have shortened since last year, so while August pacing is currently only 4% ahead of this time last year, last-minute bookings should still push the final realized demand for August higher.
A larger unknown is the extended high season. Hot temperatures and budget-conscious travelers have heightened interest in bookings past August, and bookings already made for the months of September through November are more than 10% ahead of where they were at the same point in 2022. What remains to be seen is if shorter lead times will translate into higher demand than pacing suggests for these months, or if off-season travelers book further in advance than their peak-season counterparts.

Speaking of peak season, Labor Day usually marks the unofficial end of the U.S. summer travel season with one last hurrah. Although the pacing generally more closely resembles the speed of August than September as a whole, looking at the week of Labor Day reveals that the biggest gain is on the Thursday before, signaling that more vacationers this year are opting for an extended weekend than in 2022. In fact, Monday and Tuesday have larger growth than Saturday and Sunday, meaning the trend is occurring on both sides of the holiday. Booking for the days less traveled appears to be a trend for the summer season as well as for holidays in 2023.
As part of our ongoing commitment to accuracy, we continuously implement data methodology improvements, leading to updates to some of the information in this report as of December 18, 2023. For further questions, please contact us.

ARTICLE SUMMARY
July 2023 broke the record for the most short-term rental (STR) stays in one month, with 24.1 million nights stayed in the U.S., despite a searing heatwave and increased interest in off-season booking which should keep demand high for the coming months.
Scott Sage
Senior Vice President, Marketing & Customer Experience
Scott is an Airbnb Superhost and industry pro, having founded Home Base BnBs—a short term rental management company that scaled to 200+ units. Scott combines his experience and passion for hosting to empower AirDNA customers' success. When he's not thinking about STRs, he is hiking, playing basketball, or playing pickleball.

