

 Calculate Revenue
 Research Markets
 Find For Sale Properties
 Compare My Listing
 STR Revenue Calculator
 Custom Comp Sets
 Submarket Insights
 Custom Search Filters
 Rate Recommendations
 Performance Benchmarking
 Competitor Comparison
 Owner Contact Details
 Property-level performance data
 Tourism Insights
 Real Estate Investment Analytics
 About Us
 Sales
Sales Support
 Press
PressU.S. Market Review: Holiday Bookings Give the Short-Term Rental Industry Reason to Give Thanks
Published: November 23, 2022
Last updated: May 5, 2026

Scott Sage
U.S. short-term rentals (STRs) maintained strength in October as revenue per available listing (RevPAR) grew by 3.2% year over year, with average daily rate (ADR) growth outpacing falling occupancies.
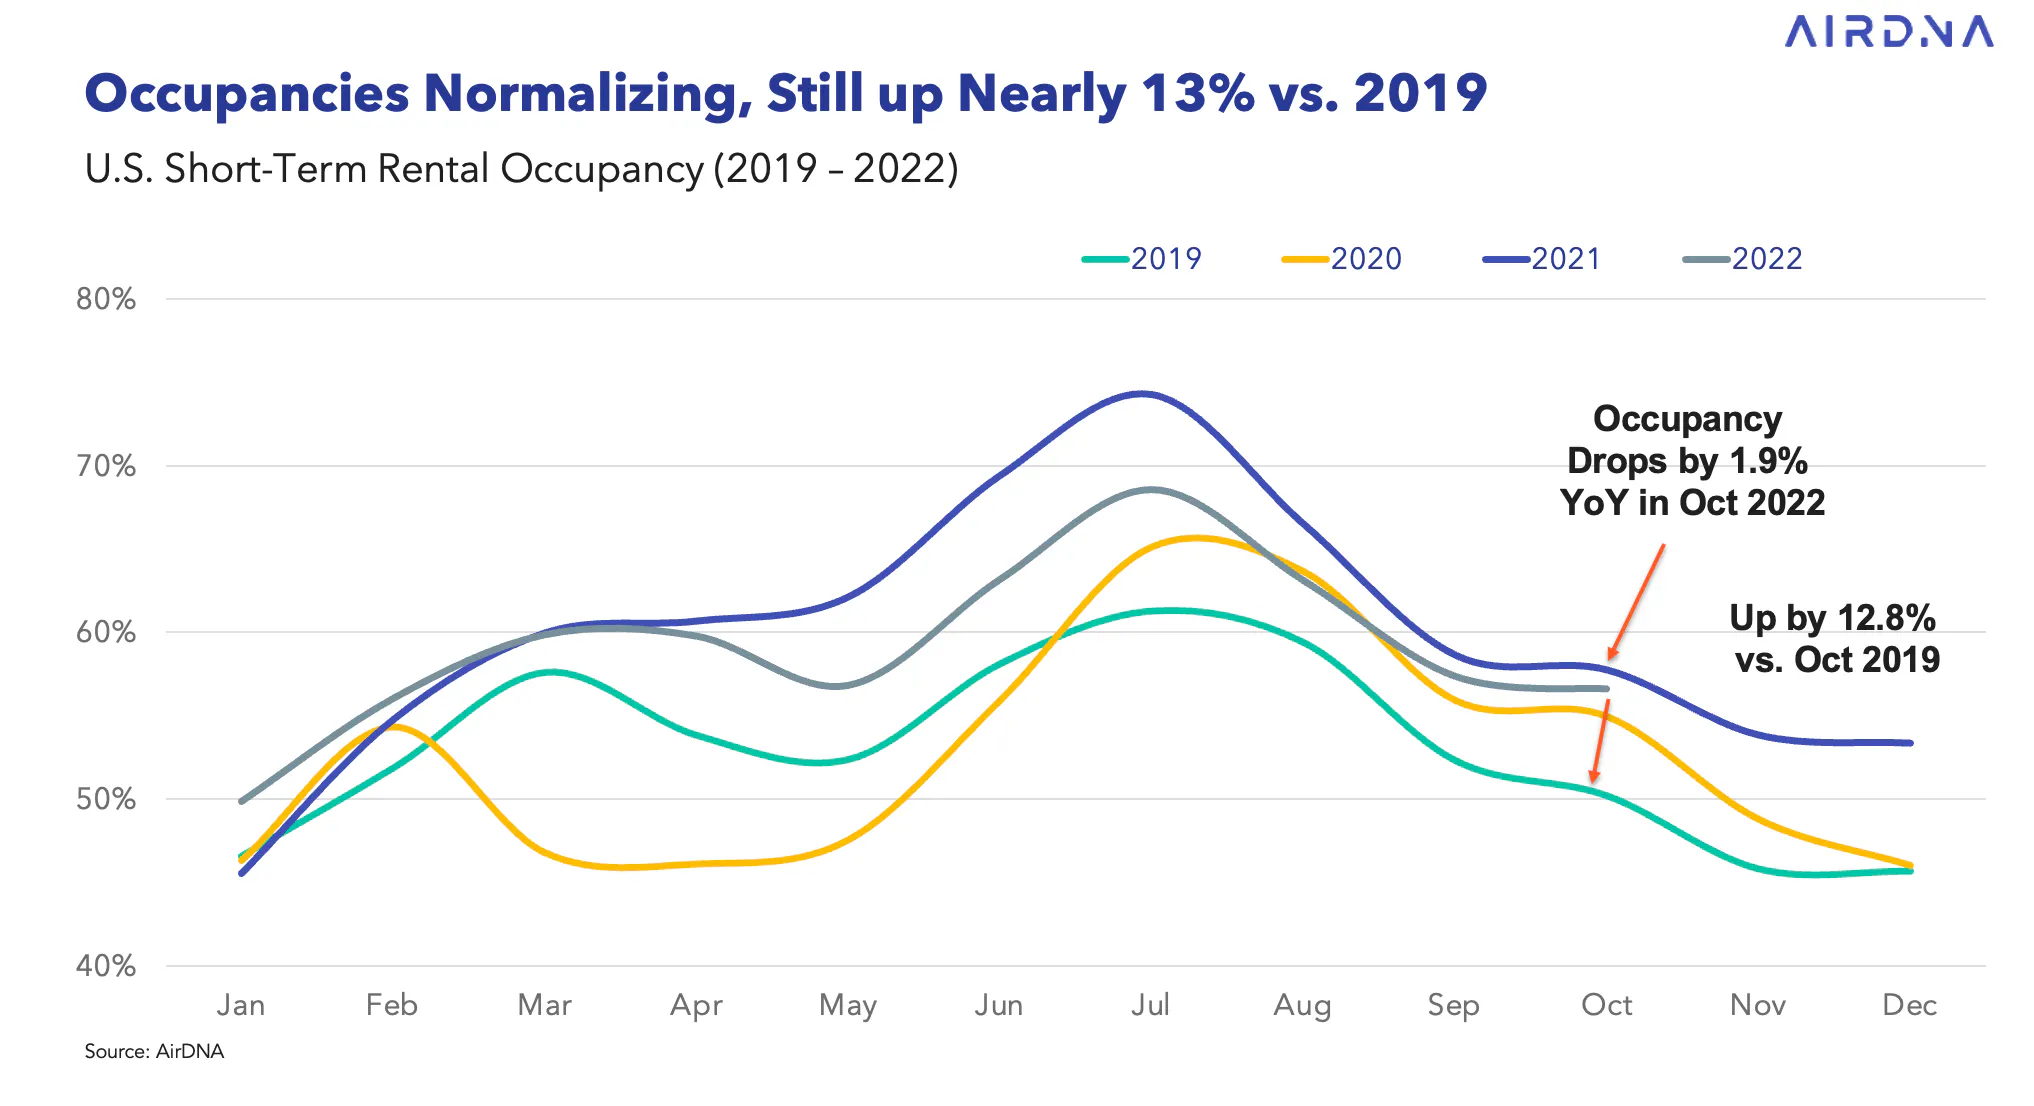
Average U.S. occupancy hit 56.6% for the month, down 1.9% year over year and extending a streak of eight consecutive months of year-over-year declines. As was the case in September, the reduction in occupancy was significantly less than the 5 to 10% declines observed over the summer when 2021 occupancy reached its highest levels relative to prior years.
Demand for short-term rentals remained strong, with over 18 million nights stayed, a 21.3% increase compared to the same period last year. Likewise, nights booked for future travel were up 15.8% when compared to October 2021. The strong October results are another positive indicator that consumers are still willing and able to travel, and we have found no evidence yet of a sector-wide slowdown.
Unfortunately for existing hosts, the supply of available listings continues to grow, with a 23.3% increase over last year. Even with elevated interest rates and falling home values discouraging both buyers and sellers out of the housing market, 66,000 new short-term rental listings were added in October. This increase was 41% higher than the growth seen last October. The elevated additions may still be a reflection of the long lag between when offers are made on a home, the purchase is closed, and the property is ultimately launched as a short-term rental.
A softening housing market may keep owners from selling, as they are reluctant to sell while prices are falling, choosing instead to rent their home out as either a short-term or long-term rental. The near-term effect of lower home prices is to increase short-term rental supply.
At a Glance: Key U.S. Short-Term Rental Performance Metrics for October 2022:
- RevPAR rose by 3.2% year over year (YOY), +48.1% vs. 2019
- Available listings reached 1.37 million – up 23.3% YOY and +10.7% vs. 2019
- Total demand rose 21.3% YOY and sits 30.8% higher vs. 2019
- Occupancy declined 1.9% YOY to 56.7% but is up +12.8% vs. 2019
- Average daily rates rose 5.2% YOY to $254 and are up 31.3% vs. 2019
Take the Week—Thanksgiving & Christmas Holiday Travel
In 2021, the Thanksgiving holidays marked a turning point for many families getting back together after a year and a half of canceled plans. In retrospect, the holiday was a lull between the Delta and Omicron variants, which otherwise wreaked havoc on last year's travel plans. While 2021 was a record year for Thanksgiving travel, 2022 is on pace to exceed it, with over 14% more nights booked over the holiday travel period. ADRs are pacing 4.8% higher than last year.
This year, guests are also extending the trend that started last year of traveling for the full week instead of just the long weekend. Demand for the three days prior to Thanksgiving (Sunday through Tuesday) is pacing 41% higher than in 2019, compared to an increase of just 28% during the typical travel period of Wednesday to Saturday. This trend is most pronounced in mountain/lake markets, where 20% more guests are staying for the full week compared to 2019.
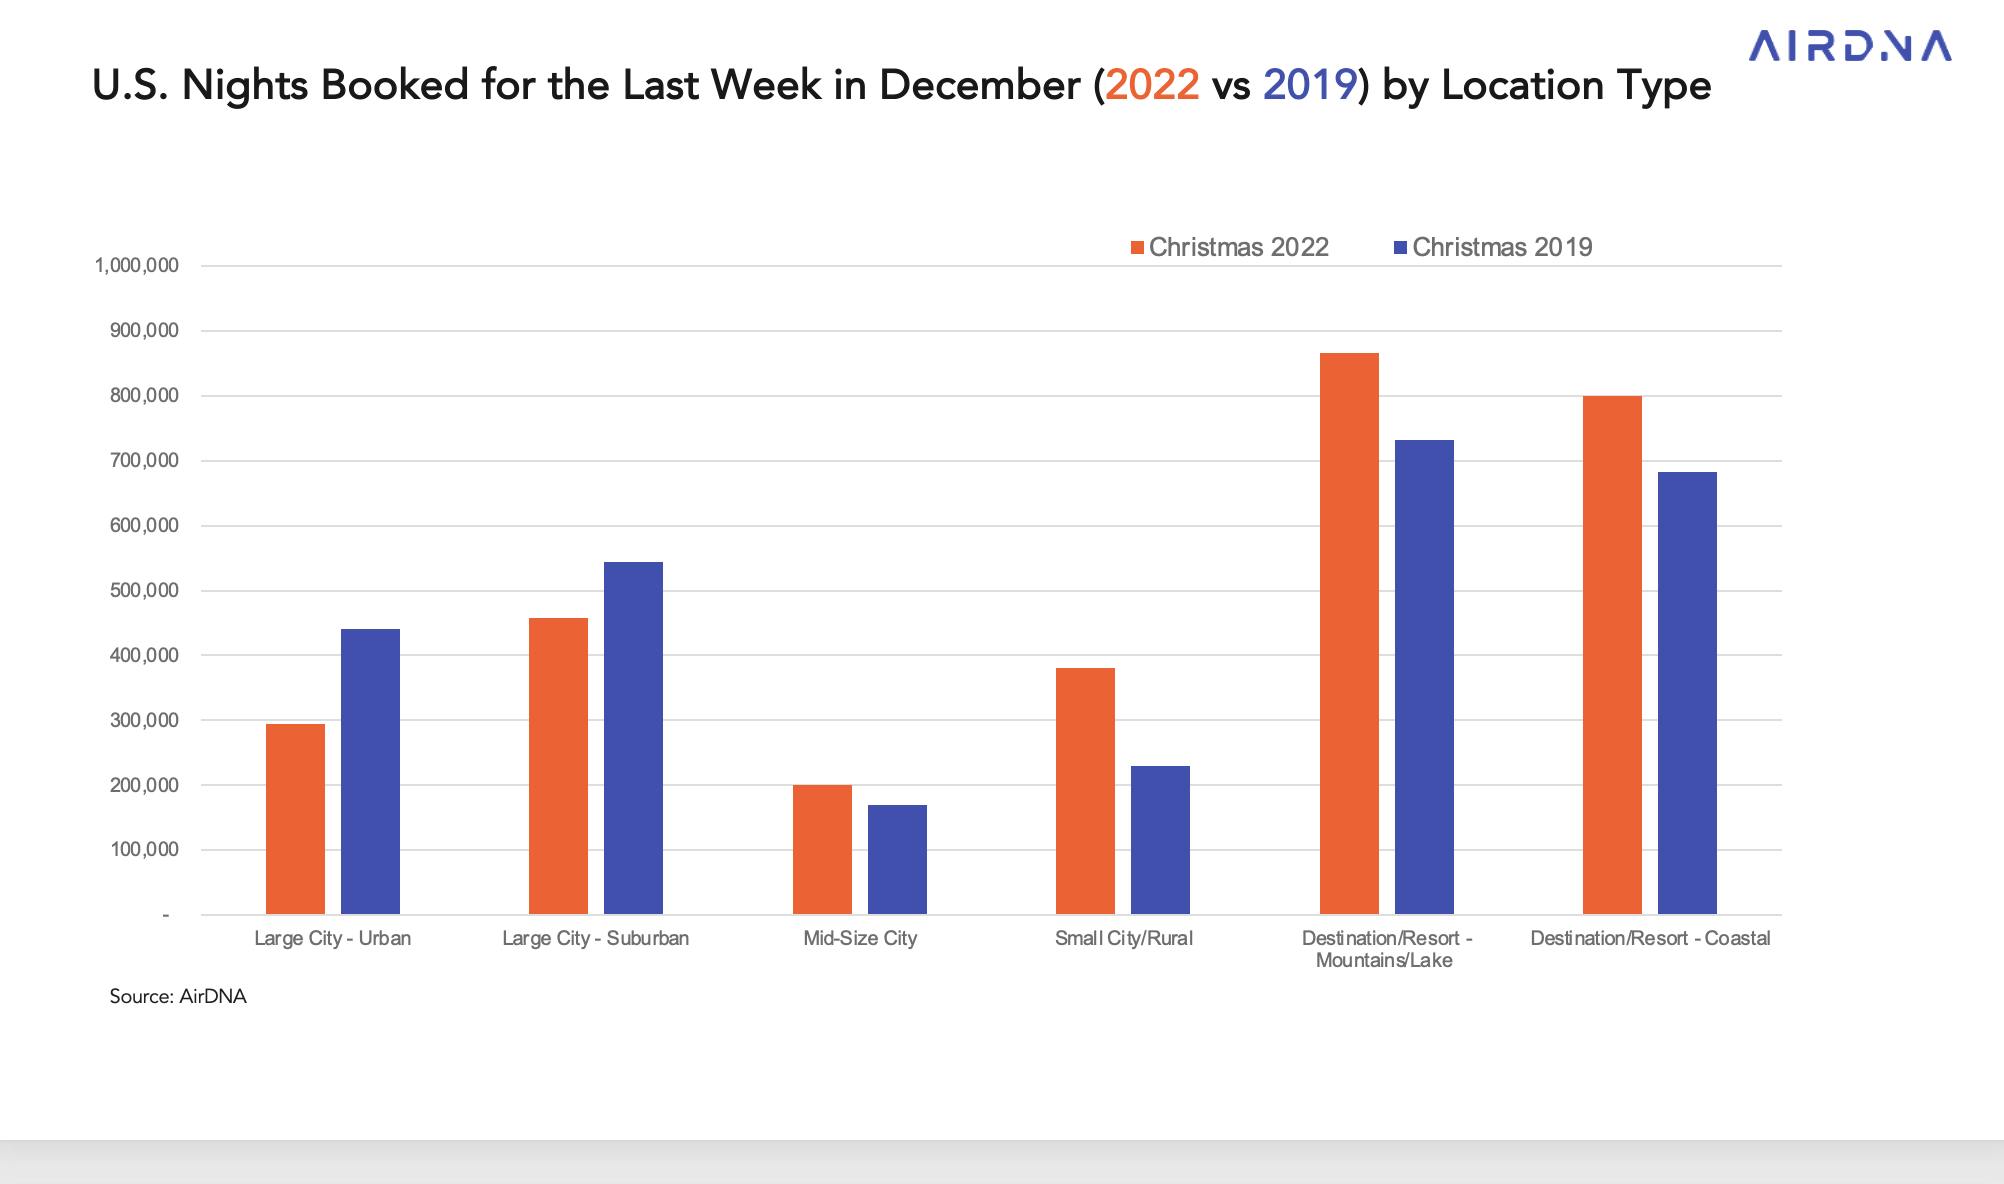
Looking at the week of Christmas and New Year’s Eve, ADRs are trending 8% higher than last year, while demand is pacing a full 14% higher. Surprisingly, this is only 7% higher than in 2019. This Christmas/New Year’s comparison is considerably lower than that of the Thanksgiving holiday, which is on pace to attract 28% more demand than in 2019. Additionally, for the week of Christmas, bookings are 24% lower in the 50 largest U.S. cities compared to up 24% in the rest of the country.
Not surprisingly, holiday travel will highly influence booking trends through the end of 2022, with demand up 14% for the last two months of the year, compared with November and December 2021. As we look towards 2023, year-over-year demand growth slows, with the first quarter of 2023 pacing 12% higher than Q1 2022 and the second quarter of 2023 pacing just 3% higher than Q2 2022. ADR growth continues to accelerate and is currently pacing in the mid to high single digits throughout the rest of 2022 and into 2023.
Strong Shoulder Season in Coastal and Mountain Markets Helps Maintain Occupancy
Throughout this past summer, coastal and mountain markets saw double-digit declines in occupancy as many areas absorbed new supply and felt some pushback from record increases in ADRs through 2021 and early 2022. The declining occupancy appears to have muted ADR growth in many of these markets during the second half of the year. For example, in mountain/lake markets, guests went from paying more than 10% higher ADRs on average in the first quarter of 2022 to no increase in the third quarter of 2022 compared to the prior year. While listing growth has maintained a 20% year-over-year increase throughout the year, a pause in the ADR increases has allowed hosts to maintain occupancy levels over 20% higher than in 2019, albeit slightly lower than 2021 levels.
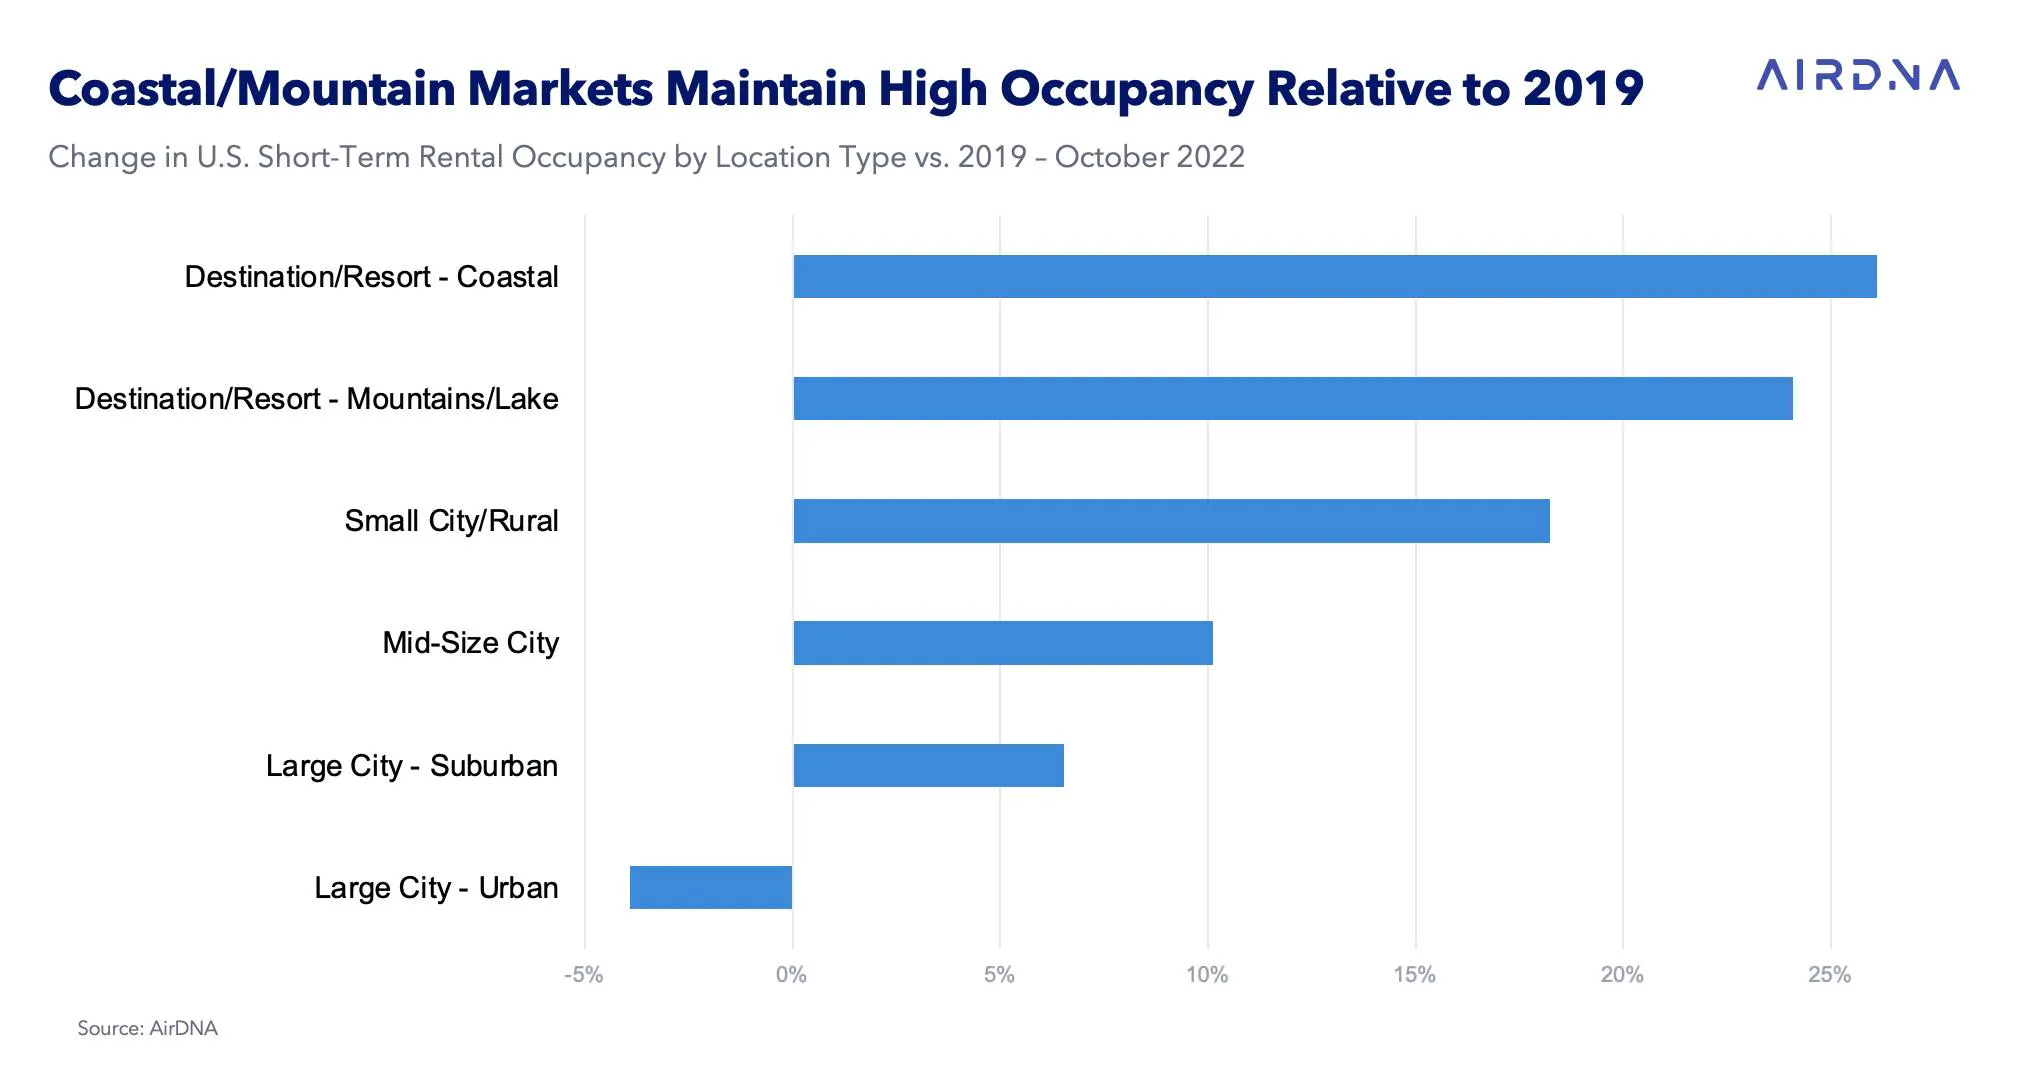
Meanwhile, in 2021, urban areas had essentially recovered occupancy to 2019 levels with a combination of rising demand and limited available listings. Rebounding supply has outpaced demand in recent months, pushing occupancy levels back under 2019 levels. In October, listings rose by over 20% compared to the same period last year, pushing occupancy down by 2.1% for the month.
Breaking out the data for the U.S. by AirDNA price tier, a similar trend emerges with luxury listings, or those with the highest 20% of ADRs in a market, maintaining occupancies almost 25% higher than in 2019. Occupancy levels in budget listings are just 8% higher. Most of the change can be attributed to luxury properties maintaining an occupancy closer to that of budget properties, which still maintained an overall higher occupancy in October of 58.7% compared to 54.5% in the luxury listings.
ADR Growth Helps Maintain Positive Revenue Gains in October
Given the choice, hosts would typically choose growing revenue by increasing ADR than occupancy because of lower variable expenses and less wear-and-tear on the property, and that is exactly what is happening. While occupancies fell, ADRs rose 5.2% in October, which was the highest year-over-year growth rate since April.
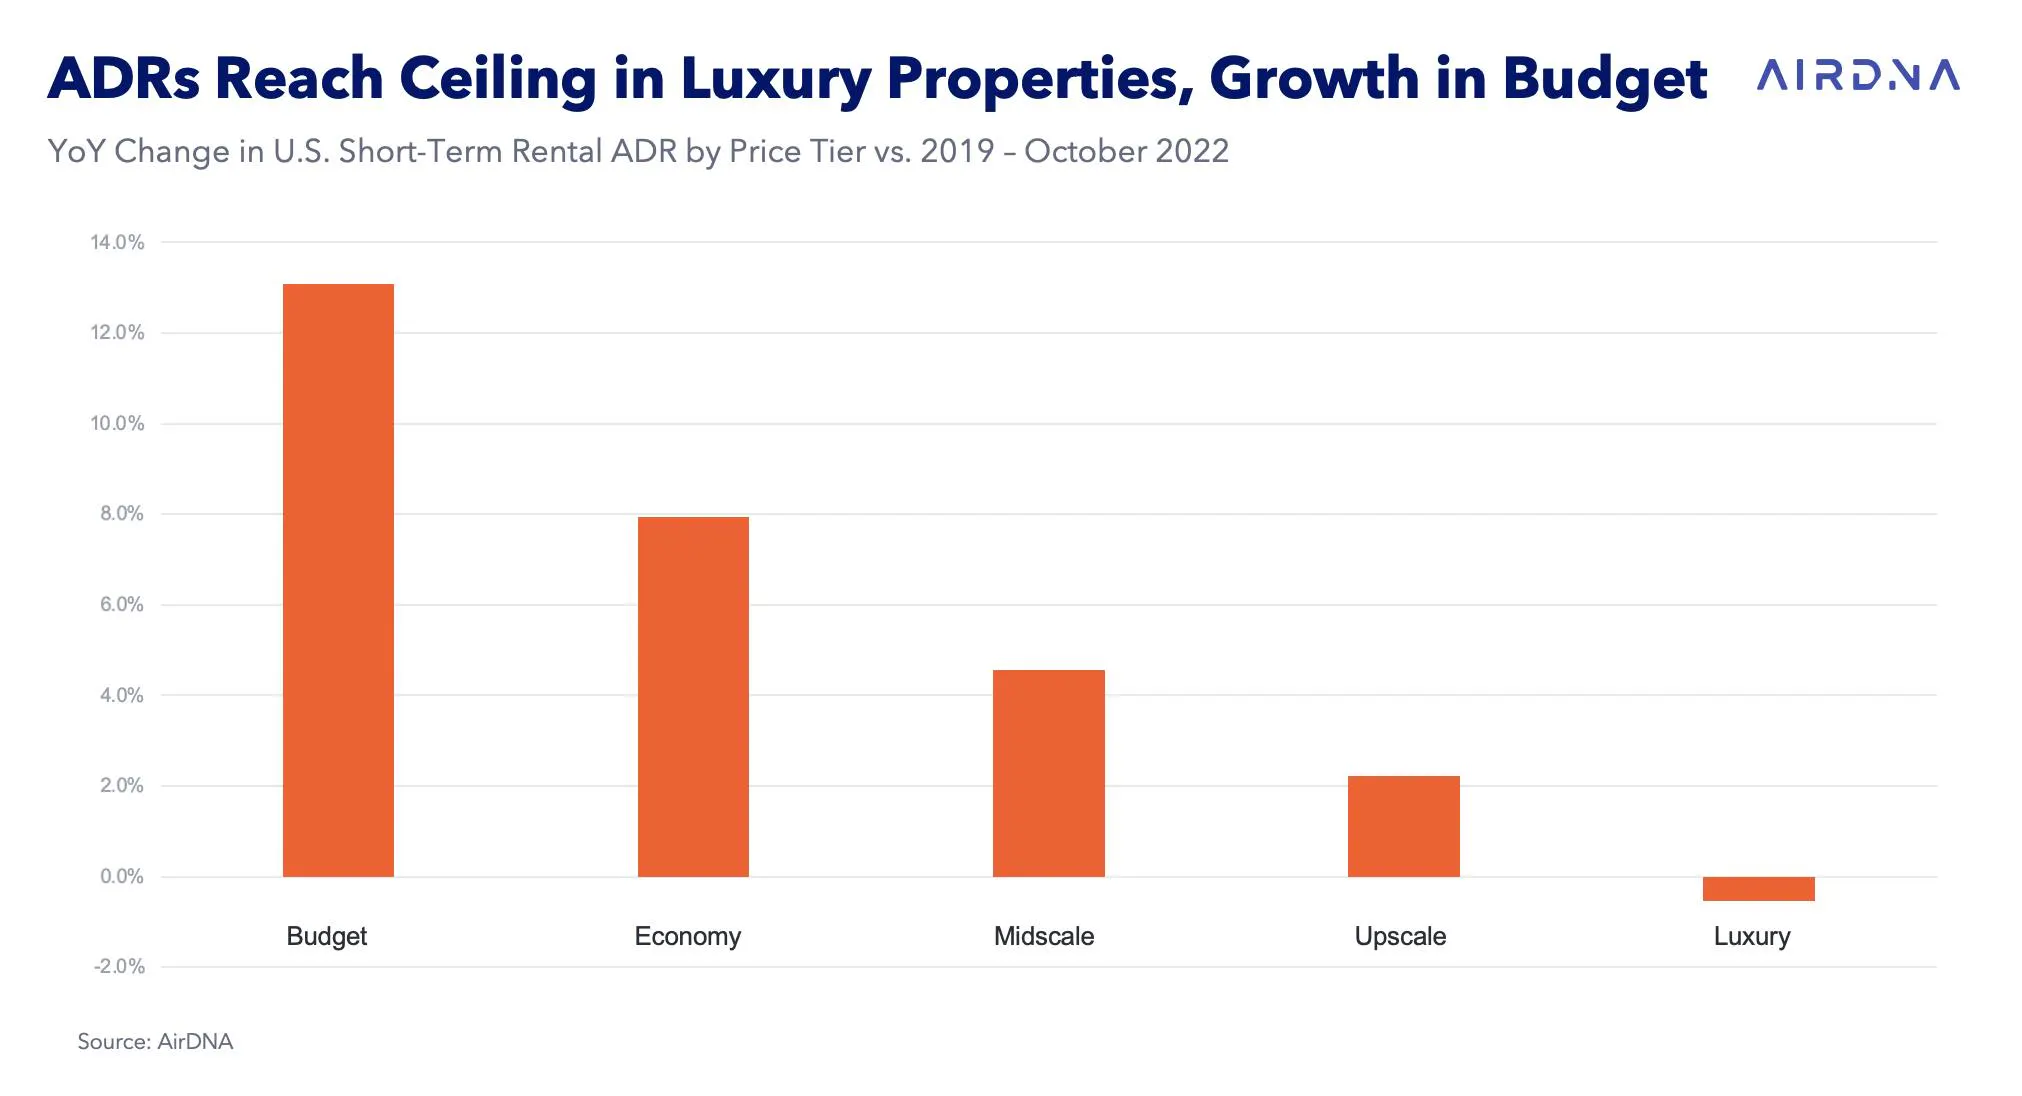
Prices are rising throughout all parts of the service economy, with short-term rental listings being no different. The ability of STRs to re-set rates on a nightly basis and quickly respond to rising input costs or stronger or weaker demand has allowed many operators to push ADR higher. ADR growth was strongest in budget properties, where it increased by 13% year over year. Luxury ADRs were essentially flat when compared to 2021, as hosts sought to maintain their higher occupancy levels by forgoing higher ADR growth.
Are you leaving money on the table?
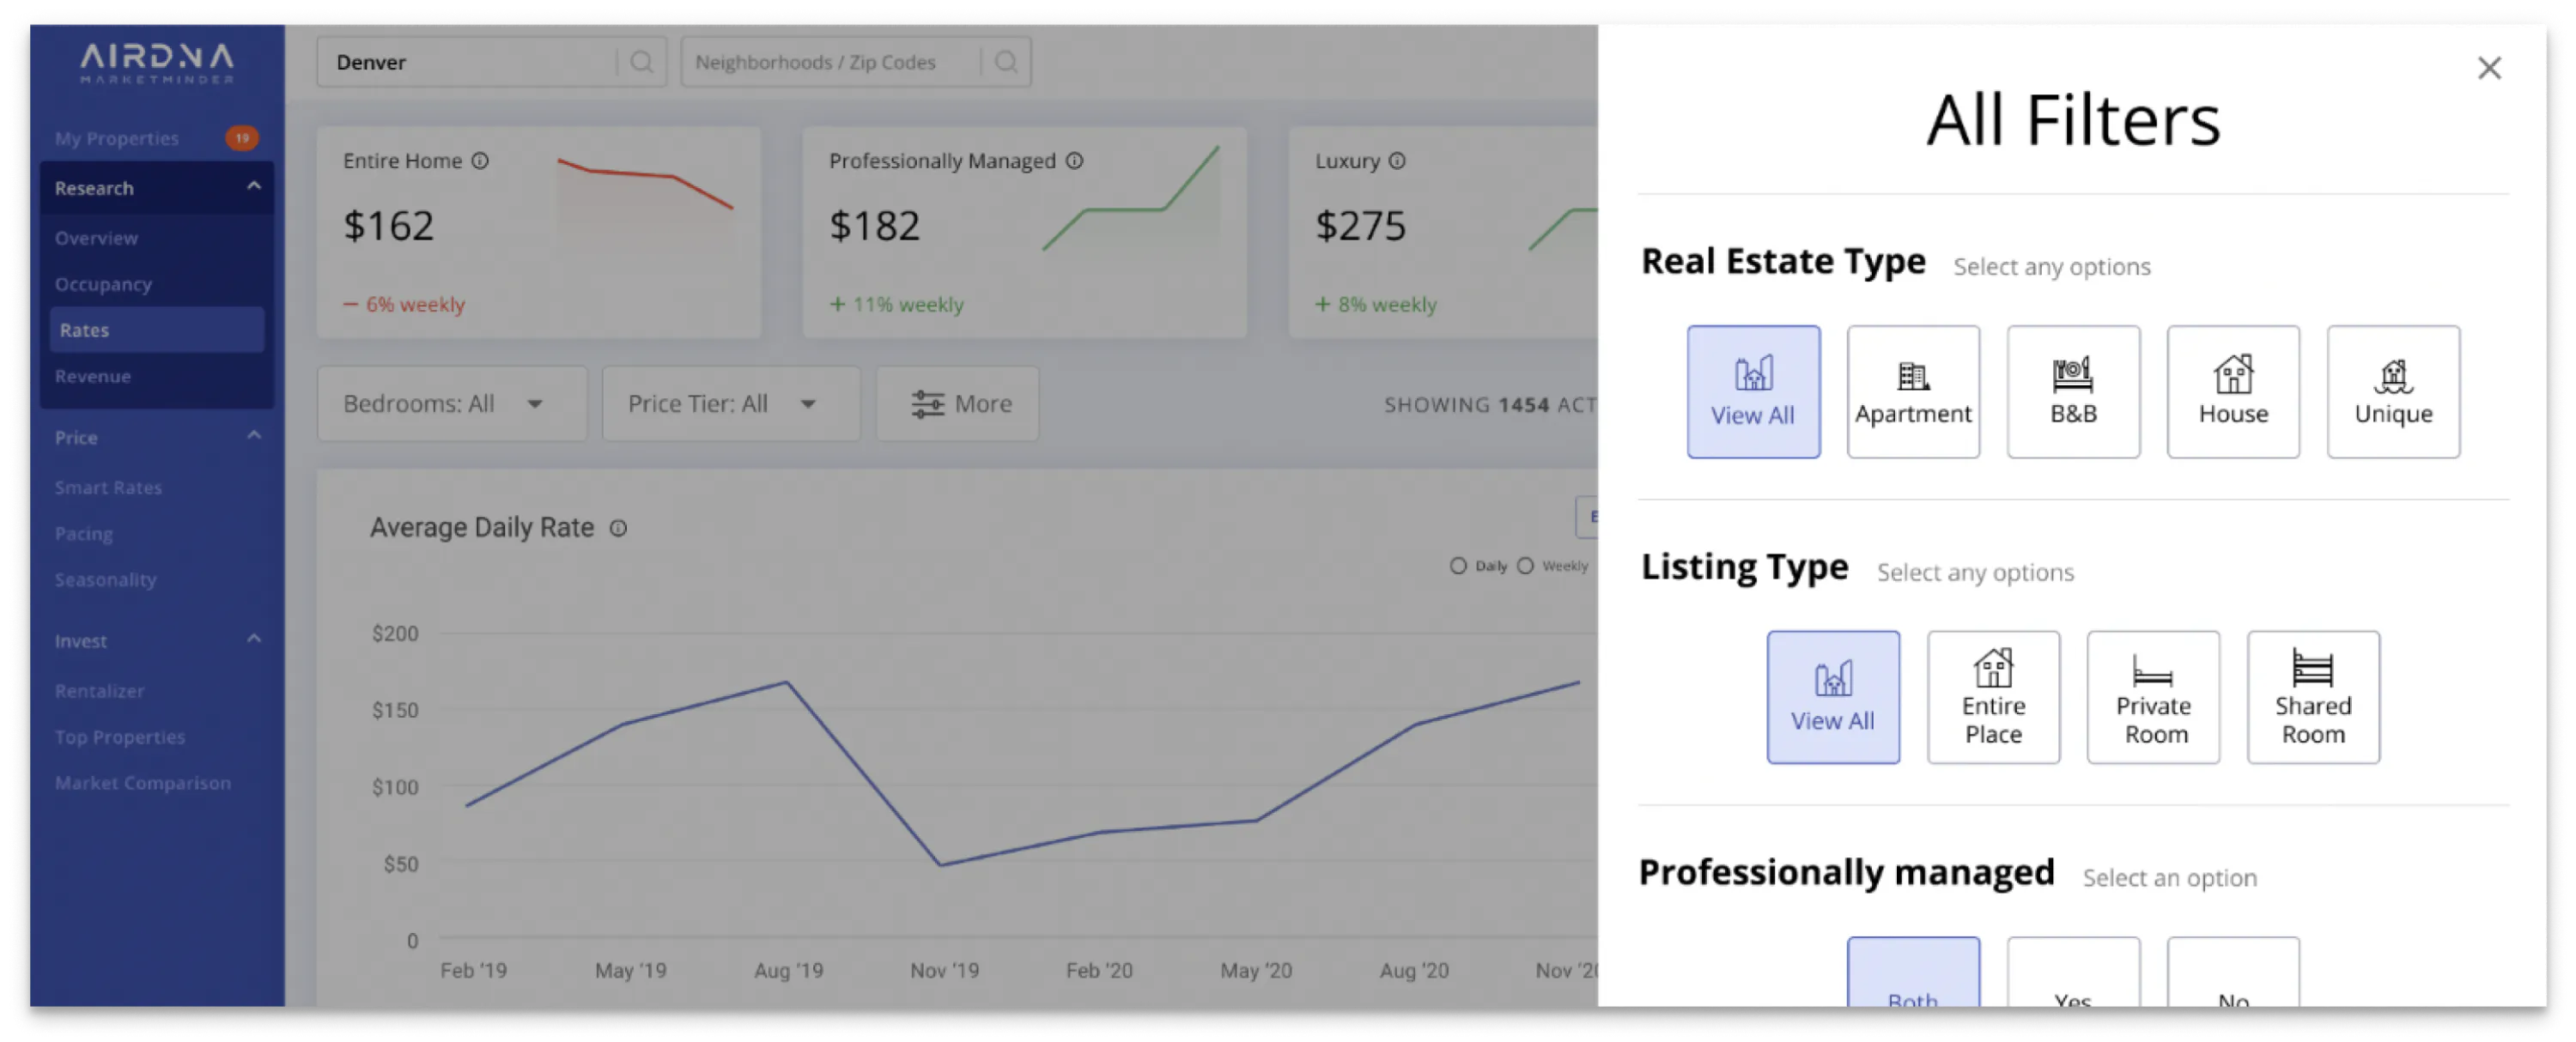
Find that pricing sweet spot. See what you should be charging to optimize your vacation rental pricing strategy with AirDNA
Increases in cleaning fees outpaced that of ADR growth in October, averaging $145, which was 7.9% higher than the same period last year. On the other hand, since 2019, cleaning fees have increased by just 27%, less than the 48% rise in ADR over the same period. Inflation will continue to weigh on costs, with both materials and labor contributing to the increasing costs to guests.
The rising costs of travel, from inputs including lodging, airfares, and entertainment, may push travelers to seek out accommodations that offer additional value. The economy is expected to weaken as we head into 2023, putting further emphasis on value. It will be important for hosts and operators to monitor booking trends and competitive pricing to actively revenue-manage their properties and make sure they are maximizing their opportunities to convert potential guests into reservations. So far, the economy remains strong, but with cracks beginning to show, especially in the tech and goods-producing industries, there is increasing uncertainty over a broad range of possible outcomes over the next 12-18 months, ranging from recession to more growth.
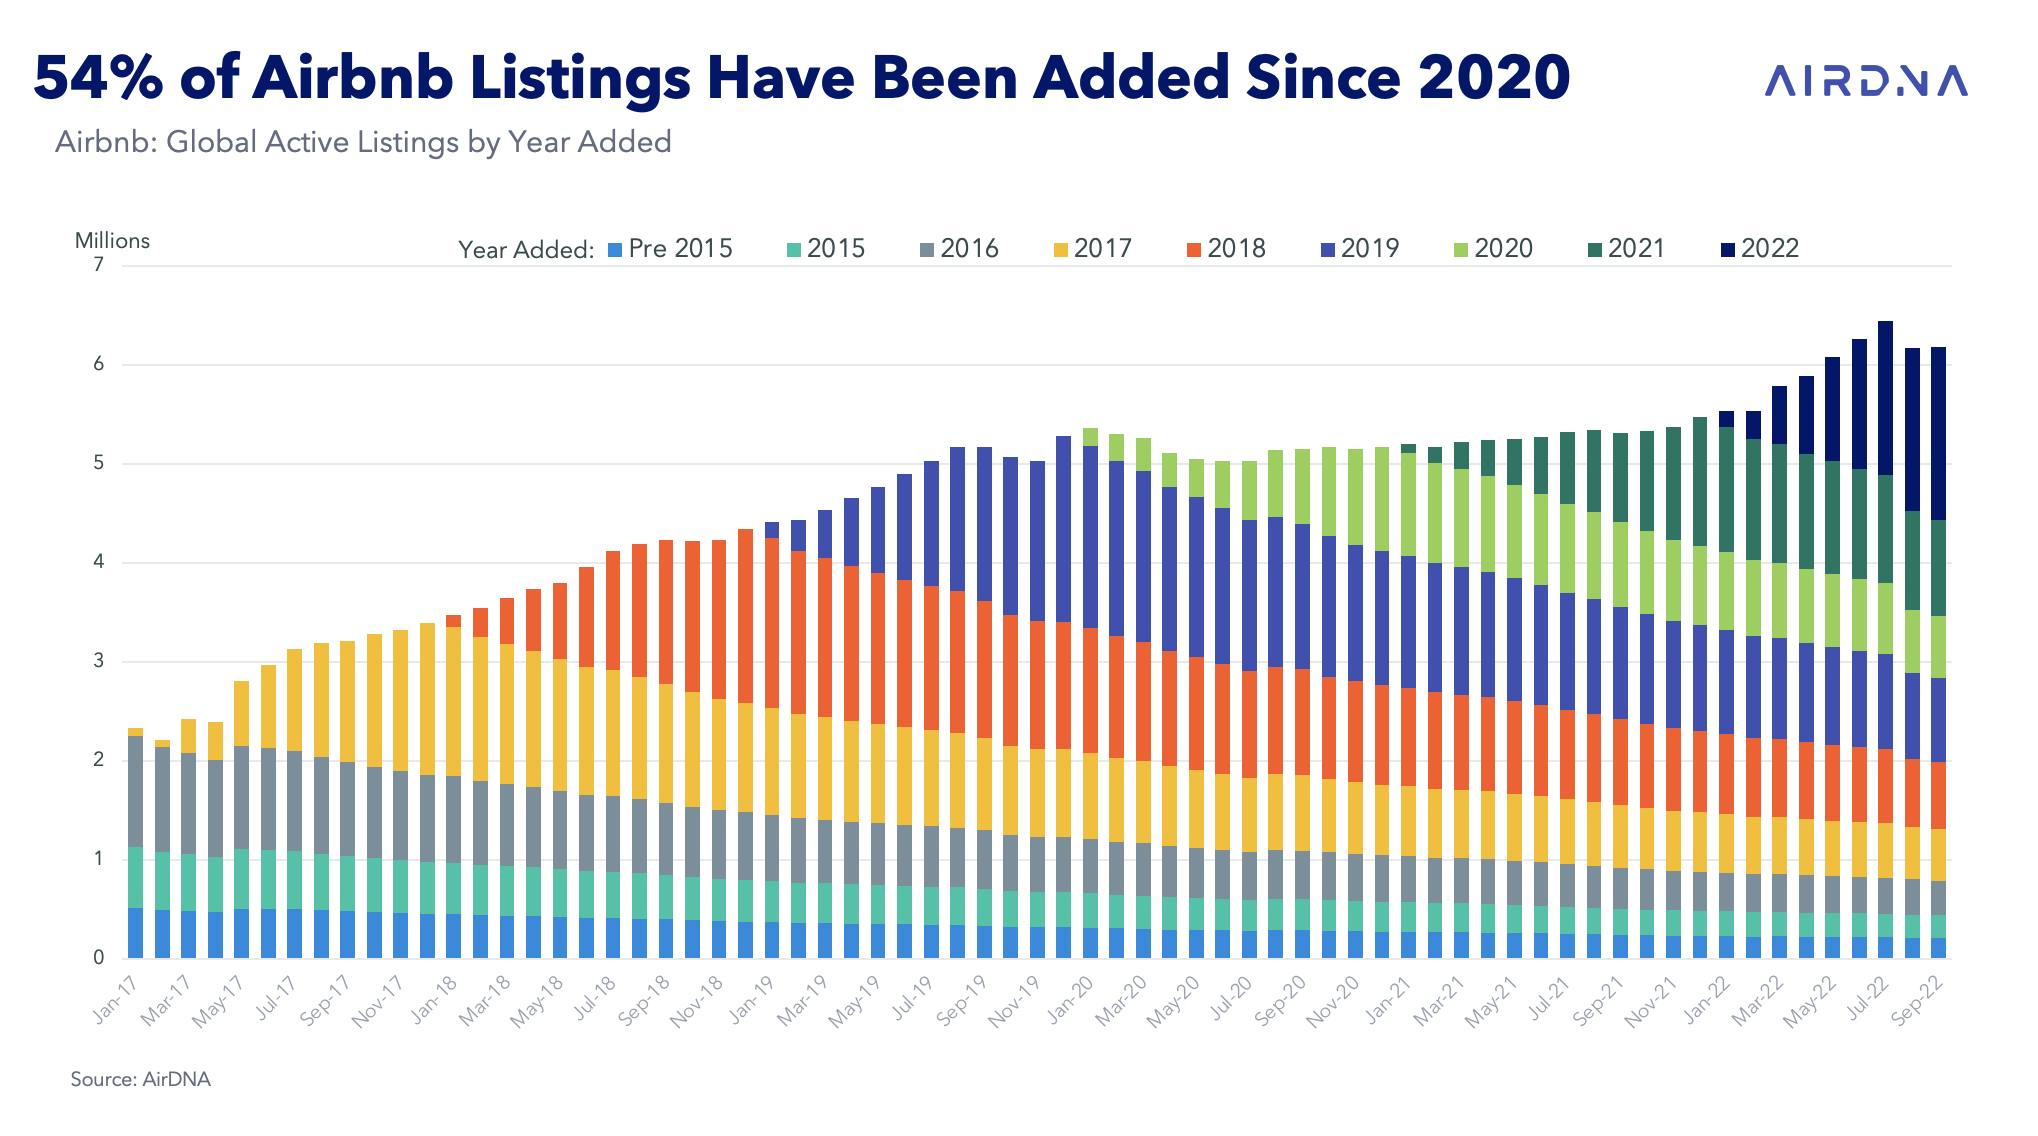
Airbnb Supply Reaches Record Heights
Learn which markets have grown, which markets have shrunk, and how supply changes can affect your short-term rental business in our new article.

Data before drama
Analyze easier. Invest wiser. Price smarter. Succeed faster. AirDNA makes professional market insights easy.

Beating the #Airbnbust
Close that social media app and follow our five top tips to bolster your rental business right now, whether you’re feeling the bust or not.
ARTICLE SUMMARY
With a strong Thanksgiving on the horizon, October occupancy was down just 1.9% from last year, with 18 million nights stayed—a 21.3% increase from last year. Meanwhile, supply grew 23.3% year over year, with 66,000 new short-term rentals added in October.
Scott Sage
Senior Vice President, Marketing & Customer Experience
Scott is an Airbnb Superhost and industry pro, having founded Home Base BnBs—a short term rental management company that scaled to 200+ units. Scott combines his experience and passion for hosting to empower AirDNA customers' success. When he's not thinking about STRs, he is hiking, playing basketball, or playing pickleball.
