


U.S. Market Review: STR Market Shrugs Off Summer Blues as September Performs Strongly | AirDNA
Published: October 18, 2023
Last updated: May 5, 2026

Scott Sage

After a sweltering heat wave moderated August performance, September U.S. short-term rental (STR) demand growth accelerated to 4.1% on a year-over-year (YOY) basis, up from 2.7% the month prior. This boost cemented the reign of off-season demand, making good on pacing signals throughout 2023 that pointed to strong travel during this year’s shoulder season.
The bump in performance followed economic data that continues to positively surprise despite persistent recession forecasts. The October jobs report released by the Bureau of Labor Statistics (BLS) shows 336,000 new jobs added to U.S. payrolls, a steep increase from the 227,000 added in August and well above the estimated 170,000 jobs economists expected. This was the strongest month for new jobs in seven months, and the leisure and hospitality industry enjoyed some of the biggest gains.
At the same time, wage growth slowed slightly. This signals that robust hiring numbers aren’t translating into wage inflation just yet, and the Fed might be able to hold off on rate increases for a bit longer. September inflation remained unchanged from August’s 3.7%, which sits above the Fed target of 2%. Core inflation, which strips out volatile food and energy prices, crept down to 4.1% from 4.3% in August. The economy may continue to cool moving into the holiday season as excess savings decrease and student loan payments resume in October and November.
At a Glance: Key U.S. STR Performance Metrics for September 2023
- RevPAR decreased 8.1% YOY to $154.22
- Available listings reached 1.65 million, up 17.8% YOY
- Total demand (nights) rose 4.1% YOY
- Occupancy was 5.5% lower YOY at 52.3% (-0.8% vs. 2019)
- Average daily rates (ADRs) fell 2.7% YOY to $294.85
- Nights booked increased 6.1% YOY
Perhaps the most welcome shift in September performance is the return of occupancy levels closer to 2019 levels after dipping significantly below them in August. Lower occupancy year-over-year was a foregone conclusion in 2023, as the STR market rebalanced following the extreme highs that characterized the recovery from the immediate aftermath of the COVID-19 outbreak.
Still, occupancy was above 2019 levels beginning in May. In August, that trend shifted again, as occupancy dipped below 2019 levels as it had been tracking at the beginning of the year. Fortunately, this doesn’t seem to be the start of a new pattern. In September, occupancy once again tracked closely with 2019.
People are still excited about getting into the STR business in the U.S., as evidenced by the increase in available listings for September. Not only were listings up 17.8% YOY (up from 13.7% in August), but they also increased by nearly 56,000 from August to September. Generally, listings stay constant or drop in September as the summer travel season winds down—the STR market hasn’t seen a September gain even close to this size since 2018. It may be that operators anticipated increased off-season interest, keeping properties available for longer.

Even with the increase in listings, occupancy regained its footing because demand accelerated. This increase spread across all location types, except those in coastal locations. Although small city/rural locations and mid-size cities had the fastest growth rates at about 10.5% and 18.3%, respectively, large city locations saw dramatic increases that more than doubled their August pace.
Average Rates and Mix Shift Growth
Even with stronger demand growth, ADRs weakened across the board in September. After a relatively flat summer for rates, U.S. ADRs fell 2.7% YOY in September, the biggest decline since the start of the pandemic . ADRs weakened across most locations; the ADRs for small city/rural locations saw the largest increase of 1.4%, while only mid-size city locations saw improvement from August’s growth, only down 0.1% compared to the 0.5% decline last month.
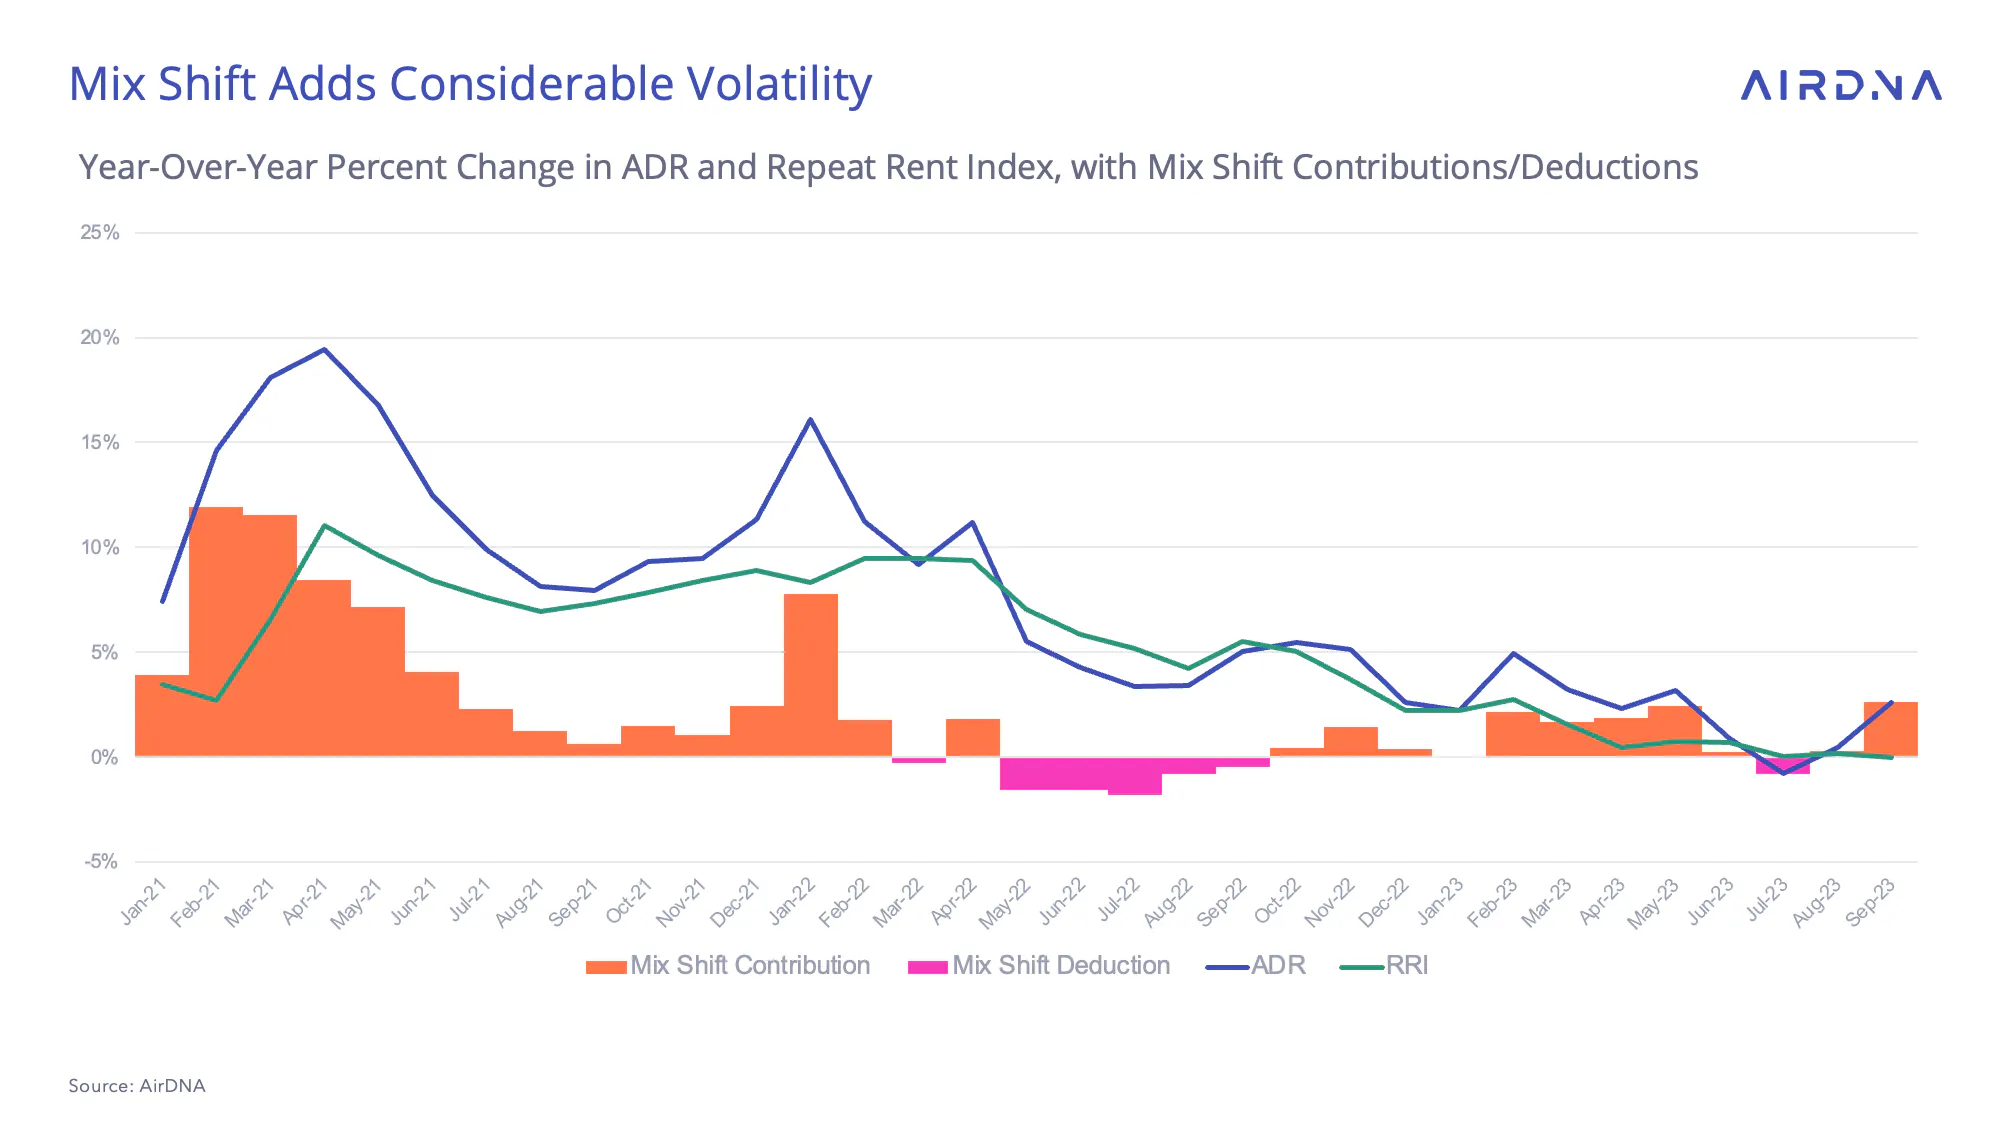
Analyzing ADR changes can get complicated when new listings have fundamentally different characteristics to existing listings. This results in what’s called a mix shift, and it makes it difficult to determine how economic changes and market preferences are affecting the rates of existing properties.
To break apart the effects of mix shift and other factors that impact ADR, AirDNA has developed an index of existing properties only to give a more consistent picture of what to expect for a property that is already in the market. This is called the AirDNA Repeat Rent Index. The results are a smoother series, and the recent ADR decline from April through September seems to have been driven largely by the mix shift. For existing properties, ADR growth has settled between 1% and flat since April.
Read more about the AirDNA Repeat Rent Index and why we created it
The press and data providers like AirDNA often publish aggregate data that paints a broad picture of entire markets, countries, or continents. If you're reading these reports and don’t feel that your experience matches up, well, there might be a good reason for that.
Demand Rebounds in September
Turning to individual markets, demand accelerated nationwide, with 34 markets of the top 50 reporting growth over the previous year. The two largest declines were in Cape Coral/Fort Myers, Florida, and Maui in Hawaii, both recovering from severe natural disasters. Meanwhile, Jersey City/Newark easily takes the top demand growth spot, increasing its demand by nearly 50% compared to 2022. Recent stepped-up enforcement of STR rules in New York all but banning rentals for less than 30 days certainly seem to have made accommodation in nearby New Jersey cities more attractive.
Turning to ADR in the top 50 markets, results varied more than demand. Rates decreased in aggregate in 37 of the 50 top markets. Interestingly, Long Island had the biggest decrease in ADR change at -13.1%An analysis of the Repeat Rent Index for this market suggests that very little of this slide in rate is due to mix shift, suggesting instead that operators may have chosen a different off-season strategy this past summer.
Despite new restrictions, New York had high gains in ADR. This was due to a mix shift as lower-priced listings left the market. In fact, as indicated by the national analysis, mix shift was the primary driver of most ADR losses among the top 50 markets.
Formula One and Halloween Bring Boosts to Strong Fall/Winter
Demand pacing for the U.S. shows that October should have a moderate lift compared with 2022, but holiday travel in November and December is stronger still. November demand already on the books is more than 10% above where it was this time last year, and December is similarly promising at about 9% higher. The already high pace for February and March suggests that some travelers may be booking early spring trips a bit earlier than last year as well.

Travelers to Las Vegas have certainly noticed a big change to the city, and not just the new Sphere event venue, which opened in late September after a month of eerily eyeing the Strip. The roads have been repaved in preparation for Formula One’s Las Vegas Grand Prix in November, with the race marking a long-awaited return to the city after a more than 40-year hiatus. The race promises to be an international attraction, and STR pacing indicates that there is considerable excitement, with a staggering 200% average demand growth YOY for the three days of the race.

Finally, with Halloween fast approaching, many cities are leaning into the spooky season to entice additional autumn visitation. While large events are on the horizon in Orlando, Los Angeles, New Orleans, and others, perhaps no other city has embraced Halloween more than “America’s most bewitching seaport,” Salem, Massachusetts. A historic town known for its charming architecture and grisly past of superstitious executions, Salem is hard-pressed to accommodate many more visitors than last year’s huge numbers. On the other hand, demand is certainly intensifying, as the city is able to rack up impressive revenue gains nonetheless.
As part of our ongoing commitment to accuracy, we continuously implement data methodology improvements, leading to updates to some of the information in this report as of December 18, 2023. For further questions, please contact us.

NEW! Find For-Sale Properties for Your STR Investment with AirDNA
For-sale properties, new amenities insights, “days available” data … it’s been a busy month for AirDNA! In case you missed it, the all-new AirDNA just launched in September. But we didn’t stop there. We’ve been adding new features ever since. These are some of the top changes you’ll notice in October that will help you make smarter, faster investment decisions.
ARTICLE SUMMARY
September marked a notable uptick in the U.S. short-term rental (STR) market after a slower summer. Demand grew by 4.1% on a year-over-year (YOY) basis, up from 2.7% the month prior.
Scott Sage
Senior Vice President, Marketing & Customer Experience
Scott is an Airbnb Superhost and industry pro, having founded Home Base BnBs—a short term rental management company that scaled to 200+ units. Scott combines his experience and passion for hosting to empower AirDNA customers' success. When he's not thinking about STRs, he is hiking, playing basketball, or playing pickleball.


Get started with AirDNA today.
Powerful, easy-to-use tools that help hosts and investors succeed in the short-term rental market.
Try for free