Pomp and Profit: Graduation Events Give STR Hosts Major Pricing Power
Published: May 10, 2024
Last updated: October 30, 2026

Jamie Lane
Key Takeaways
- According to 2023 data, graduation weekends command a 55% premium on ADR ($330 versus $213 nightly rate on average).
- Occupancy rates for 2023’s graduation season averaged 89%, a 62% premium compared to the non-graduation season.
- Small college towns and university submarkets within larger metropolitan areas see the biggest increases in demand and occupancy around commencement dates.
Commencements all around the country have already begun, and for those in the short-term rental (STR) market, this isn't just a season of pomp and circumstance—it's prime time for business.
From the Ivy League’s storied halls to the sprawling campuses of the Big Ten, each event draws a substantial crowd, bringing a surge in demand that STR providers keenly await.
Just how big of a boost do STR hosts see from these graduation events? To find out, the team at AirDNA analyzed 66 submarkets around major universities. We found that graduation is quickly gaining ground as a major seasonal event affecting STR markets.
Background on U.S. Commencement Ceremonies
Commencement season in the United States, from late April through June, is a significant annual celebration marking the end of academic pursuits for students across thousands of institutions. From small liberal arts colleges to large research universities, these ceremonies signify academic milestones and are celebrated with plenty of fanfare.
While commencements occur nationwide, they stand out at major universities within prestigious athletic conferences—the SEC, ACC, Big Ten, Big 12, Pac-12, and the Ivy League. These institutions draw larger crowds due to their sizable student bodies and extensive alumni networks. The result is a pronounced impact on local economies.
Graduation contributed to a 186% average increase in weekend booking revenue for college towns.
The influx of visitors for these high-profile ceremonies considerably increases demand for accommodations, dining, and transportation, similar to major sporting events or national holidays. The economic effect is substantial as these universities often host multiple ceremonies over the course of several days to accommodate different faculties, thereby extending the benefits over a longer period.
While all commencement ceremonies stimulate local economies, those at larger universities particularly drive substantial economic activity. Graduations are therefore pivotal times for short-term rental markets to capitalize on increased visitor demand.
Commencement STR Data at a Glance
Our analysis focused on 66 submarkets situated around major universities affiliated with high-profile athletic conferences, including the SEC, ACC, Big Ten, Big 12, Pac-12, and the Ivy League.
We specifically examined and compared the rental data from the graduation period of 2023 against the weeks immediately preceding and following the events, which are considered non-event periods.
This comparative approach allowed us to pinpoint the changes and trends that uniquely arise during commencement times. Here’s what we discovered:
- Available Listings up 14%
- Demand up 85%
- Revenue is up 186%
- Occupancy averages 89.0% compared to 54.8%, a 62% increase
- ADR average $330 compared to $213, a 55% increase
- RevPAR up 152%
Now, let's compare how major universities stack up against each other based on key metrics, such as demand, revenue per available rental (RevPAR), average daily rates (ADR), and occupancy.
The Top 15 Universities for STR Demand
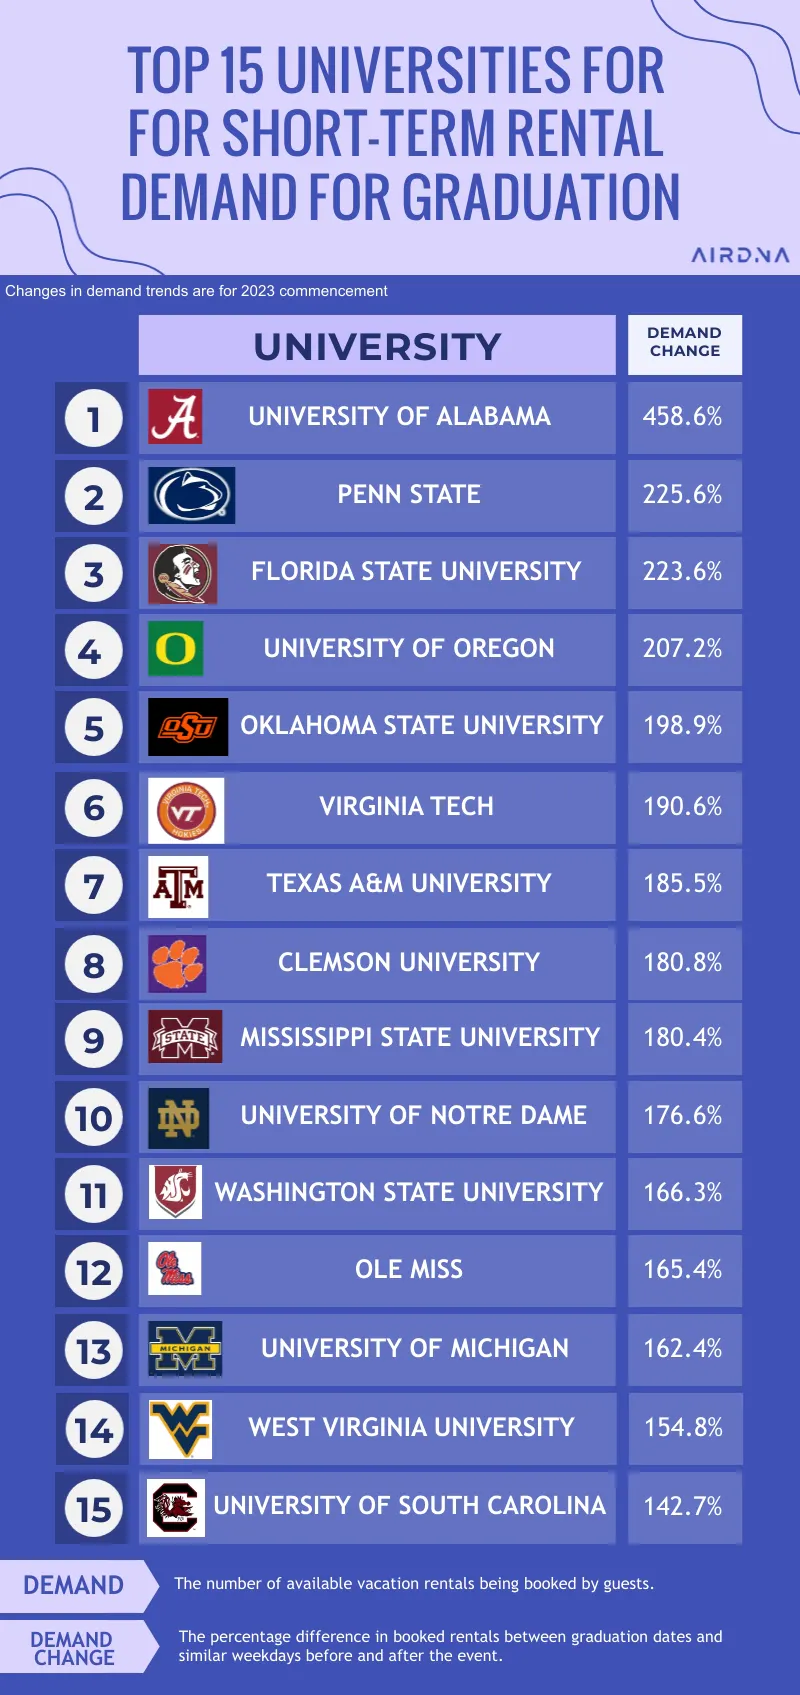
The infographic above compares demand for the graduation weekend in each college town with the weekends before and after graduation. You might wonder why we’re comparing demand as a percentage change from surrounding dates, rather than ranking the universities against each other by the actual number of nights being booked for graduation. Good question!
Comparing the demand nights, or how many vacation rentals guests are booking, between university towns wouldn’t accurately represent the number of people commencement ceremonies are bringing into each market. That’s because university markets vary in size based on many different factors, such as the size of the university, the type of location (e.g., rural versus urban), and the diversity of attractions in the area.
For example, West Virginia University has approximately 28,000 students while the University of Alabama has 38,000—the number of people coming into town for graduation will differ based on student body size alone. West Virginia University is also located in Morgantown, a small town of 30,000 people, that is defined by the presence of the university. On the other hand, Eugene, Oregon is a city of over 177,000 people, and visitors are drawn to the area for reasons beyond the presence of the University of Oregon.
With these factors in mind, we compared demand within each market to see how much graduation affects short-term rental performance in that area, and then we ranked universities based on demand change. This methodology allows us to fairly compare universities of different kinds.
Markets where demand skyrockets around graduation may imply that the university calendar has a strong effect on short-term rental performance in that area, and graduation could be THE event of the year for that town. That certainly would be the case for the University of Alabama. Though they didn’t win the college football national championship in 2023, they reigned supreme in short-term rental performance during graduation weekend with a 458% increase in demand.
The Top 15 Universities for ADR
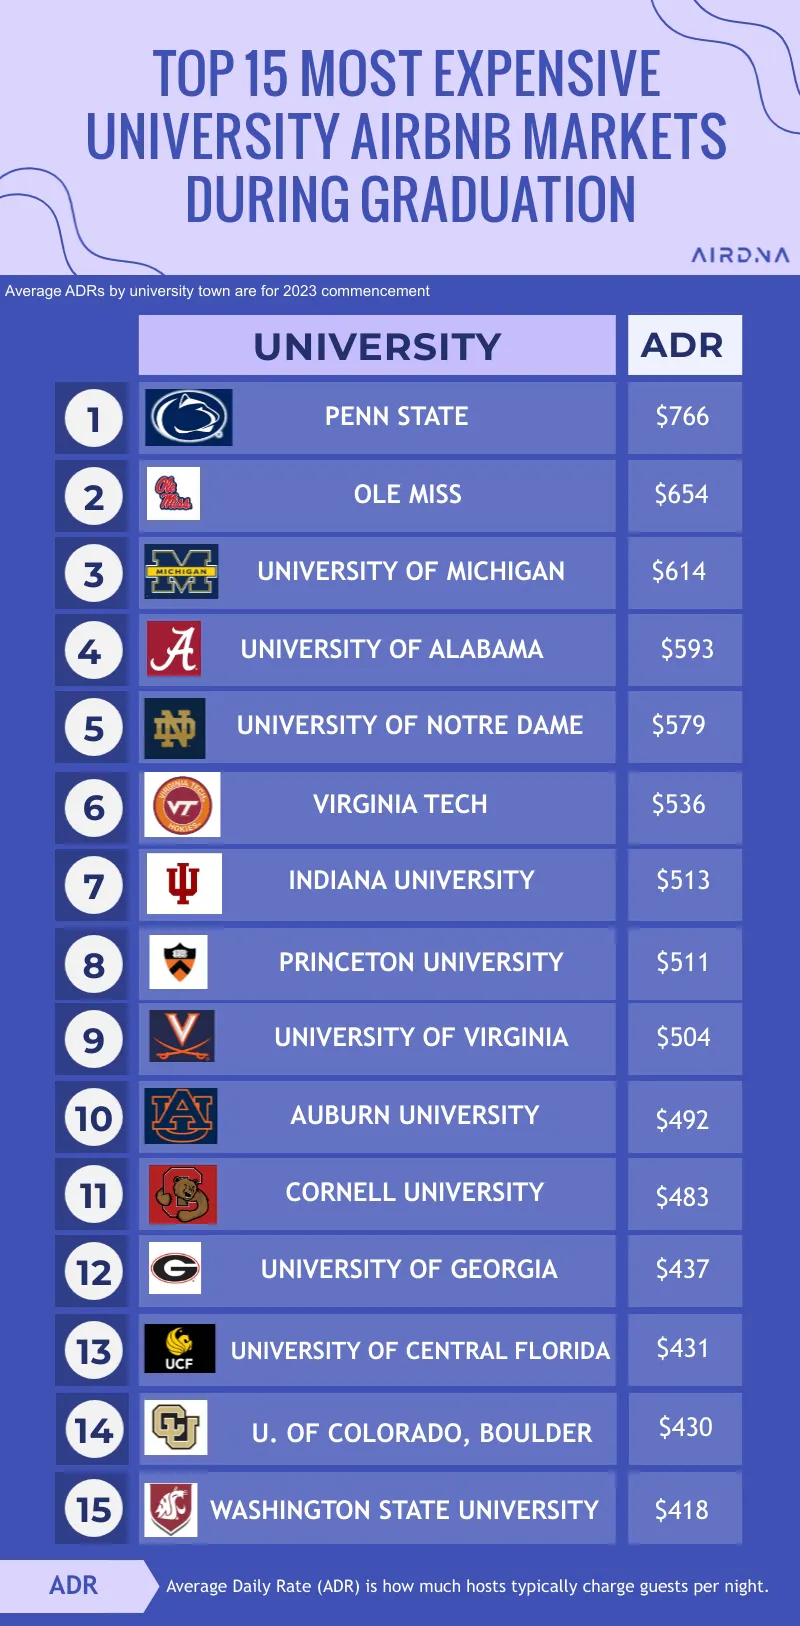
The top 15 universities for average daily rates (ADR) during graduation weekend remind us why it’s important to examine short-term rental performance from multiple perspectives.
You’ll notice that the universities that made the list for highest demand have a different ranking for ADR, or they may not have made the list at all. In fact, 8 universities on the list for ADR are “new,” having not ranked in the top 15 for demand.
For instance, the University of Michigan ranked number 13 for graduation demand, but it’s number 3 for ADR. What does that mean?
The data indicates that while there is a significant influx of visitors to Ann Arbor, MI for graduation, it is not as impactful on the city as commencement is for other college towns. However, the higher ADR ranking suggests that guests traveling for this event are willing to pay a premium. Demand is high enough that hosts have the pricing power to ask for high nightly rates around commencement.
Numbers 7 through 14—Indiana University, Princeton University, University of Virginia, Auburn University, Cornell University, University of Georgia, University of Central Florida, and University of Colorado Boulder— all appear on the ranked list for ADR.
While the influx of visitors to their respective markets for graduation wasn’t high enough to put them in the top 15 for demand, their ADR on 2023 graduation dates was an impressive $430 or higher.
Although some universities may not attract a large number of visitors, the ones who do visit tend to spend generously. Therefore, it’s crucial for hosts to stay updated on important metrics and implement smart pricing strategies. This will help them maximize revenue during peak times, such as graduation seasons.
Graduation Weekend Beats the Average
Analyzing Average Daily Rates (ADR) during graduation weekends provides compelling insights into how these events influence STR pricing strategies across various university towns. Notable shifts in ADR highlight the premium guests are willing to pay for accommodations during these significant academic celebrations.
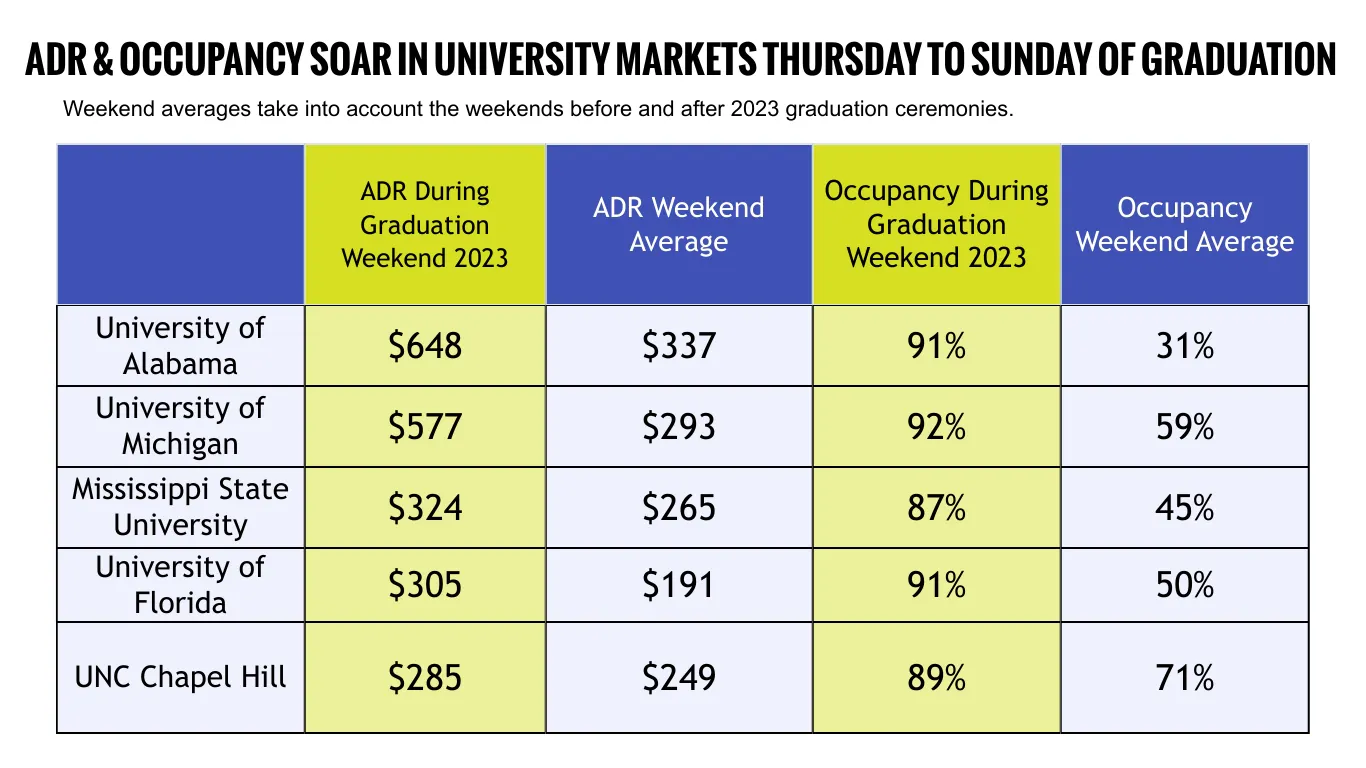
Here are some standout examples from the data:
- University of Alabama: ADR leaps from $337 to $648, with occupancy escalating dramatically from 31% to 91%, reflecting the substantial market response to graduation activities.
- University of Michigan: ADR is nearly double, increasing from $293 to $577, alongside an impressive surge in occupancy from 59% to 92%.
- University of Florida: Notably, ADR rises from $191 to $305, while occupancy jumps from 50% to 91%, showcasing the heightened demand for accommodations.
Note that the table above averages Average Daily Rates (ADR) for the Thursday, Friday, and Saturday or graduation weekend. This diverges from the ranked list above, which only takes into account the Friday and Saturday nights of commencement weekend. Including Thursday night rates in the calculation raises the average ADR for University of Alabama, for instance, and lowers it for the University of Michigan.
Contextualizing Market Performance
While universities like Michigan and Alabama show exceptional ADR growth, it's important to consider the broader market dynamics. Universities situated in larger cities may not experience as pronounced a graduation impact because the area offers a variety of other attractions that dilute the centrality of university events. This situation underscores the necessity for STR hosts to understand their specific market dynamics, including how local attractions and seasonal events might compete with or complement university-driven demand.
University Submarkets Are Celebrating Too
It seems everyone’s in a celebratory mood during commencement season. Data from university submarkets during these events shows a significant uptick in demand compared to the broader city markets.
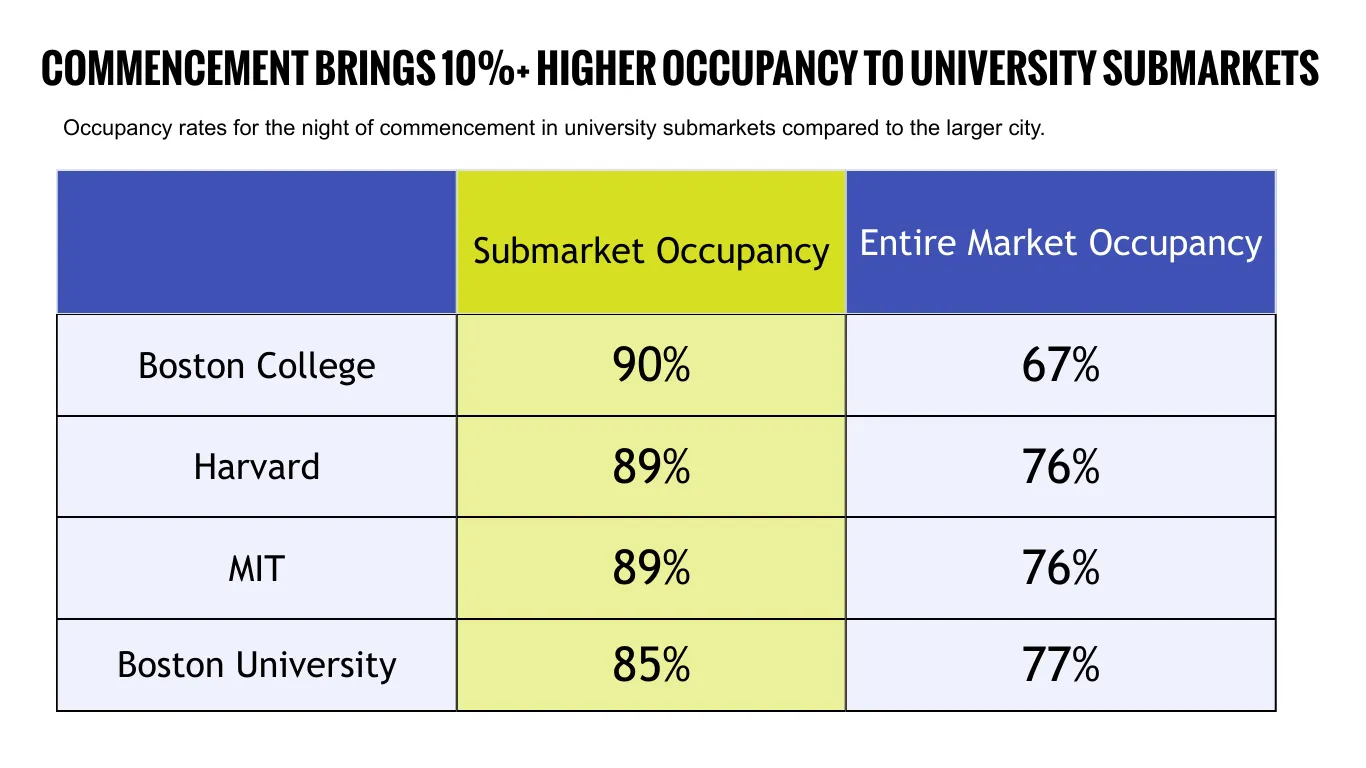
- Boston College: This area experiences an impressive 90% occupancy rate, towering over the city’s average of 67%.
- Harvard and MIT: Both institutions see their local submarkets achieve an 89% occupancy rate, surpassing the general Boston rate of 76%.
- Boston University: In the submarket surrounding Boston University, occupancy reaches 85%, which outpaces the city's overall average of 77%.
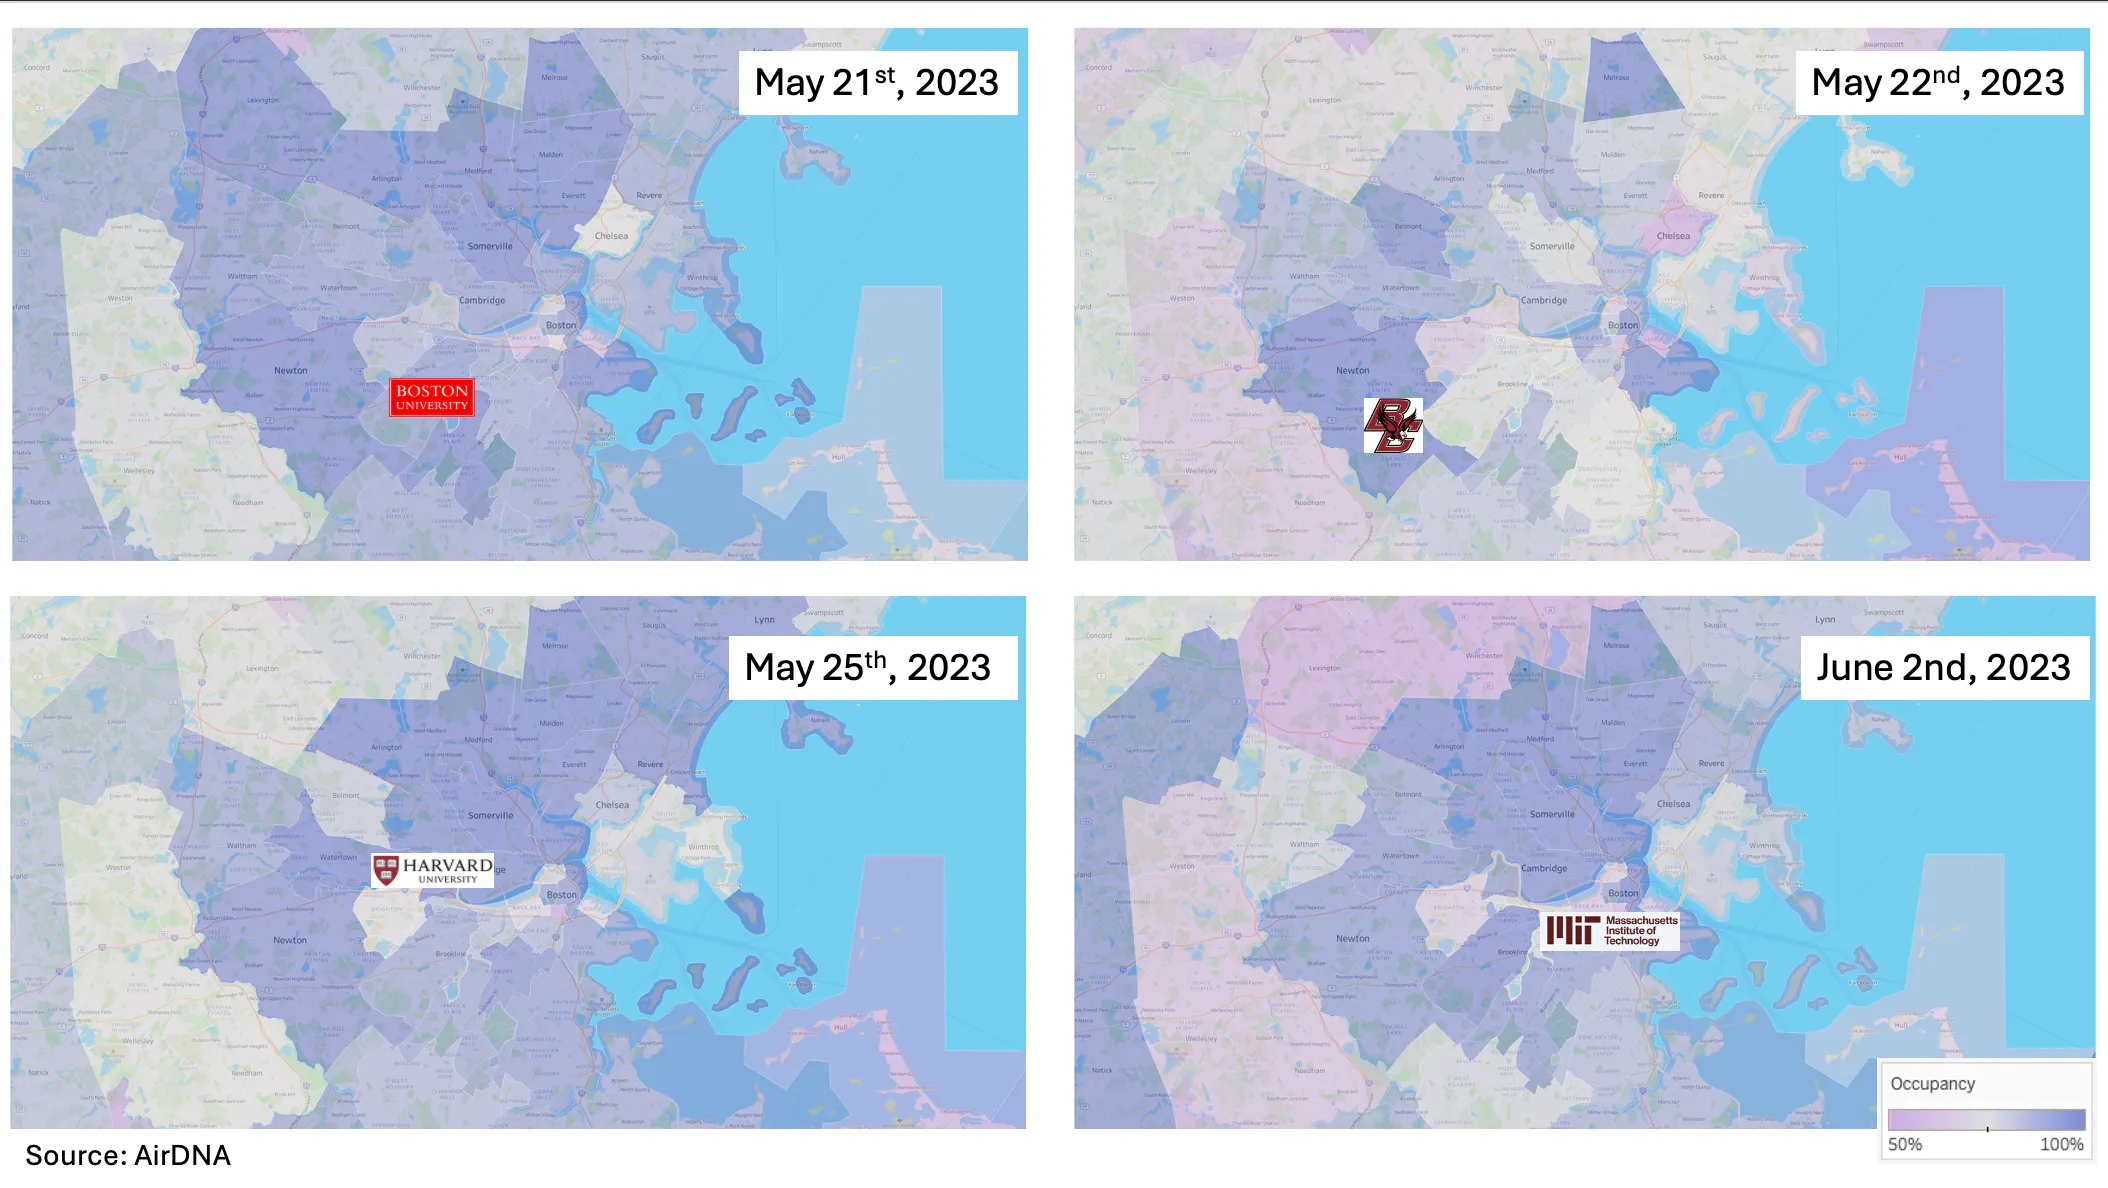
Better occupancy in university submarkets during commencement ceremonies suggests a strong, localized demand. Families and friends flock to these areas, drawn not only to celebrate their graduates but also to partake in the university's wider festivities. This influx of visitors often turns university submarkets into high-demand zones during commencement.
Watch out College Football: The Rise of Graduation as a Peak STR Season
In college towns across the United States, the vacation rental market is heavily impacted by two major events: graduation and football season. Graduation season typically occurs in May, while football season takes place between August and December. There is generally a surge in the supply of rental properties during these times.
The graphs below illustrate the difference in impact between these two seasonal events in cities like Athens, Georgia, and Ann Arbor, Michigan. They show that while commencement season may not quite match the excitement of football season, it's certainly getting close.
A Tale of Two Cities: Athens and Ann Arbor
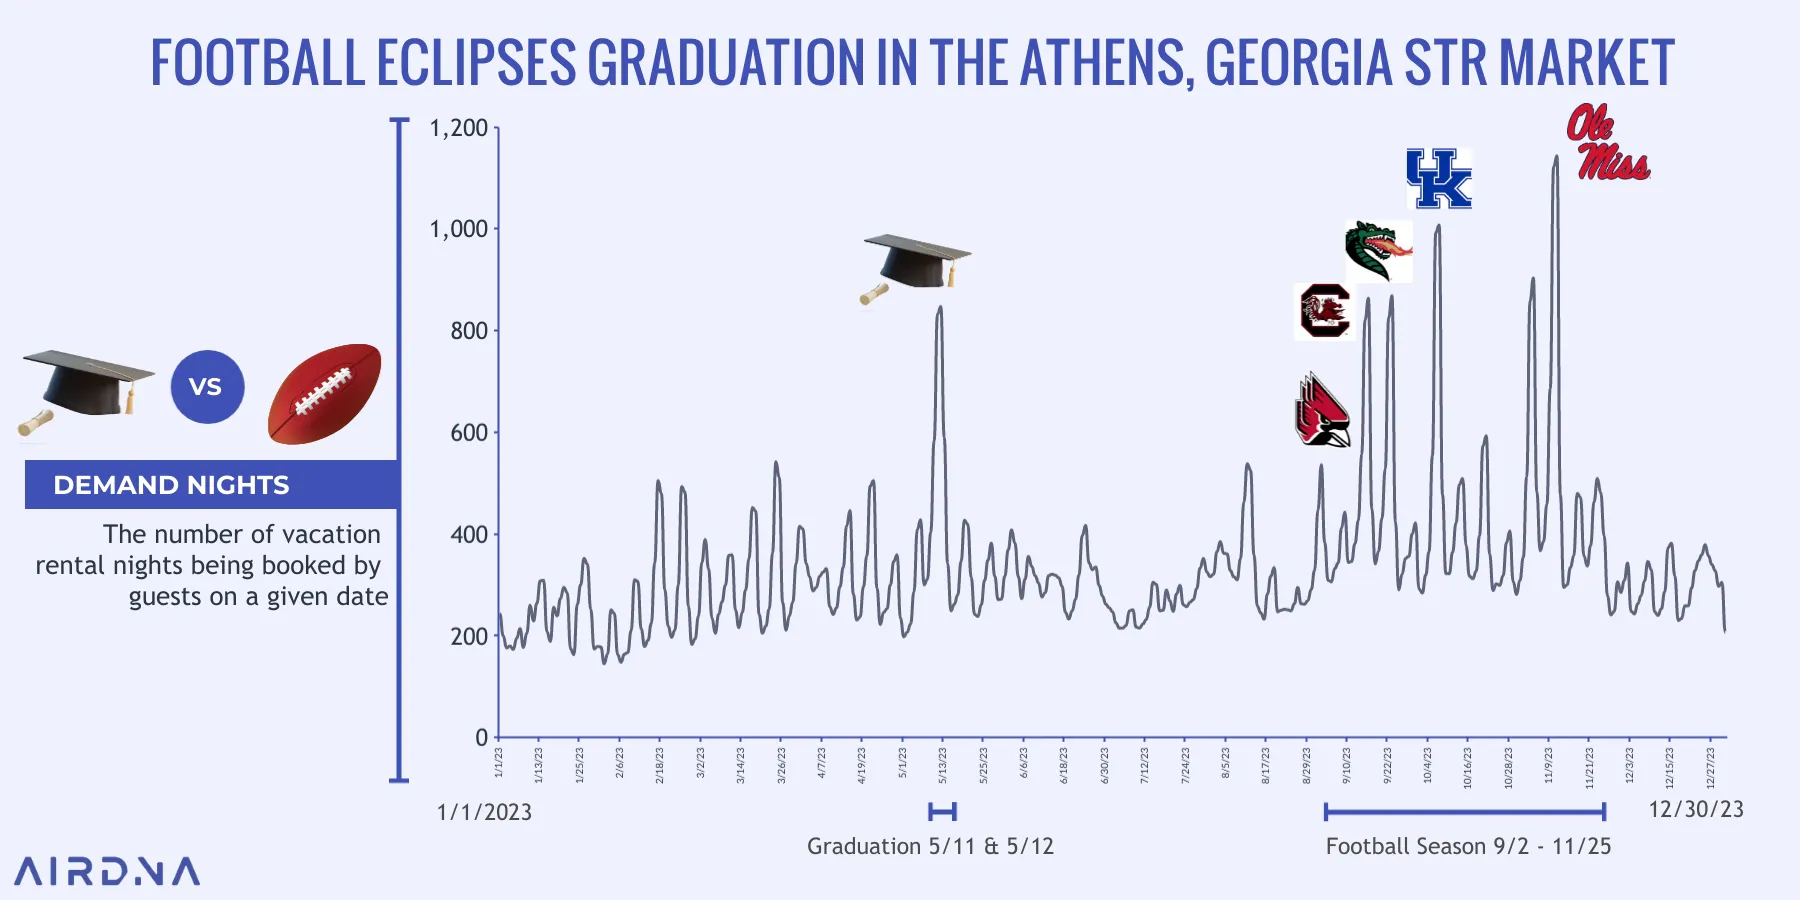
In Athens, Georgia, the University of Georgia's football games significantly spike STR demand, as seen in the graph's towering peaks during game weekends. Yet, graduation does not fall far behind, marking its presence with a substantial, albeit slightly softer, peak. This pattern underscores football's reign and highlights graduation as a formidable contender in the STR market.
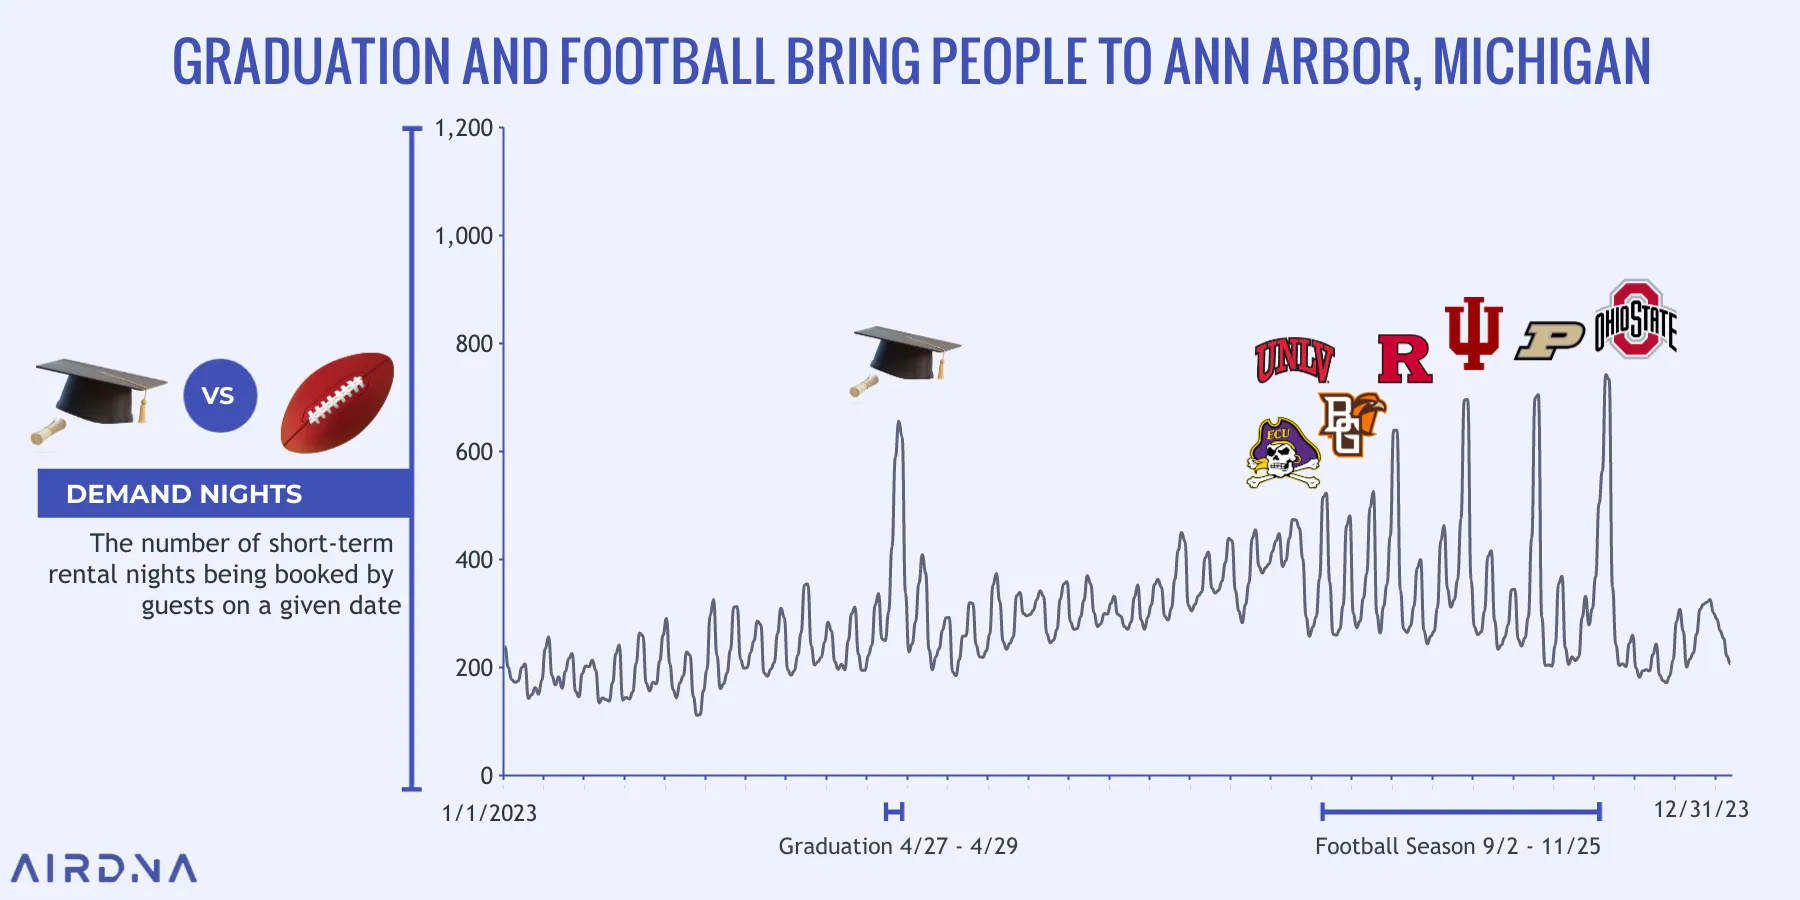
Moving north to Ann Arbor, Michigan, the impact of graduation becomes even more pronounced.
During football season, supply in Ann Arbor was up about 55% to welcome Wolverine fans this past fall compared to the summer months of June and July. Over graduation weekend, just about all listings were booked with occupancy averaging 93% for the weekend. That’s a staggering 96% increase in occupancy and a 162% increase in demand compared to the following weekend.
The average occupancy in Ann Arbor for the night before graduation and graduation day was 92% last year. However, the second highest occupancy weekend in 2023 was the weekend that the Ohio State Buckeyes were in town to play the Wolverines on November 25th. The average occupancy for that weekend was 87%. However, the occupancy the night before the game and the night of the game was the same as graduation—a whopping 93%.

Occupancy Rates Show Graduation Gaining Ground
Across the nation, other small college towns have adeptly tuned their responses to the peak demand periods of graduation and football season. These times consistently deliver massive spikes in occupancy. Among the college towns we examined, graduation weekend emerged as the peak occupancy period surpassing 98% in locations like:
- Pullman, WA (Washington State University)
- Knoxville, TN (University of Tennessee)
- Ames, IA (Iowa State University)
When looking at yearly occupancy trends, the only weekends that see comparable spikes in demand are weekends of big college football rivalry games. These observations underscore several crucial insights:
- Seasonal Dynamics: Both graduation in May and football season from August to December create notable highs in the STR market, driving up occupancy and average daily rates (ADRs).
- Economic Parity: While football often enjoys a broader regional pull due to its consistent schedule, graduation weekends concentrate a significant influx of visitors—comparable to major game days in both demand and revenue potential.
Capitalizing on Commencement Season
Before tossing your cap to celebrate another successful STR season, remember that the game is just starting for STR hosts in university towns. As commencement ceremonies usher in waves of visitors, early planning and dynamic market engagement become crucial.
Here’s your playbook for making the most out of the graduation season and other peak periods:
1. Early Listings and Dynamic Pricing
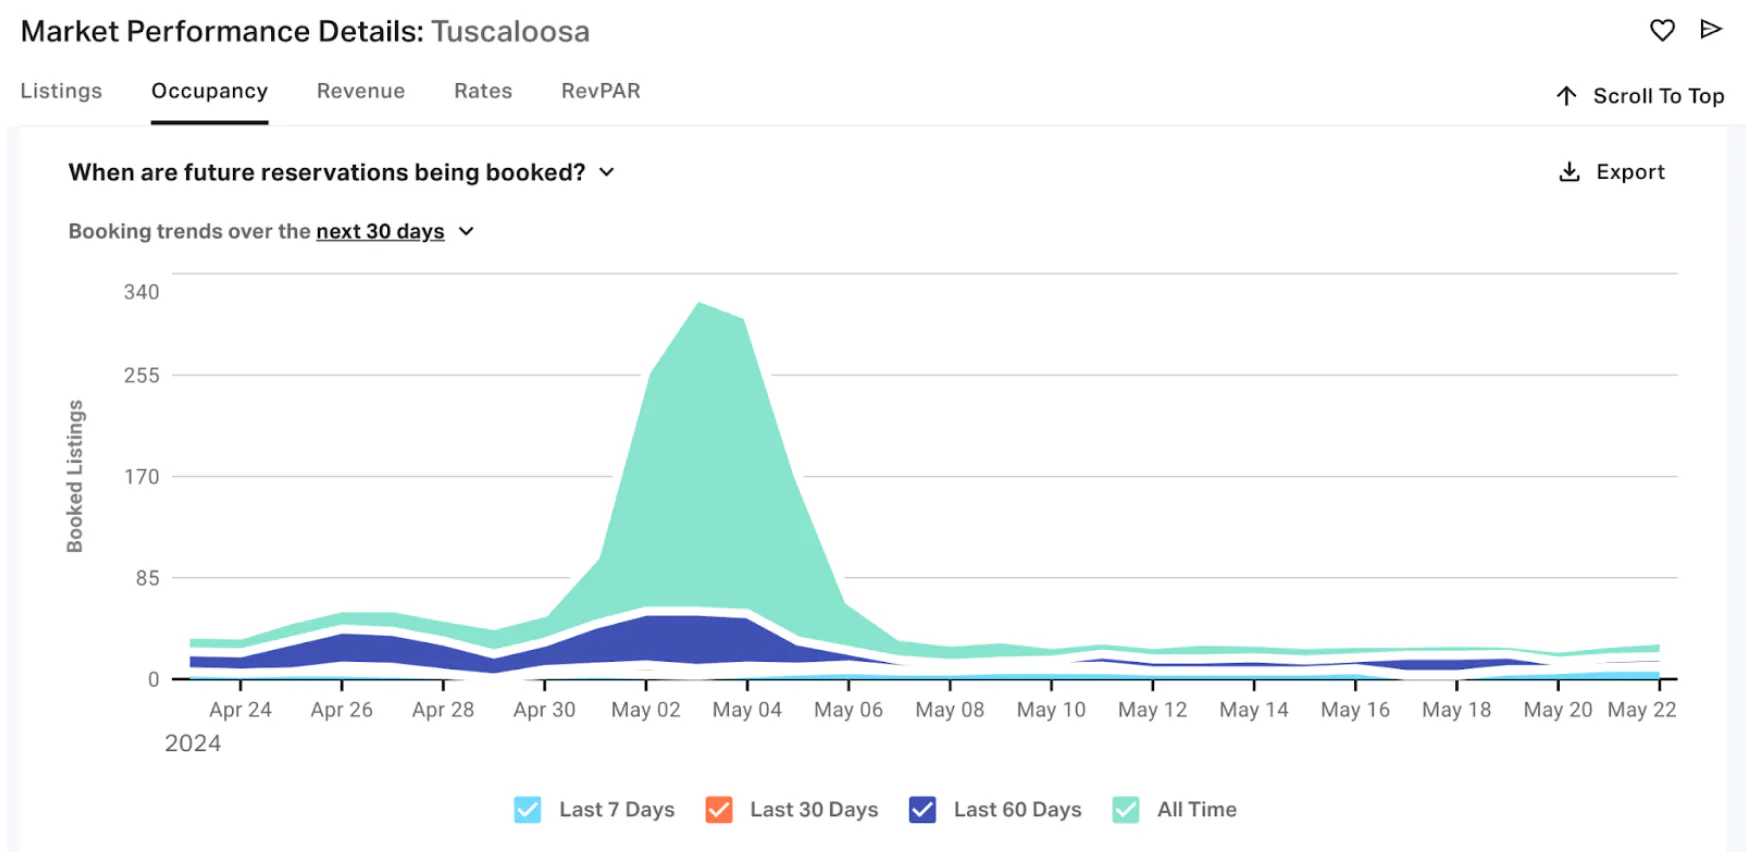
The early host catches the prime bookings! List your properties well in advance and utilize dynamic pricing tools to adjust rates as demand begins to build. Insights from AirDNA's pacing data reveal significant trends, such as those observed in Tuscaloosa. Most reservations for the commencement weekend in 2024 were booked more than 30 days in advance. Setting your prices early and adjusting them as the event approaches can maximize your revenue potential.
2. Harness Pricing Power
Earlier, we observed that even if some markets don't have a large number of visitors, the guests they do attract tend to spend more on accommodations. This suggests that hosts in these areas have considerable pricing power, particularly during busy periods like graduation season when demand is high and the availability of accommodations is limited.
3. Understand Your Market’s Peak Periods
Universities greatly impact the market in college towns. Analyzing historical data on events like graduations and key football games can help STR owners prepare for demand surges.

4. Tailor Your Marketing to Event Goers
Design your marketing to appeal directly to families and friends visiting for graduations and fans attending games. Highlight the convenience of your location, the comfort of your accommodations, and any special amenities that make their stay memorable.
5. Leverage Local Events
Stay updated on university calendars and local events that could increase demand for accommodations. Proactive planning allows you to set competitive prices and tailor experiences that attract more guests.
6. Prepare for Last-Minute Bookings
While securing early bookings is crucial, be ready for last-minute guests. Properties near major event venues often see a flurry of last-minute activity as plans solidify.
Learn More About How Events Shape STR Markets
What do graduation ceremonies, Eurovision, the Super Bowl, and the total solar eclipse have in common?
At first glance, these events might seem wildly different, but they all share a powerful ability to transform local markets, particularly in short-term rentals. Each event draws large crowds, creates significant demand for accommodations, and offers unique opportunities for hosts to capitalize on increased visitor traffic.
That’s why we regularly examine events using AirDNA’s comprehensive data. Each of our articles in this series delves into the interplay between cultural milestones, economics, and vacation rentals, offering detailed insights to help you understand and capitalize on investment opportunities.
ARTICLE SUMMARY
During commencement celebrations, STR markets experience occupancy and revenue increases, outperforming non-event periods with remarkable consistency.
Jamie Lane
AirDNA Chief Economist
He is responsible for data analysis, thought leadership, and leveraging advanced analytical techniques to provide new insights into short-term rental market trends. Native to Atlanta and an Airbnb host himself, Jamie enjoys cycling, mountain biking, backpacking, running, and playing in a dart league in his free time.