


Short-Term Rental Market Analysis Guide for Investors
Published: November 6, 2025
Last updated: September 25, 2026

Bram Gallagher
Key Takeaways
- Short-term rentals offer high rental income potential, flexibility, and the opportunity for portfolio diversification.
- Completing a short-term rental market analysis helps you dodge money-pit properties and zero in on investments that actually deliver returns.
- Analyze submarket data, not city-wide averages. Airbnb hosts in one neighborhood might generate $50K annually while another area barely supports $20K in earnings.
The short-term rental market has proven to be something of a Gold Rush, luring investors far and wide with the promise of high returns and flexibility. However, many investors have found that you can’t strike gold just anywhere. Navigating this dynamic industry requires thinking beyond just acquiring and listing properties and instead making strategic investment decisions based on deep short-term rental market analysis that examines both markets and submarkets.
After all, there are a lot of details that real estate investors and property owners need to know, from understanding the reasons to invest in short-term rental properties to finding the best places to invest in the first place.
Whether you're a seasoned investor looking to expand your portfolio or a novice exploring the possibilities of short-term rentals, this guide will teach you how to complete a thorough short-term rental market analysis to guide your investments and maximize your returns.
Benefits of Short-Term Rental Market Analysis
Conducting comprehensive short-term rental market analysis is crucial to making informed decisions and realizing your money-making potential. Market analysis serves as the cornerstone of a successful real estate investment strategy by providing valuable insights into factors that can impact your investment. These factors include local market dynamics, submarket performance differences, demand trends, regulatory considerations, and potential risks.
“There are too many gurus out there talking about how investing in short-term rentals is passive. It’s becoming less and less so every day,” says Tyler Coon, founder and CEO of short-term rental real estate agency Savvy STR Agents. “Active participation is required to cash flow the property the best way possible.”
Thorough market research helps investors:
Minimize risks
Market research helps investors identify potential risks associated with short-term rental investments, such as:
- Regulatory challenges
- Oversupply or market saturation
- Seasonality fluctuations.
Once investors understand these risks, they can develop risk mitigation strategies and make more informed decisions to protect their investment capital.
For example, if your analysis reveals that a city is considering stricter STR regulations, you might diversify by investing in multiple markets rather than going all-in on one location. Or say you discover a market has 30% more listings than last year. That could be your cue to either look for an underserved submarket within that city or pivot to a less saturated area entirely.
Seasonality risks? Hedge your bets by targeting markets with year-round demand or by purchasing properties that appeal to different guest segments (think: a ski town property that also attracts summer hikers). The point is this: every risk you identify through analysis is a risk you can actually do something about before you sign on the dotted line.
Optimize profitability
Analyzing key performance indicators like occupancy rates, average daily rates (ADR), and rental pricing trends enables you to optimize the profitability of your vacation rental property. Investors can use these measures to adjust pricing strategies to maximize revenue potential and achieve higher returns on investment.
What's the average occupancy rate for comparable properties in your target submarket? What ADR are top performers commanding, and what amenities or features justify their premium pricing? Once you have these benchmarks, you can identify specific opportunities to outperform.
If comparable properties average 65% occupancy at $150/night, but you notice that listings with hot tubs achieve 75% occupancy at $185/night, you've just identified a $12,000+ annual revenue opportunity (assuming a 10% occupancy boost and $35 rate premium over 365 days).

Plan investments
Short-term rental market analysis can answer key questions:
- What's driving demand in this market—business travel, tourism, events, or remote workers?
- What property types are undersupplied relative to demand?
- What amenities do guests consistently request but rarely find?
Investors can develop strategic plans tailored to specific market conditions by gathering data on local real estate market dynamics, competition, and guest preferences. For instance, if your analysis shows that pet-friendly properties earn 25% more per night but only 15% of listings allow pets, you've identified a clear positioning opportunity.
Your investment plan should then outline specific decisions—like targeting properties with fenced yards, budgeting for pet-friendly flooring, and marketing to pet owners—that capitalize on this gap. The goal is to move beyond generic "buy a property and list it" thinking and instead create a detailed roadmap that connects market insights directly to property selection, renovation priorities, and operational strategies.
Identify target markets
Investors can identify target markets through in-depth analysis of:
- Demand indicators like year-over-year growth in bookings, average occupancy rates, and seasonal demand patterns
- Supply metrics like how quickly inventory is growing and whether new supply is being absorbed by demand or creating oversaturation
- Economic factors like median home prices, property tax rates, and tourism infrastructure investments
Analysis of these factors gives investors the tools to focus on markets where they are likely to achieve higher occupancy rates and better revenue potential.
Develop effective marketing strategies
Market analysis provides valuable insights for developing effective marketing strategies for vacation rental properties. Investors should seek to understand:
- Guest preferences
- Short-term rental reservation channels (i.e. booking platforms)
- The competitive landscapes
A thorough short-term rental market analysis includes a competitive positioning analysis long before you even create your listing.
If every competitor emphasizes "downtown location" but guests consistently complain about noise and parking, you might position your slightly-outside-downtown property as a "peaceful retreat with free parking, just 10 minutes from the action."
If your target market shows that 70% of bookings come through Airbnb but 30% come through Vrbo, make sure you're optimized for both platforms.
If your analysis reveals that your ideal guests are families attending youth sports tournaments, consider marketing directly to tournament organizers or advertising in sports parent Facebook groups, not just relying on OTA traffic.
How to Analyze Short-Term Rental Markets
Analyzing a short-term rental market involves a multi-step approach that covers every last key performance indicator (KPI) you need to make an informed investment decision. Here's a breakdown of key steps:
1. Identify promising locations
Start by evaluating potential locations for your short-term rental property. This sets the stage for your analysis, as a desirable location impacts occupancy rates and rental income.
When researching potential locations for your short-term rental property, focus on areas with high tourism activity, proximity to popular attractions, and convenient amenities. AirDNA can be a key tool in this process. Many investors start by looking close to home. Locate ‘Find a Market’ in the lefthand navigation bar and type in your city or town name.
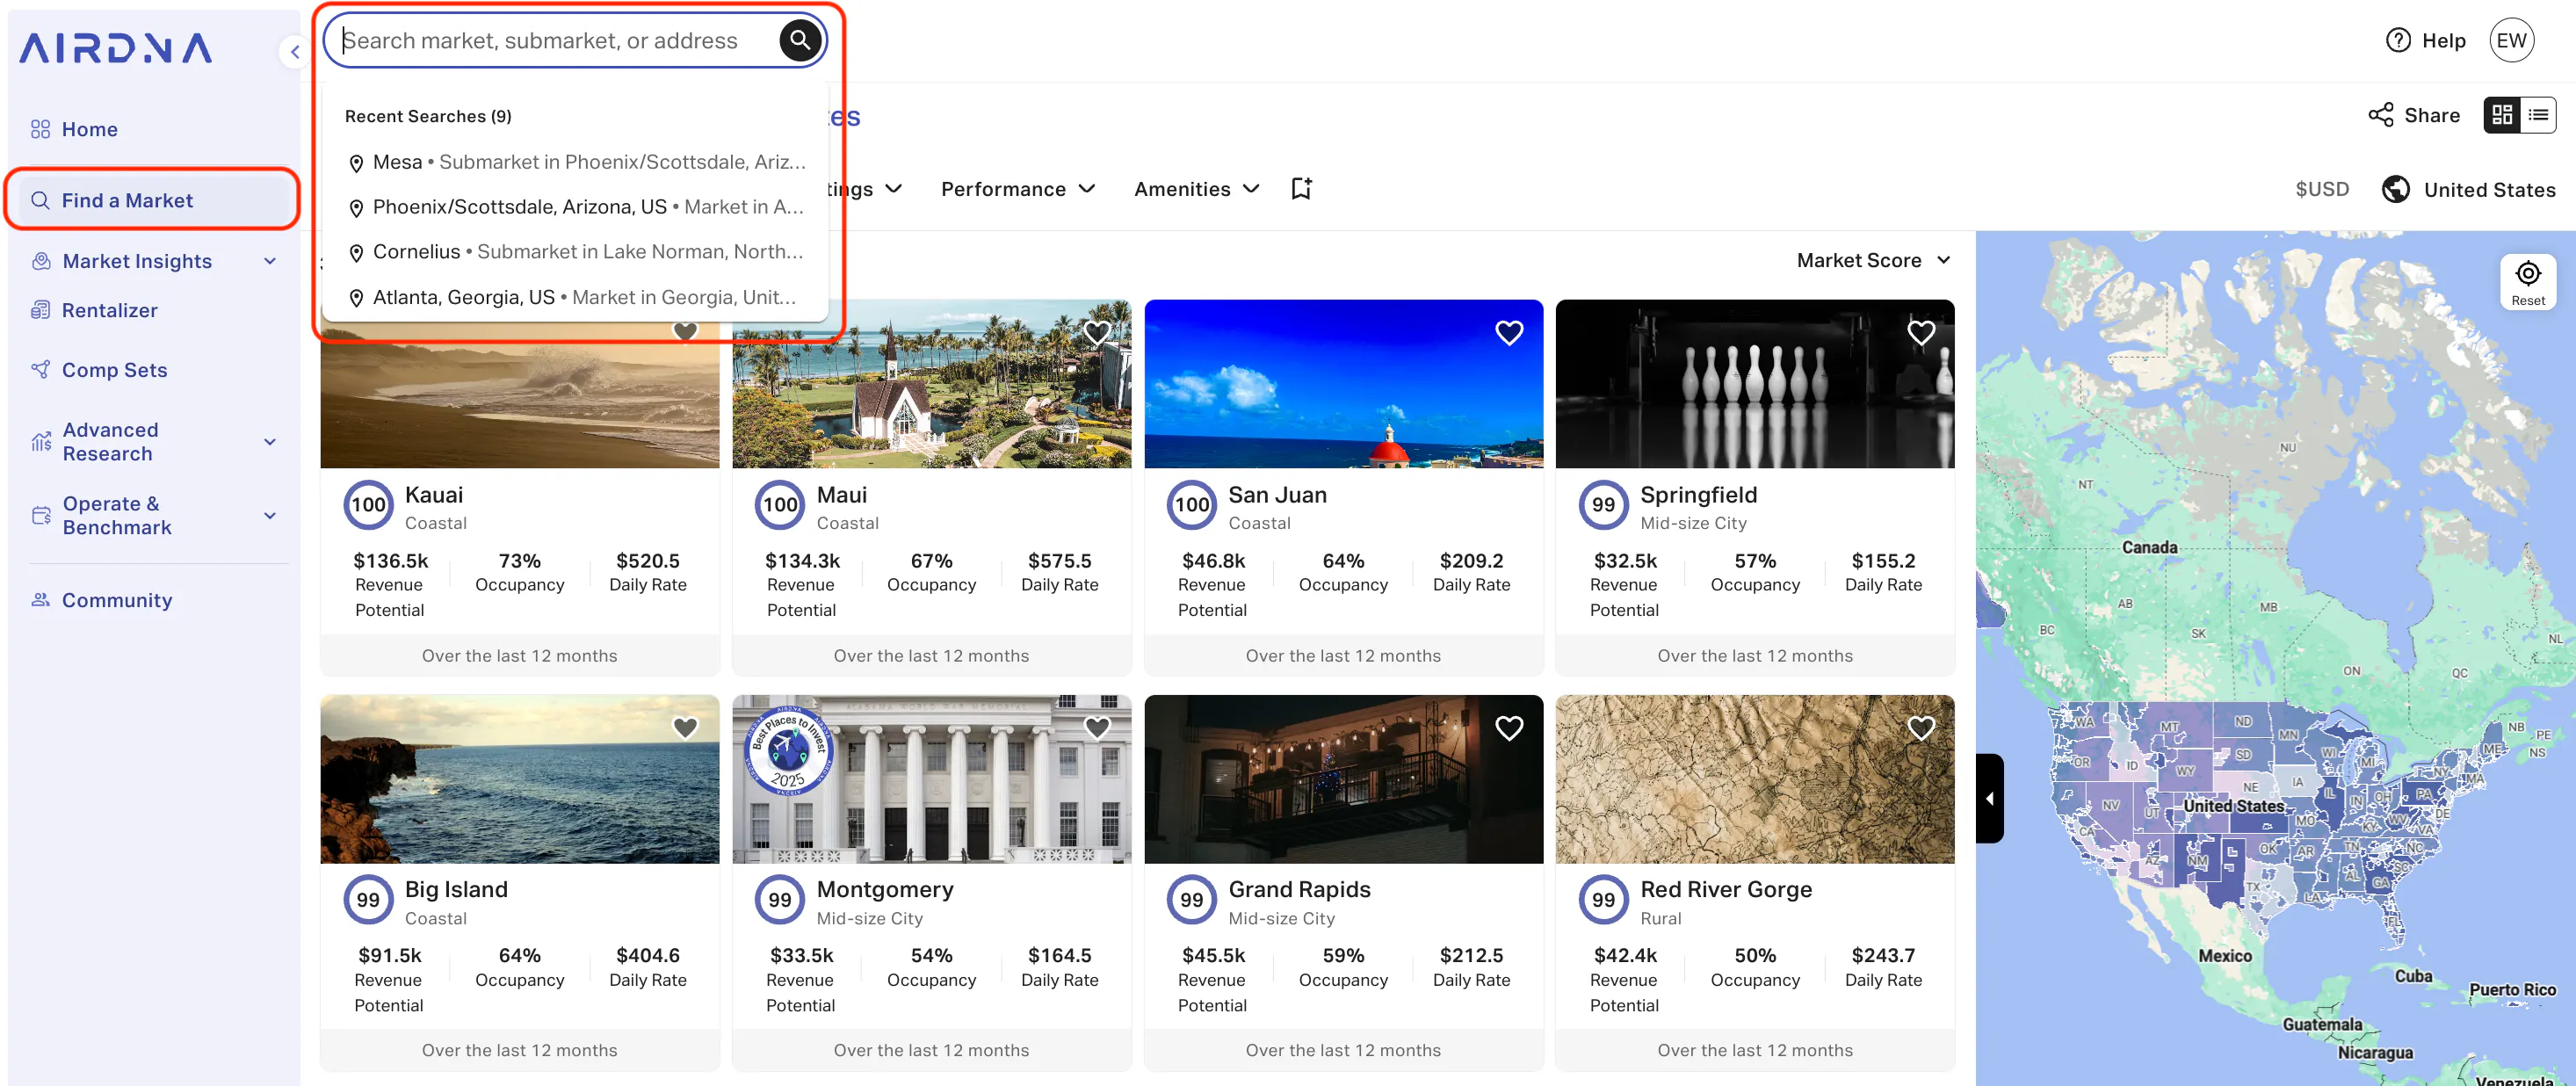
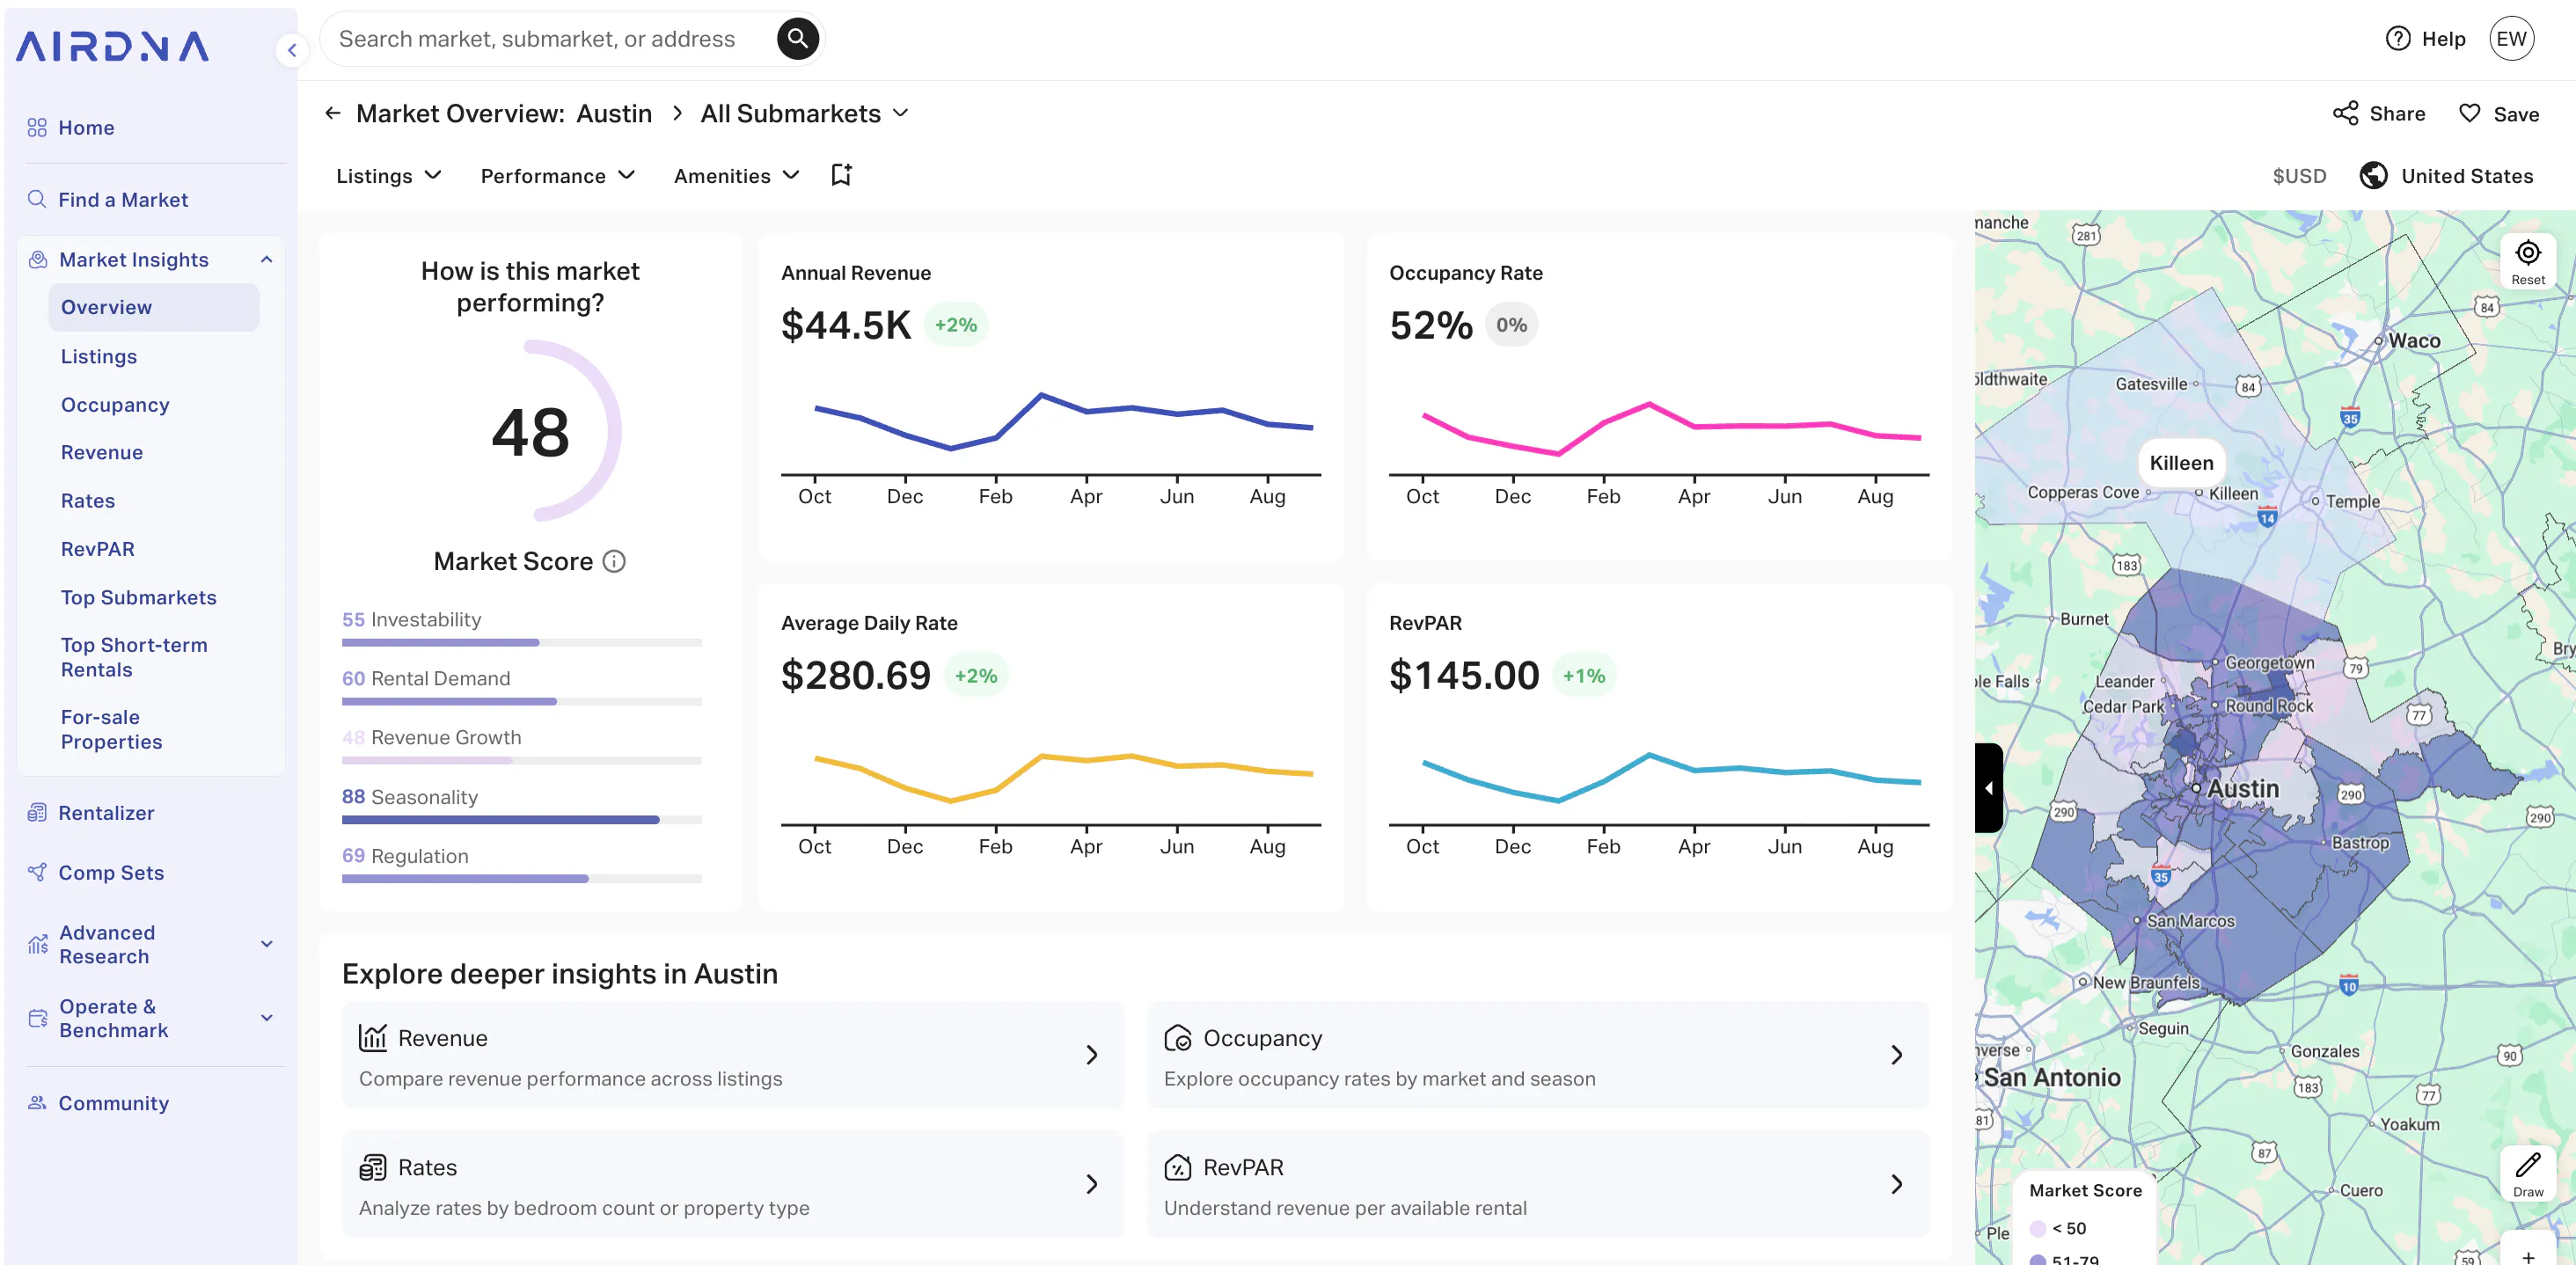
AirDNA generates Market Scores that range from 40 to 100, with 100 being the highest possible score. This score takes into account five key metrics: investability, rental demand, revenue growth, seasonality, and regulation. The Market Score reflects how short-term rentals in an area are performing and empowers you to compare locations, regardless of their geographical or size differences.
Market Scores are assigned on a market and submarket level (think neighborhoods or zip codes). Don’t be discouraged if you see that your city has a poor Market Score. There are often high-performing pockets within a larger area.
Austin, Texas is a great example. Austin has a 48 Market Score and a market occupancy average of 52%.
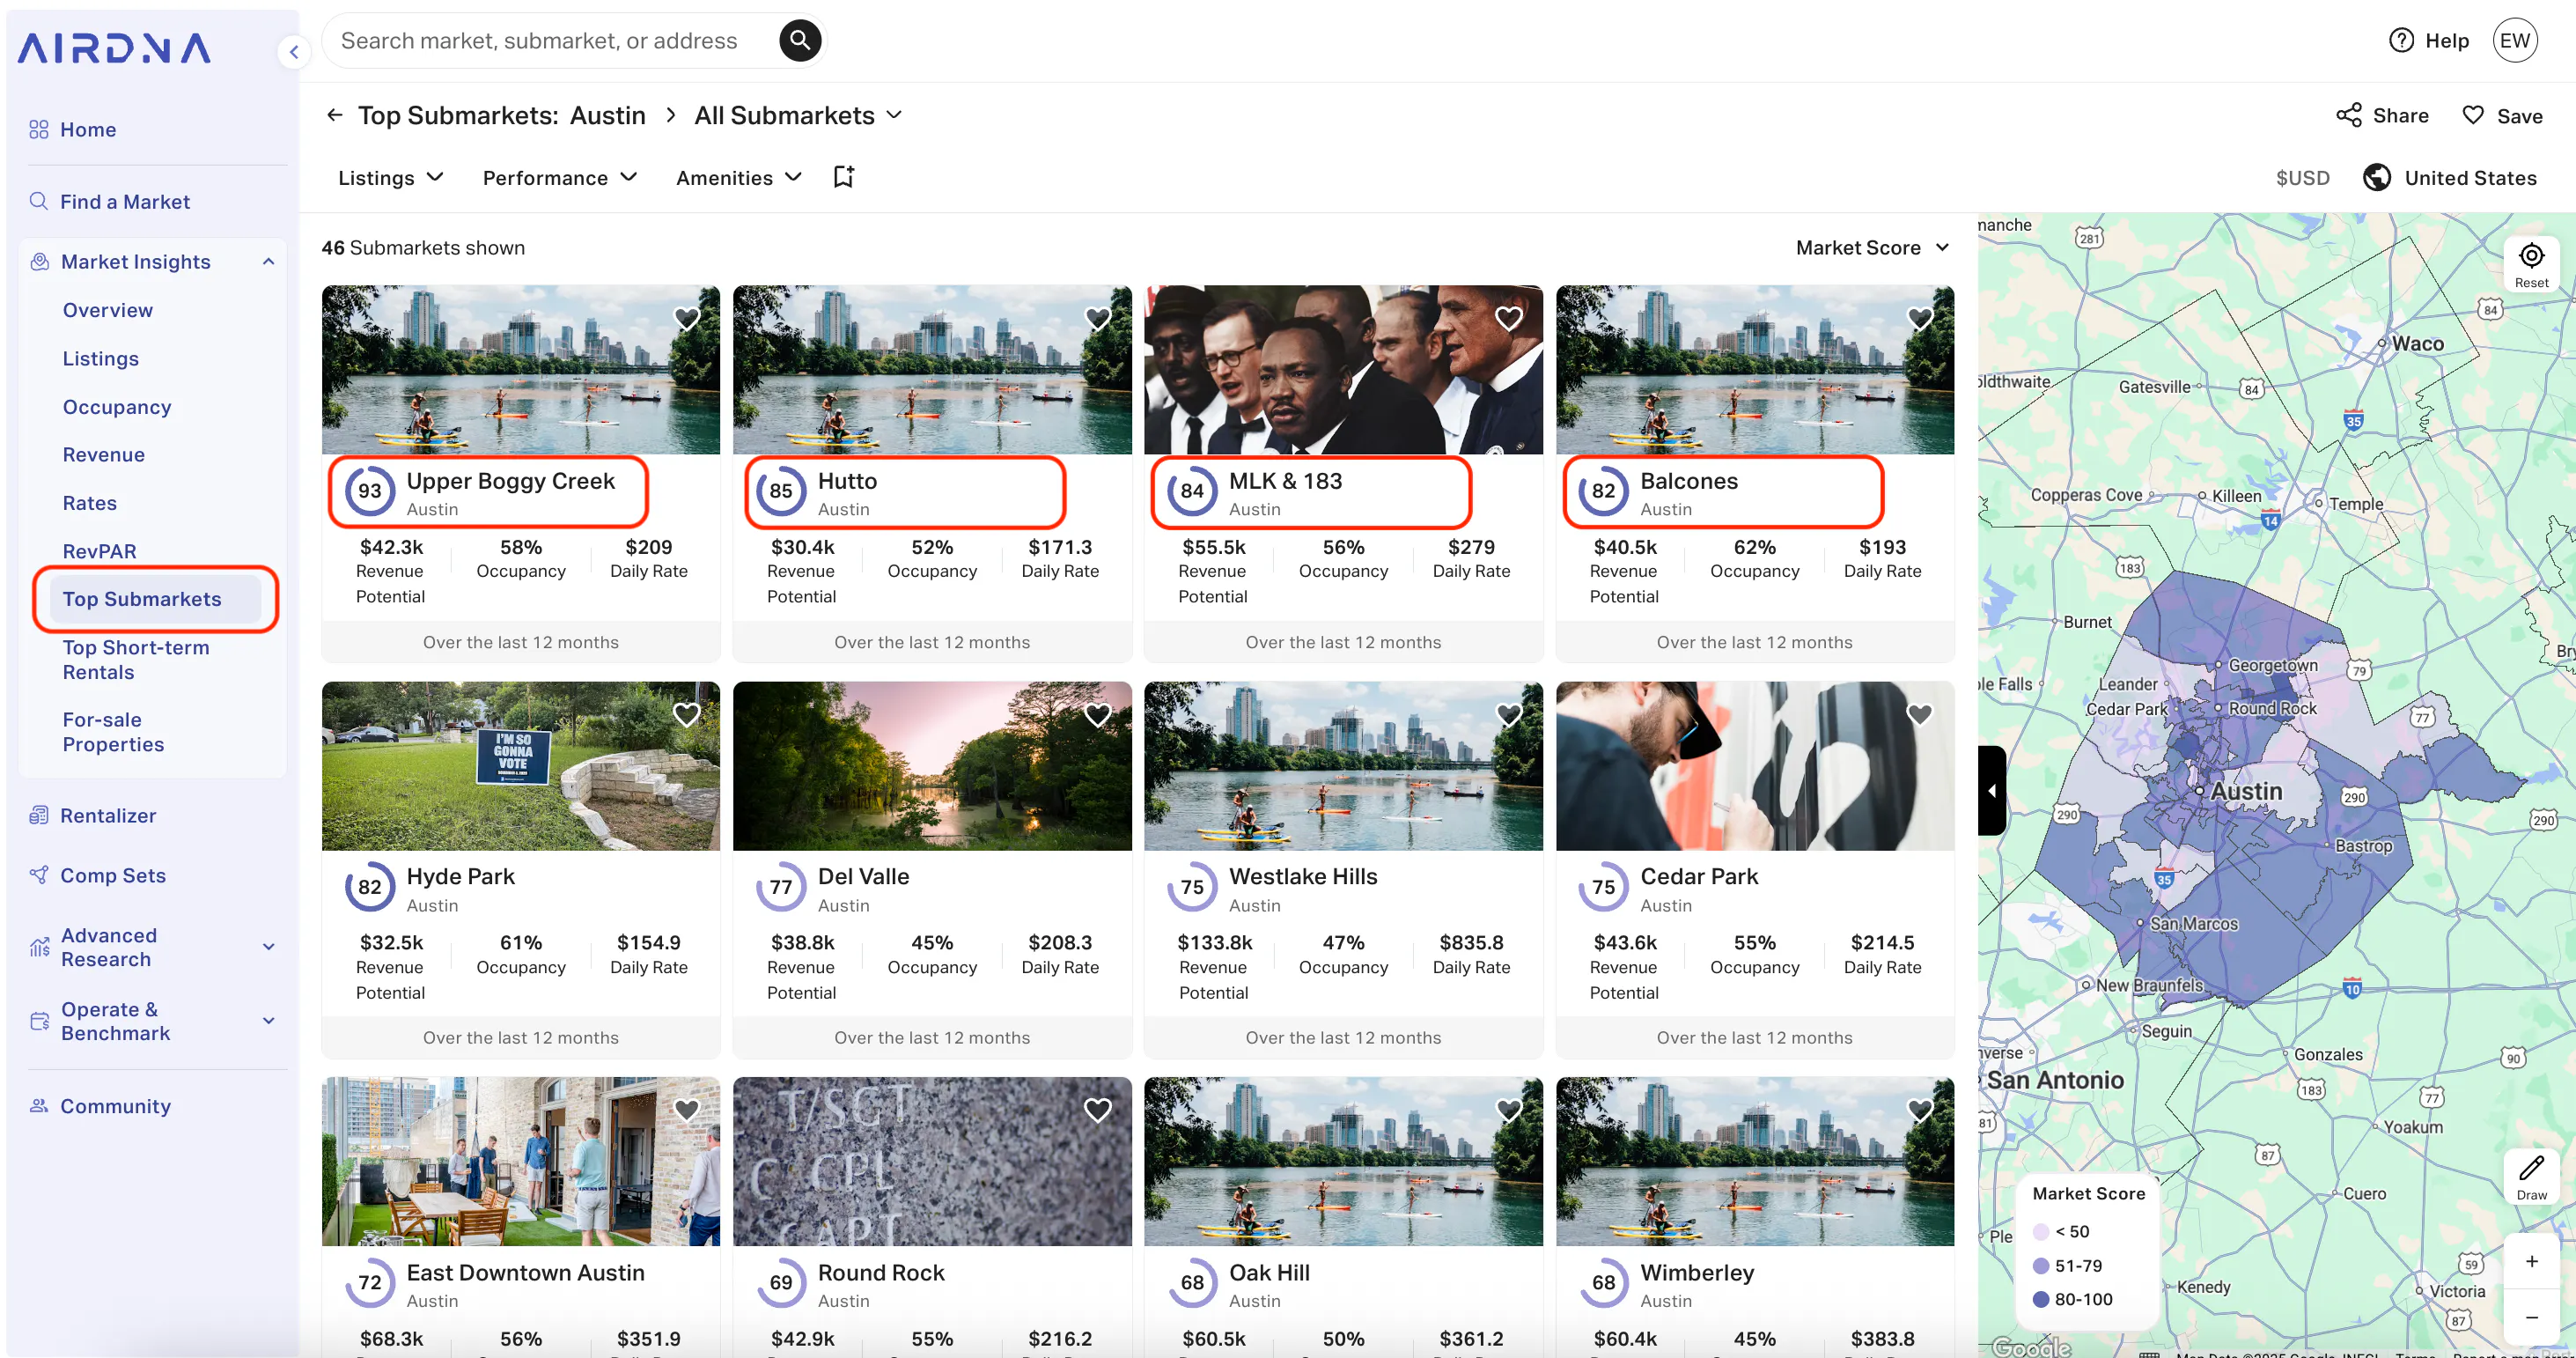
However, if you take a look at Austin’s 46 submarkets (“Top Submarkets” on the left nav bar), you’ll quickly find that there are many high-performing neighborhoods within the city:
- Upper Boggy Creek: 93 Market Score
- Hutto: 85
- MLK & 183: 84
- Balcones: 82
The map on the right provides you with a quick gut check on where short-term rentals are doing better or worse in Austin. The darker the purple, the higher the Market Score.

2. Understand short-term rental regulations
Regulatory requirements and restrictions can significantly affect your investment. To understand the short-term rental regulations and zoning laws in your target market, research local government websites and consult with local authorities.
Review any licensing requirements, occupancy limits, noise ordinances, and tax obligations imposed on vacation rental properties. Consider hiring a legal expert or consulting with a STR-friendly real estate professional familiar with local regulations to make sure you’re compliant and that you avoid potential legal issues.
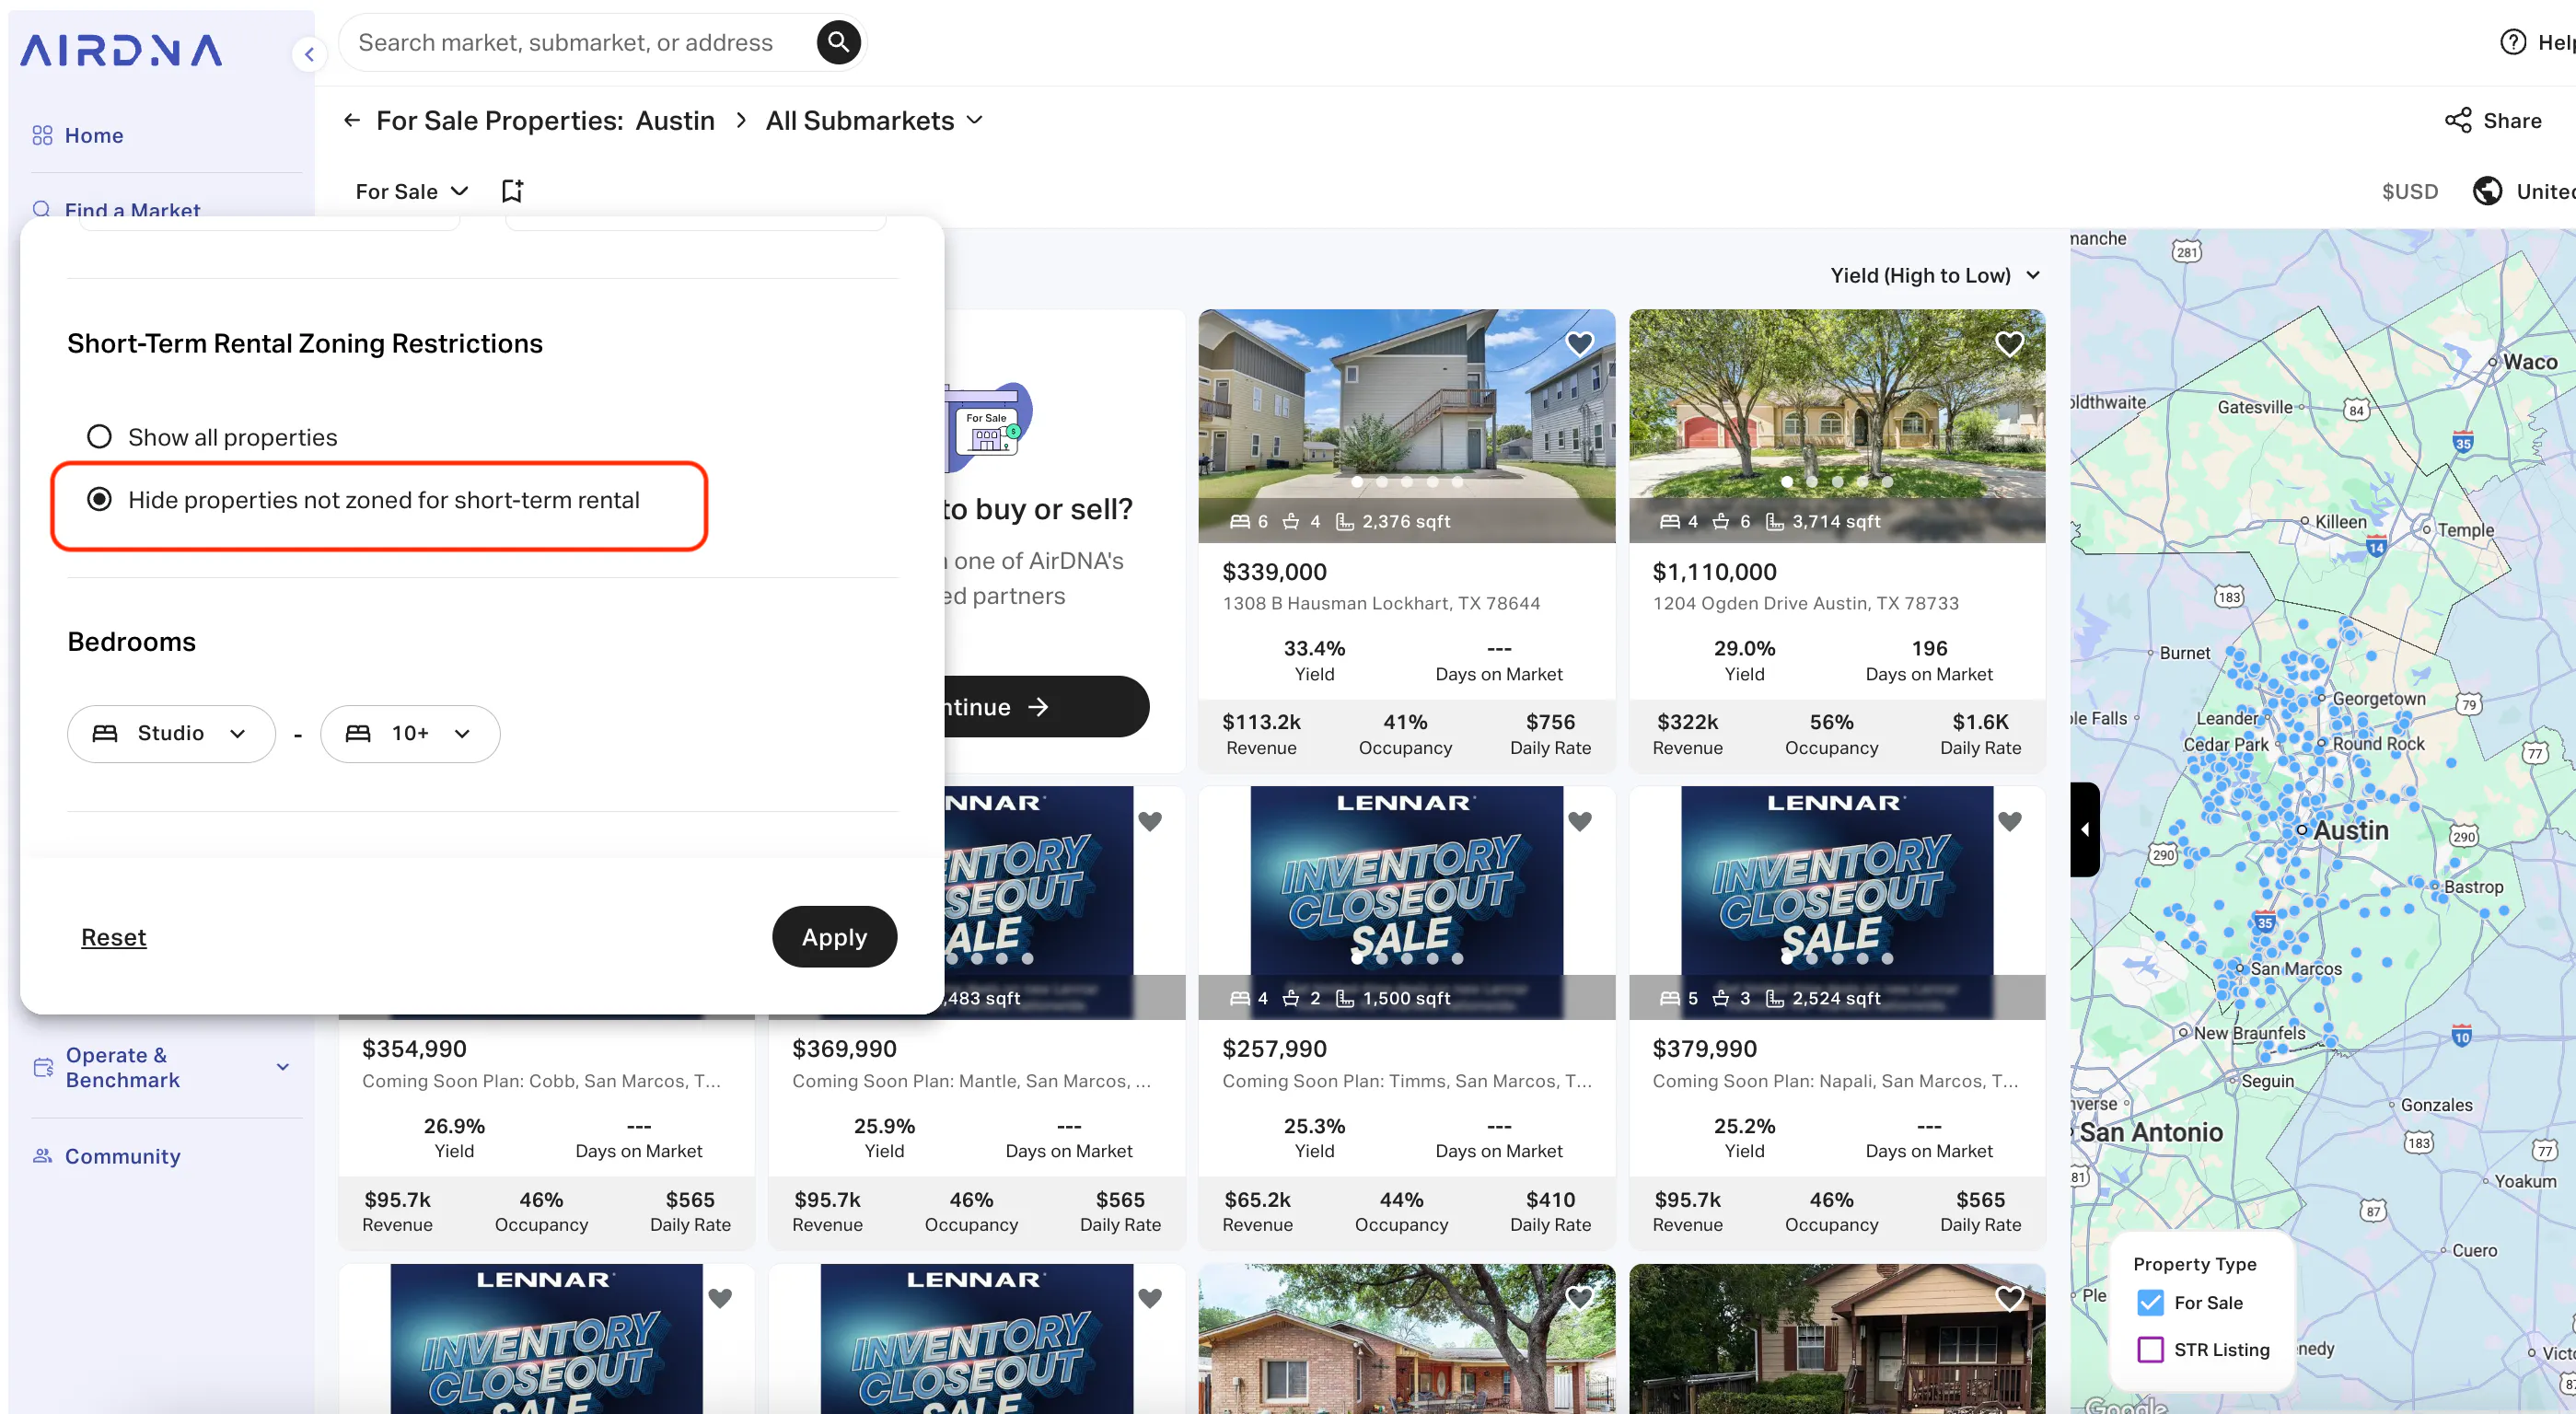
Keep in mind that regulations on vacation rentals can differ within a single market or submarket. Airbnbs might be allowed in commercial zones but not in residential areas, for example. When you’re starting to look for properties as a short-term rental investment, AirDNA’s for-sale property feature can help with this. We have a special zoning restriction filter that allows you to hide properties that are not zoned for short-term rentals from the search results. That way, you don’t get excited about a real estate listing that you later find can’t be used for Airbnb.
3. Assess short-term rental demand
Understanding demand patterns helps in optimizing nightly rates and marketing strategies. Start by analyzing historical occupancy data and booking trends for vacation home rentals in your target market to understand demand patterns. You can do this with AirDNA. We’ll stick with our Austin example and dig into the data on the Upper Boggy Creek submarket.
The Overview page of Market Insights gives you a quick snapshot of demand. We can see that the average occupancy rate is 58% in Upper Boggy Creek and, according to the annual line graph below it, demand peaks in March. TheRental Demand subcategory of the Market Score is also 72, which is strong.

If we move down to Occupancy in the lefthand navigation menu, we start to get a more nuanced picture of demand, including:
- High and low occupancy averages (68% in March, 53% in December)
- Average length of stay (4.2 days)
- How far in advance guests are booking, or booking lead time (49 days)
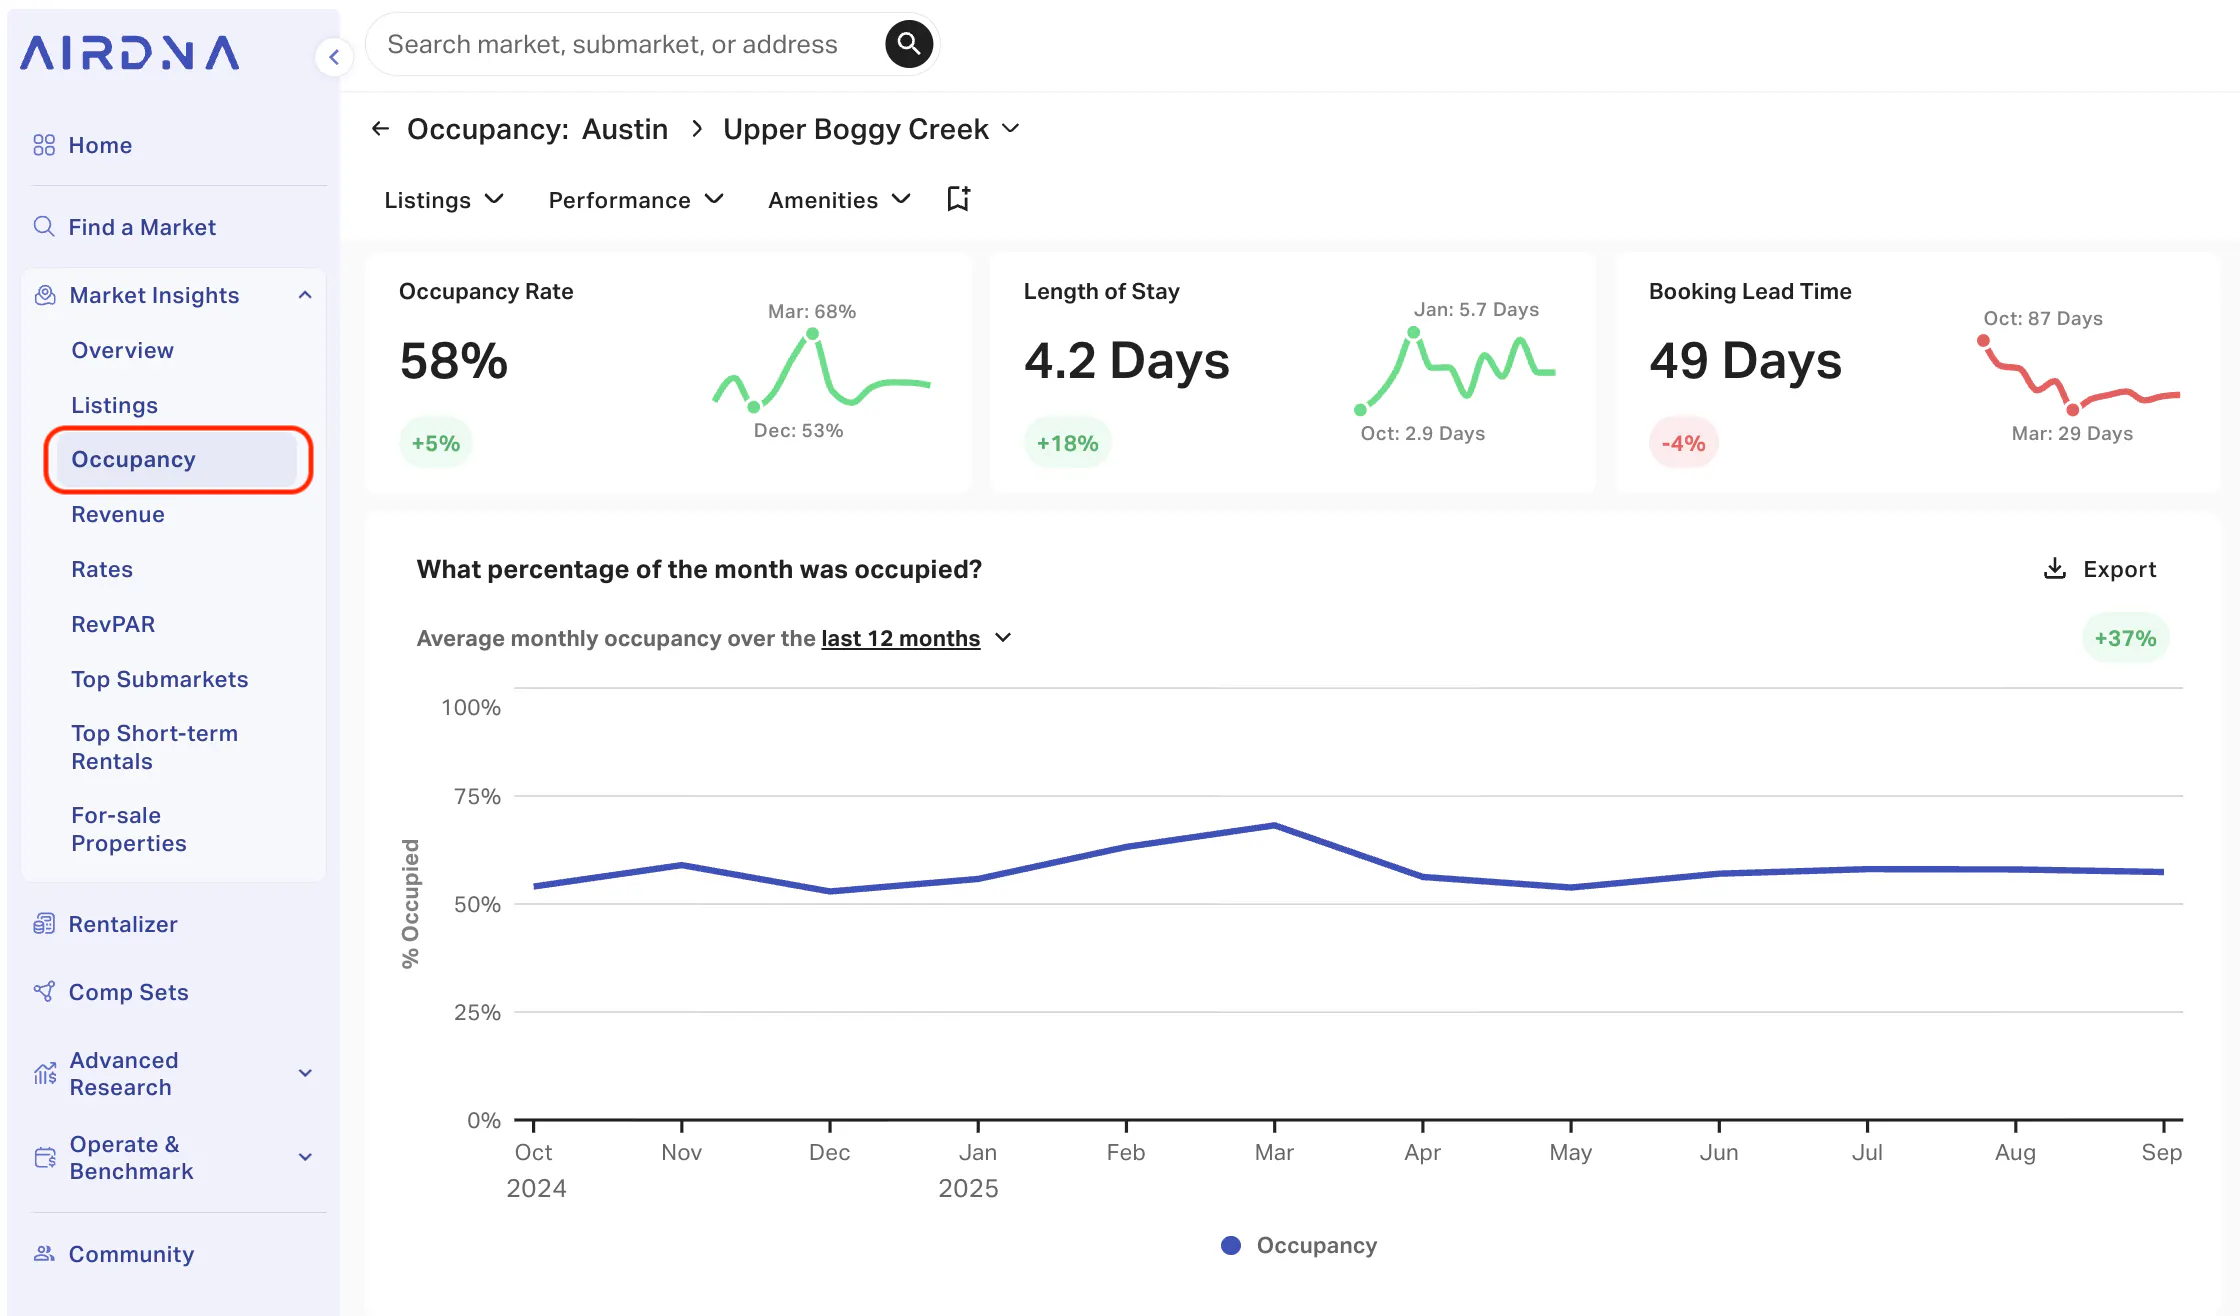
Scroll further, and you’ll see graphs depicting how demand has behaved over time and according to property size.
Use this data to identify high and low seasons, major events, and festivals that attract visitors to the area. Start to understand what drives demand for short-term accommodations in your market of interest.
4. Evaluate short-term rental supply
Survey the existing supply of vacation rental properties in the area. This information can be found on the Listings tab of Market Insights. Here, you’ll find:
- The number of active short-term rentals in the area
- Share of short-term rentals on Airbnb, Vrbo, or both
- Listings by bedroom count
- Listings by the number of days they're available per year
- Growth in supply over time
- Share of listings by their cancellation policies
- Share of listings by their minimum stay policies

Looking at Upper Boggy Creek, we can see from this data that:
- The majority of short-term rentals in this area are listed on Airbnb (60%).
- 2-bedroom properties are the most common (37% of active vacation rentals in the area).
- Only a small minority of properties are available full time (16% are bookable for 271-365 nights).
- Short-term rentals in the area are increasing over time and inventory tends to spike in the fall and spring months.
Look for gaps or opportunities in the market where your property can offer unique value or fill a niche demand (such as demand for 4-bedroom properties, which simply don’t exist in Upper Boggy Creek).
Many investors wonder about the 80/20 rule for Airbnb—where 20% of properties generate 80% of the revenue—and understanding this principle can help you position your investment to be in that top-performing segment. This step is essential, according to Coon, because demand isn't always shared across property types.
"In my area, Asheville, North Carolina, for instance, we are seeing that the best properties—the best designed with the best amenities—are the ones taking market share," Coon says. "The delta between what a good or bad listing looks like increases every day. For a successful short-term rental market analysis, you need to examine not just the city, but the specific neighborhood performance metrics."
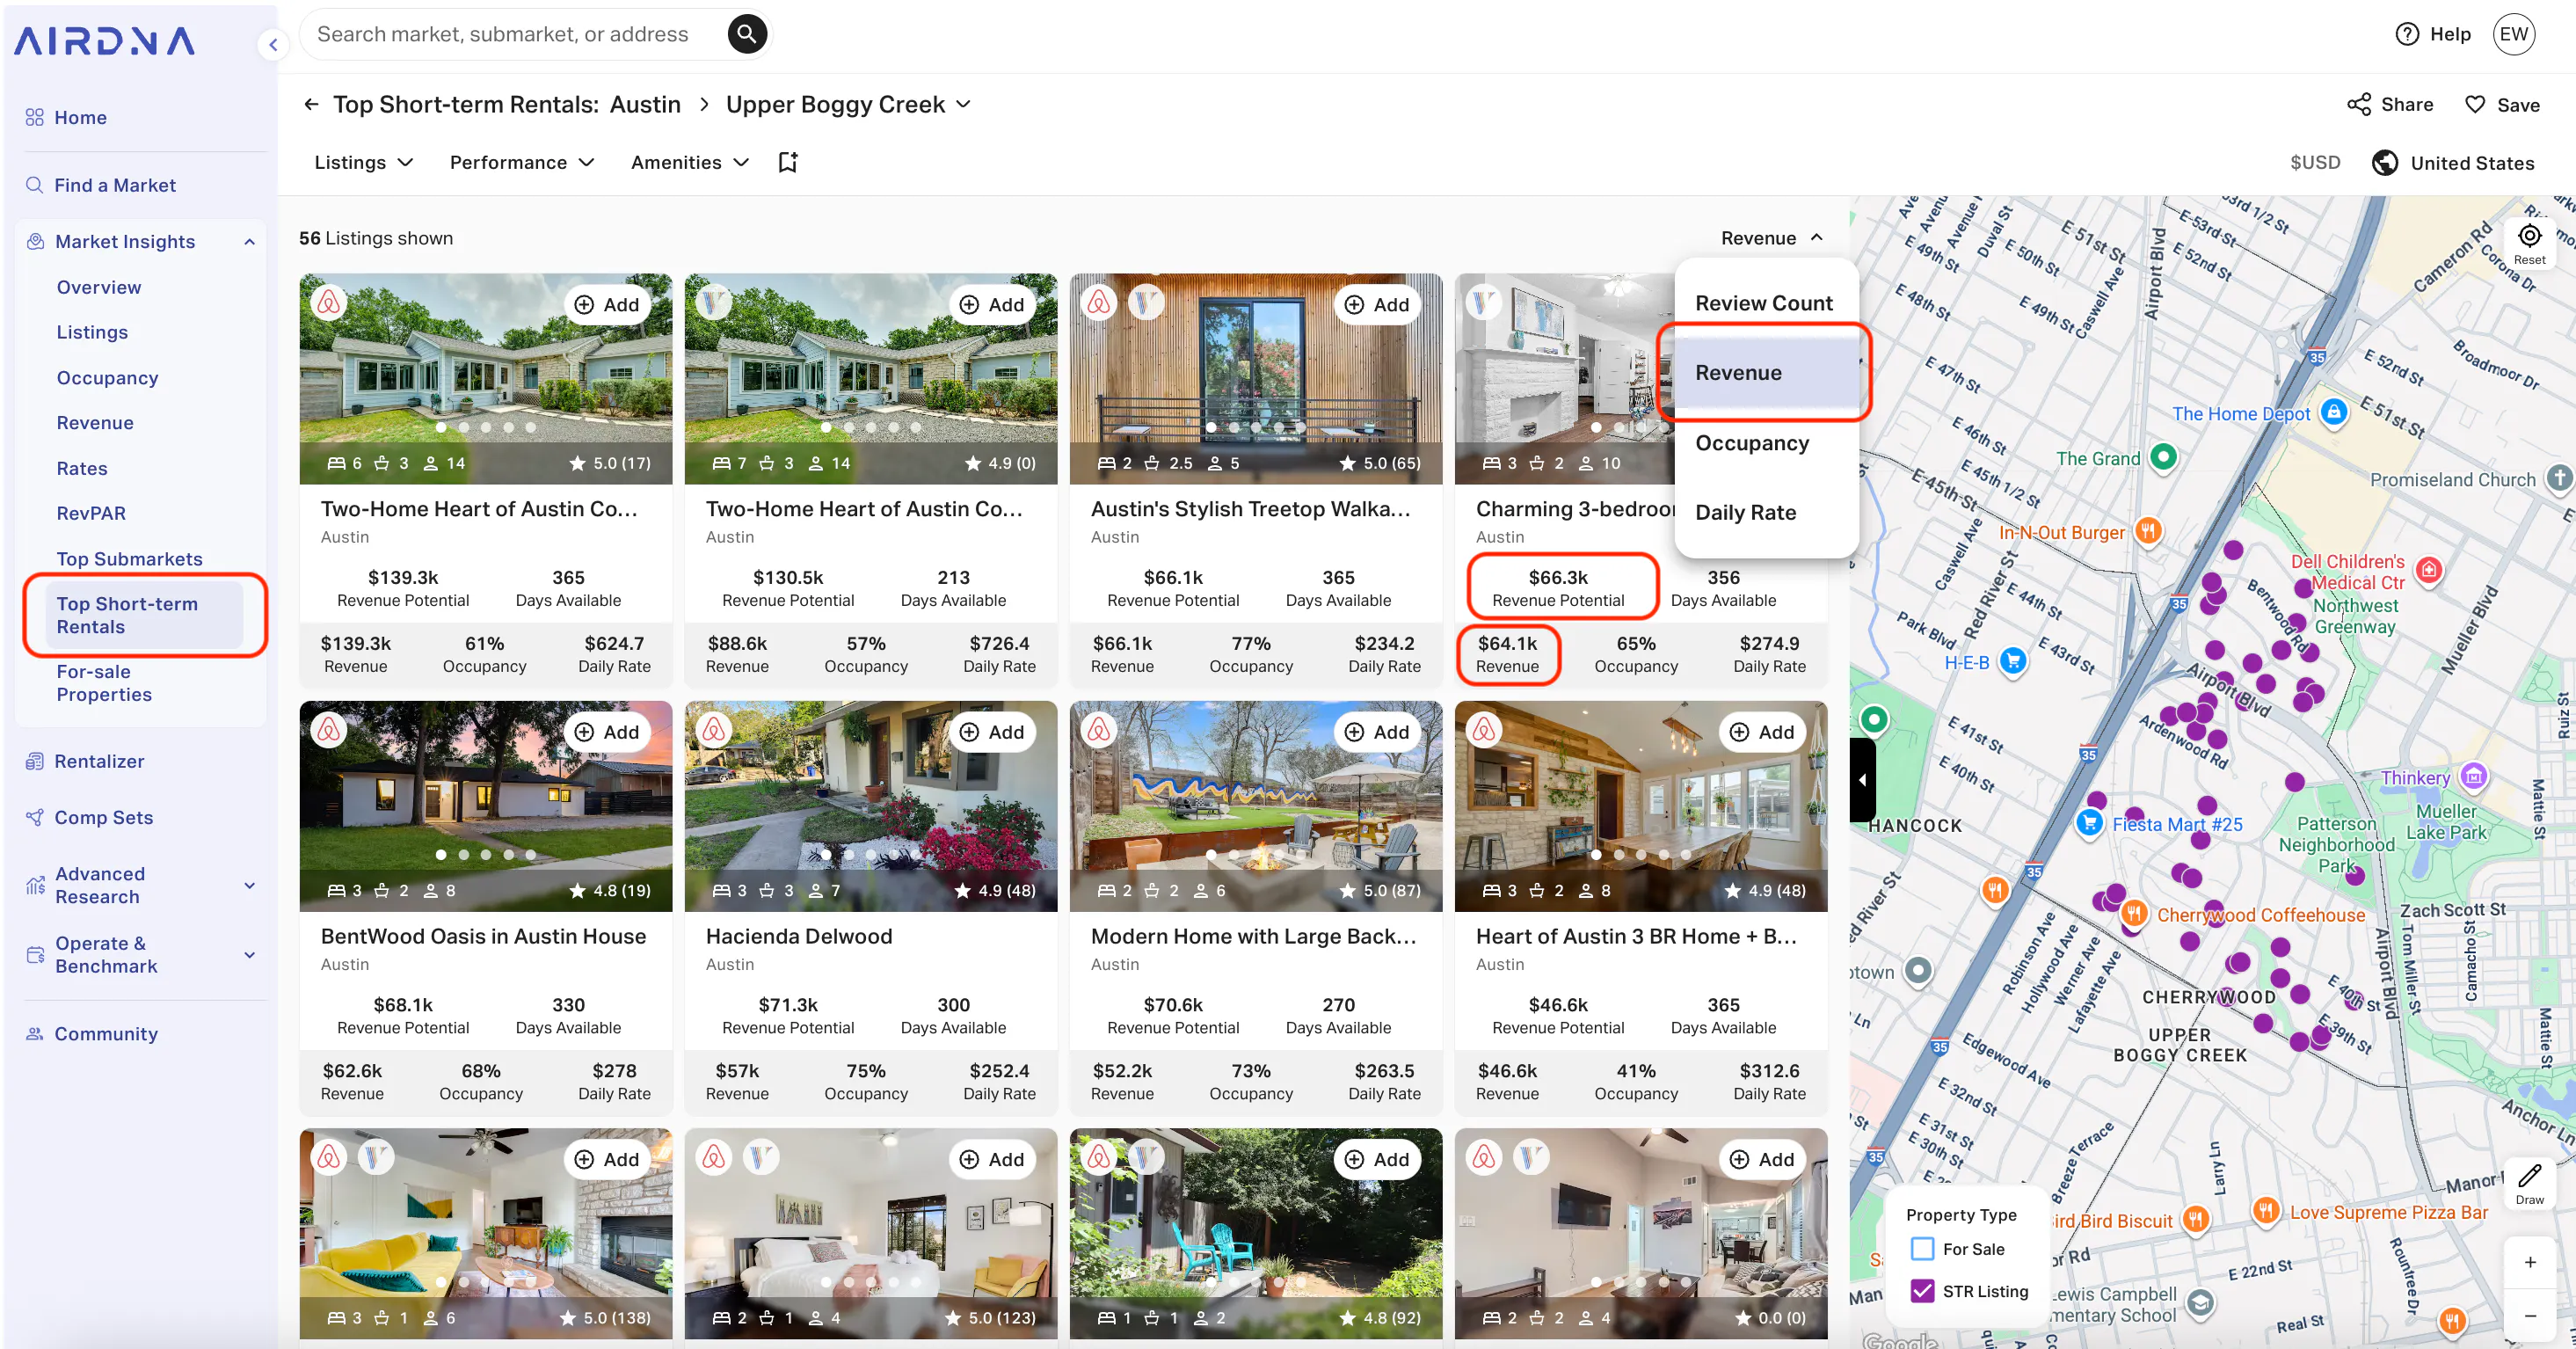
The Top Short-term Rentals tab of Market Insights lets you explore the individual properties that make up the competitive landscape in your market. Here, you can see how much money each active short-term rental is making and how that compares to their revenue potential. Revenue potential assumes year-round availability, so part-time vacation rentals often fall short of what they could earn. You can use the Days Available filter under the Performance filter dropdown to see how earnings change based on availability.
Note that STRs are organized in descending order by Revenue as a default. Short-term rentals whose earnings match or exceed their revenue potential are optimized for success and can provide you with valuable insight on what it takes to be competitive.
5. Consider seasonality
Research seasonal demand trends and fluctuations in your target market to understand when demand for short-term rental properties is highest.
“Seasonality in short-term vacation rentals refers to the variation in demand and pricing of rental properties based on the time of year and season,” Coon says. “Different times of the year may attract different types of guests and influence the popularity of certain destinations, impacting the demand for accommodations.”
Identify peak travel seasons, holidays, and special events that attract visitors and drive demand for accommodations. “That’s when most people will reserve your STR,” Coon says. Knowing when demand is peaking allows you to adjust your pricing, availability, and marketing strategies to capitalize on these periods and maximize rental income.
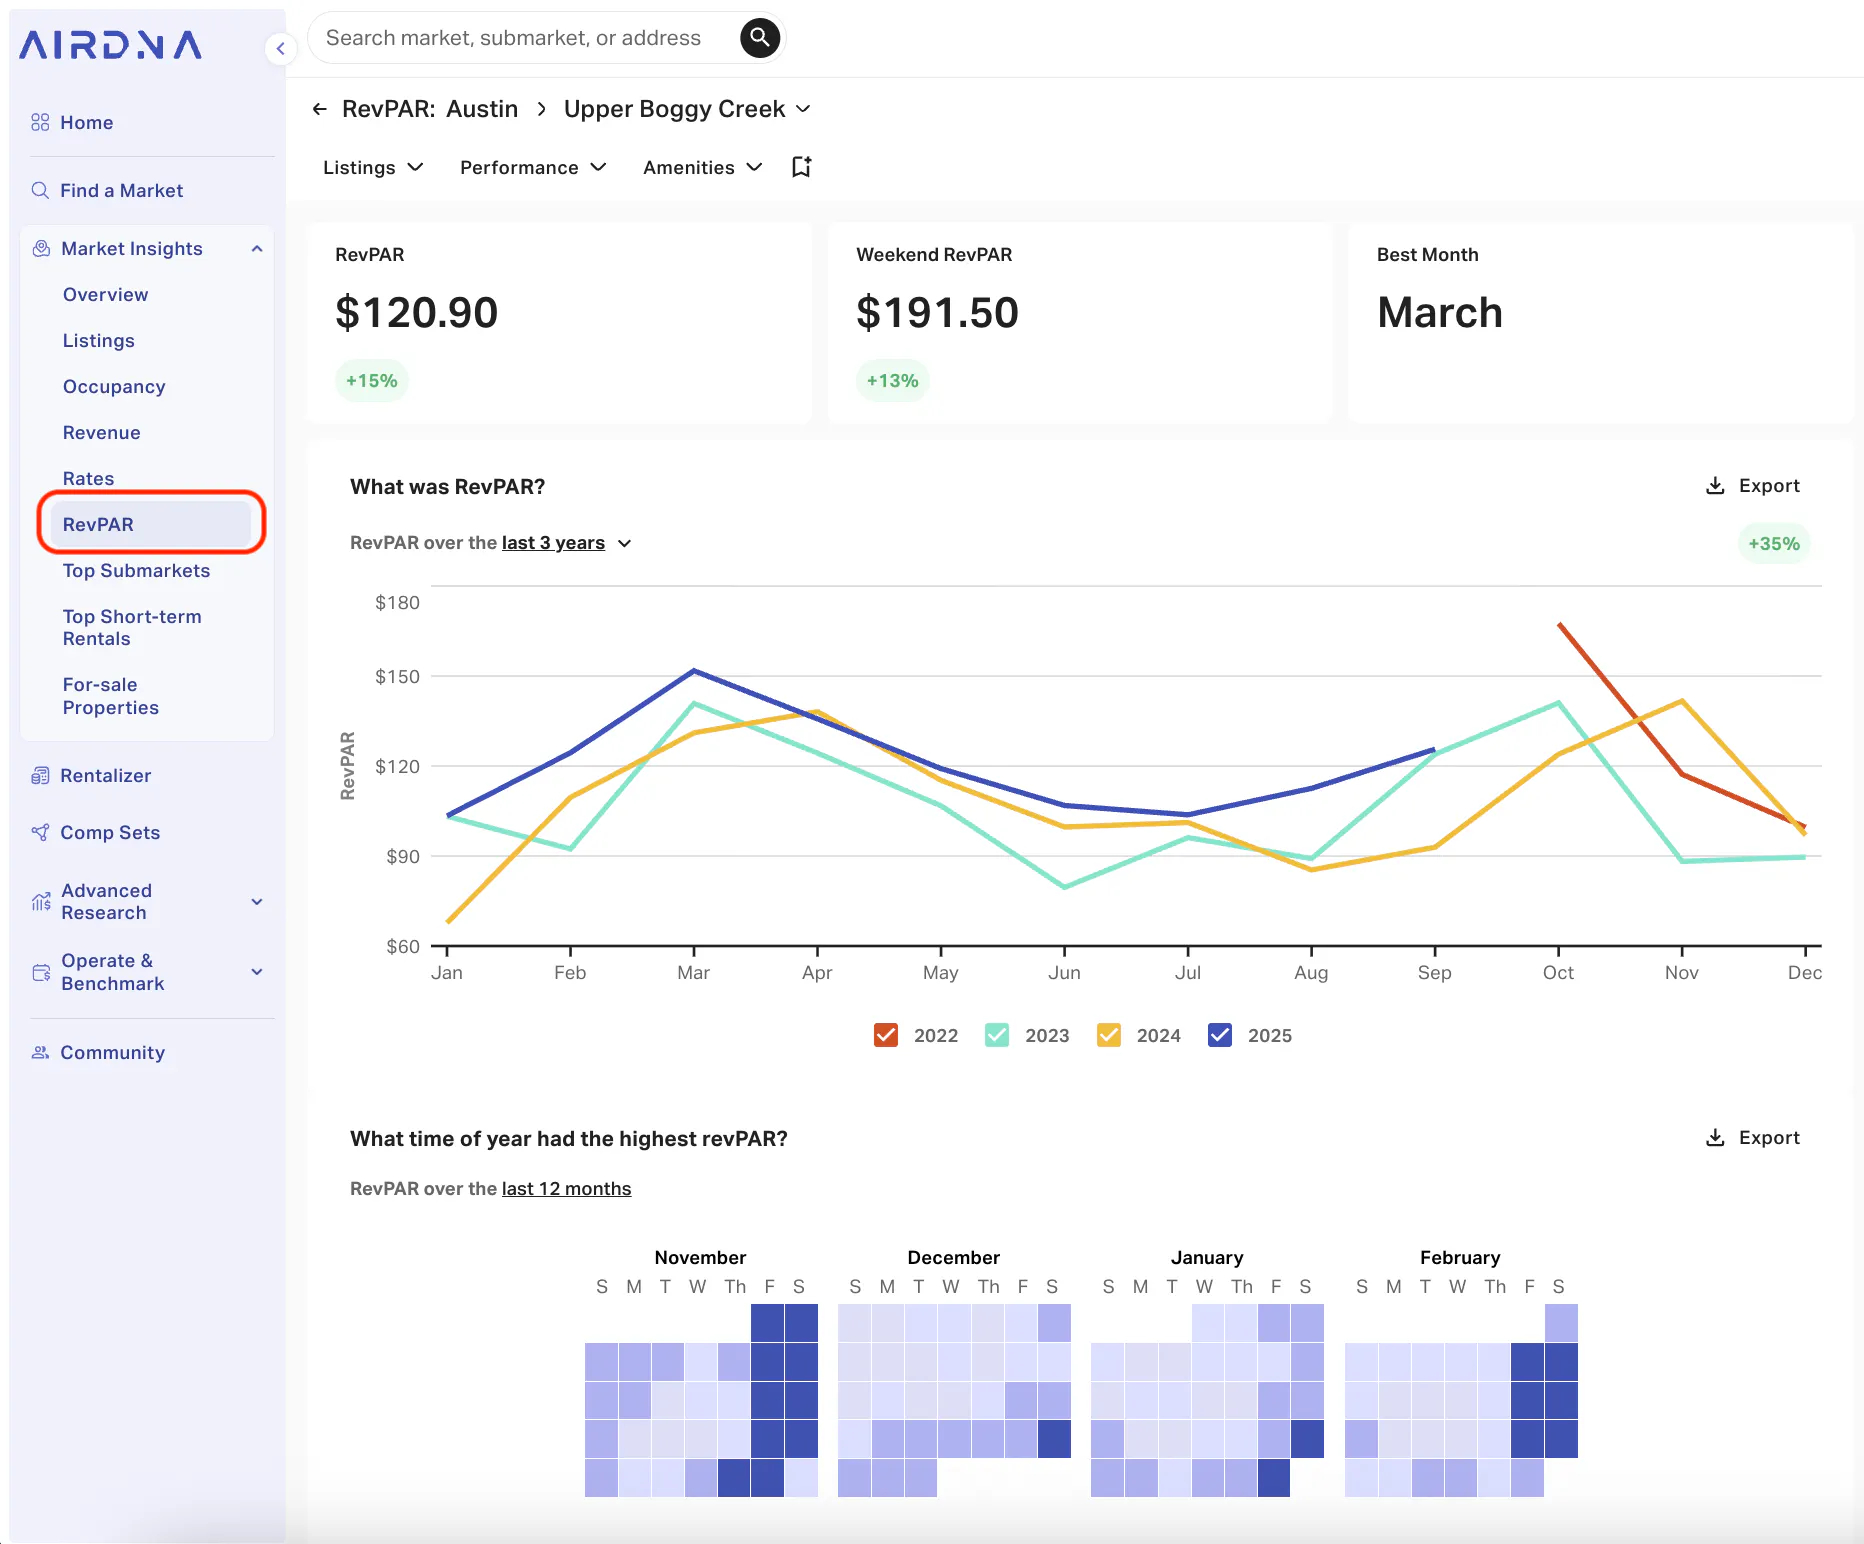
The RevPAR tab of Market Insights can provide helpful insights. Revenue per available rental captures your nightly earnings if you take both your average daily rate or ADR (what you charge guests per night) and occupancy into account.
In Upper Boggy Creek, we can see that the average RevPAR has increased year-over-year between 2023 and 2025, which is a positive sign of a healthy and growing market. RevPAR clearly peaks in March and October and on weekends, according to the heat map by month. With a little additional sleuthing online, you’d quickly realize that the Austin City Limits music festival held annually in October is one reason we see such strong fall performance.
6. Identify the target guest
Conduct market research to identify your target guest demographic, including age, income level, interests, and travel preferences. Some of the best intel is hiding in plain sight on Facebook groups and Reddit threads.
Start by joining short-term rental hosting groups on Facebook specific to your target market. Search for groups like "[Your City] Airbnb Hosts" or "[Your Region] Vacation Rental Owners." Hosts often discuss what guest types book most frequently, which amenities actually move the needle, and what travelers in the area are really looking for. Pay attention to recurring questions and complaints. They'll reveal gaps in the market you can fill.
Reddit is equally valuable but often overlooked. Subreddits like r/AirBnB, r/VacationRentals, and location-specific travel subreddits (think r/VisitingAustin or r/NYCTravel) give you unfiltered access to what travelers actually want. Browse through posts where people ask for accommodation recommendations in your target area. What are they prioritizing? Pet-friendly spaces? Walking distance to downtown? A hot tub? These threads reveal authentic demand signals.
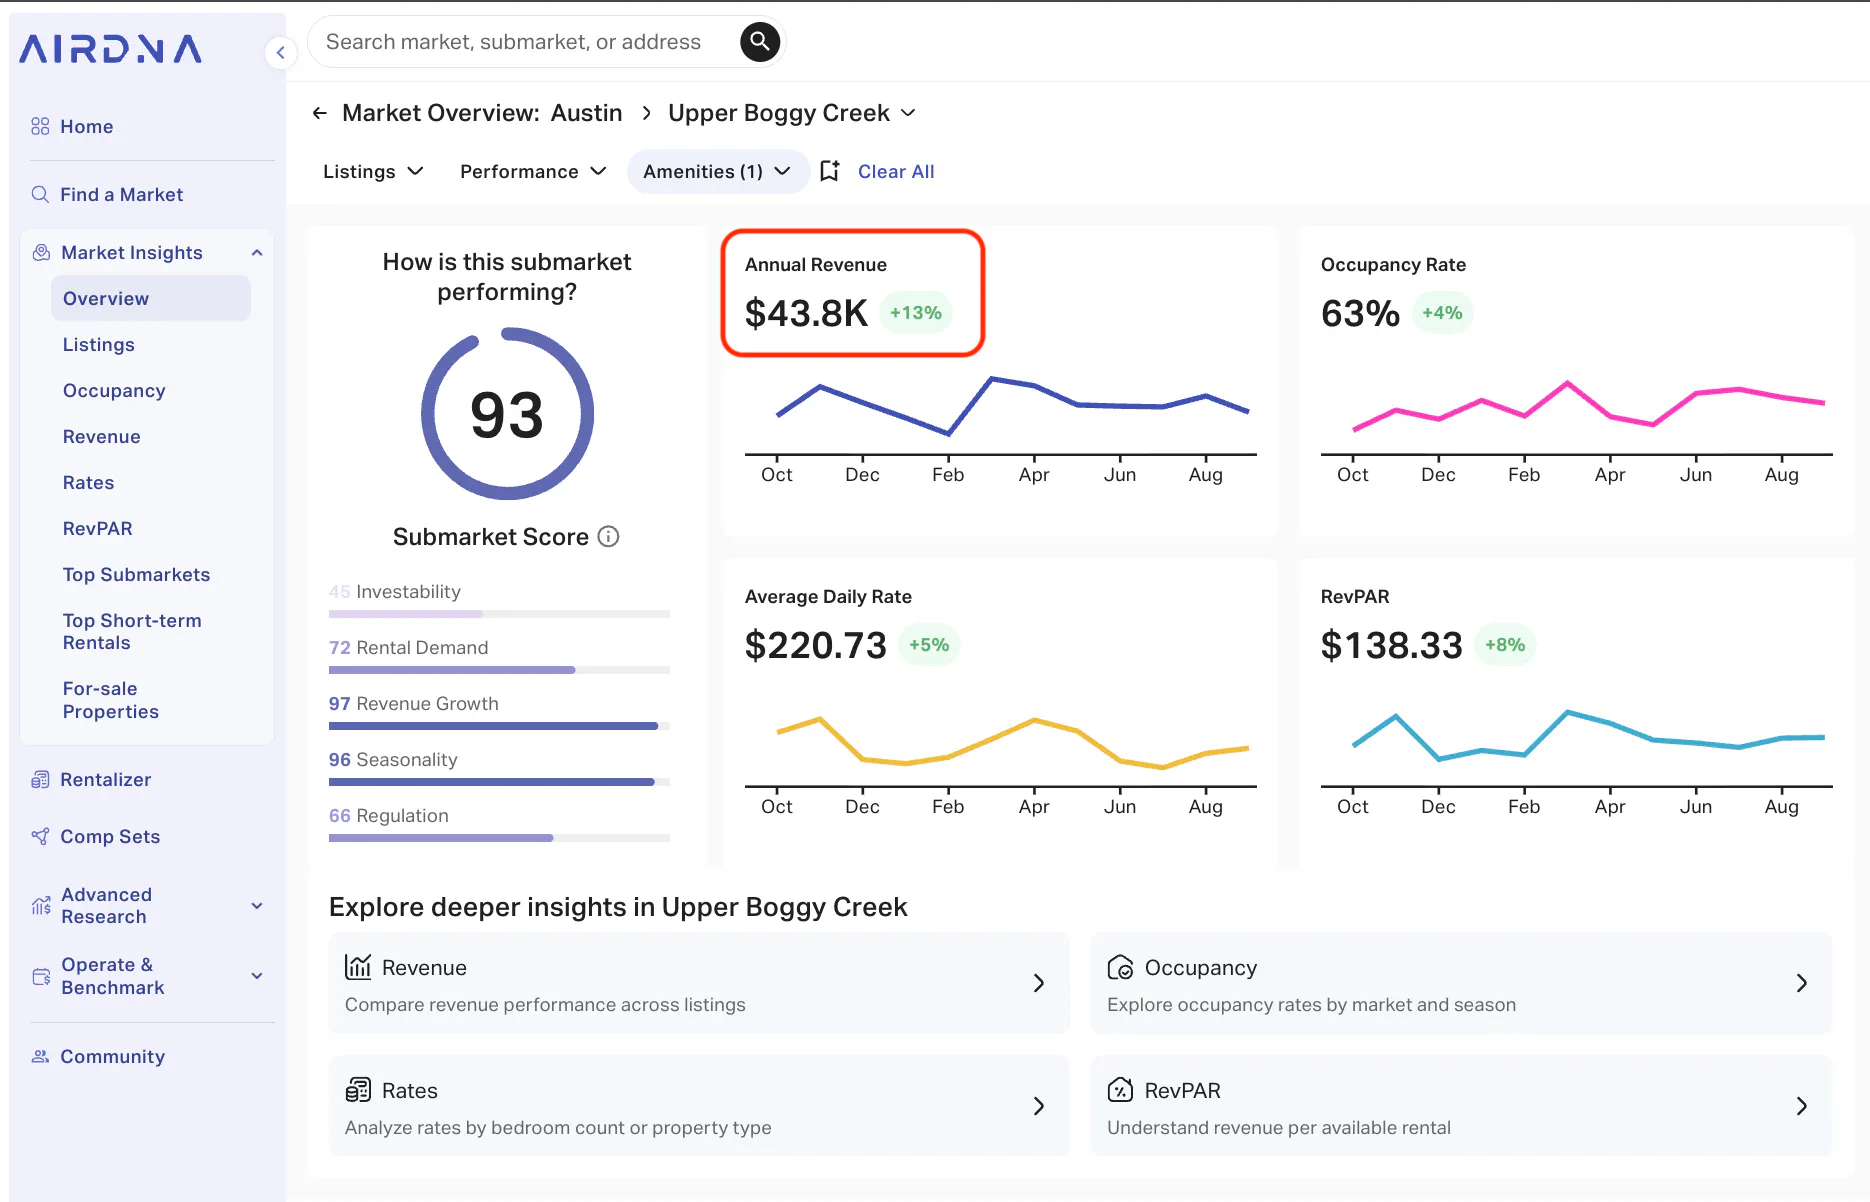
Strengthen this qualitative and anecdotal evidence with real data. See how short-term rental performance changes depending on the real estate type, size, price tier, amenities and more with AirDNA filters. In Upper Boggy Creek, for instance, short-term rentals without pets earn $28,400 per year, on average.
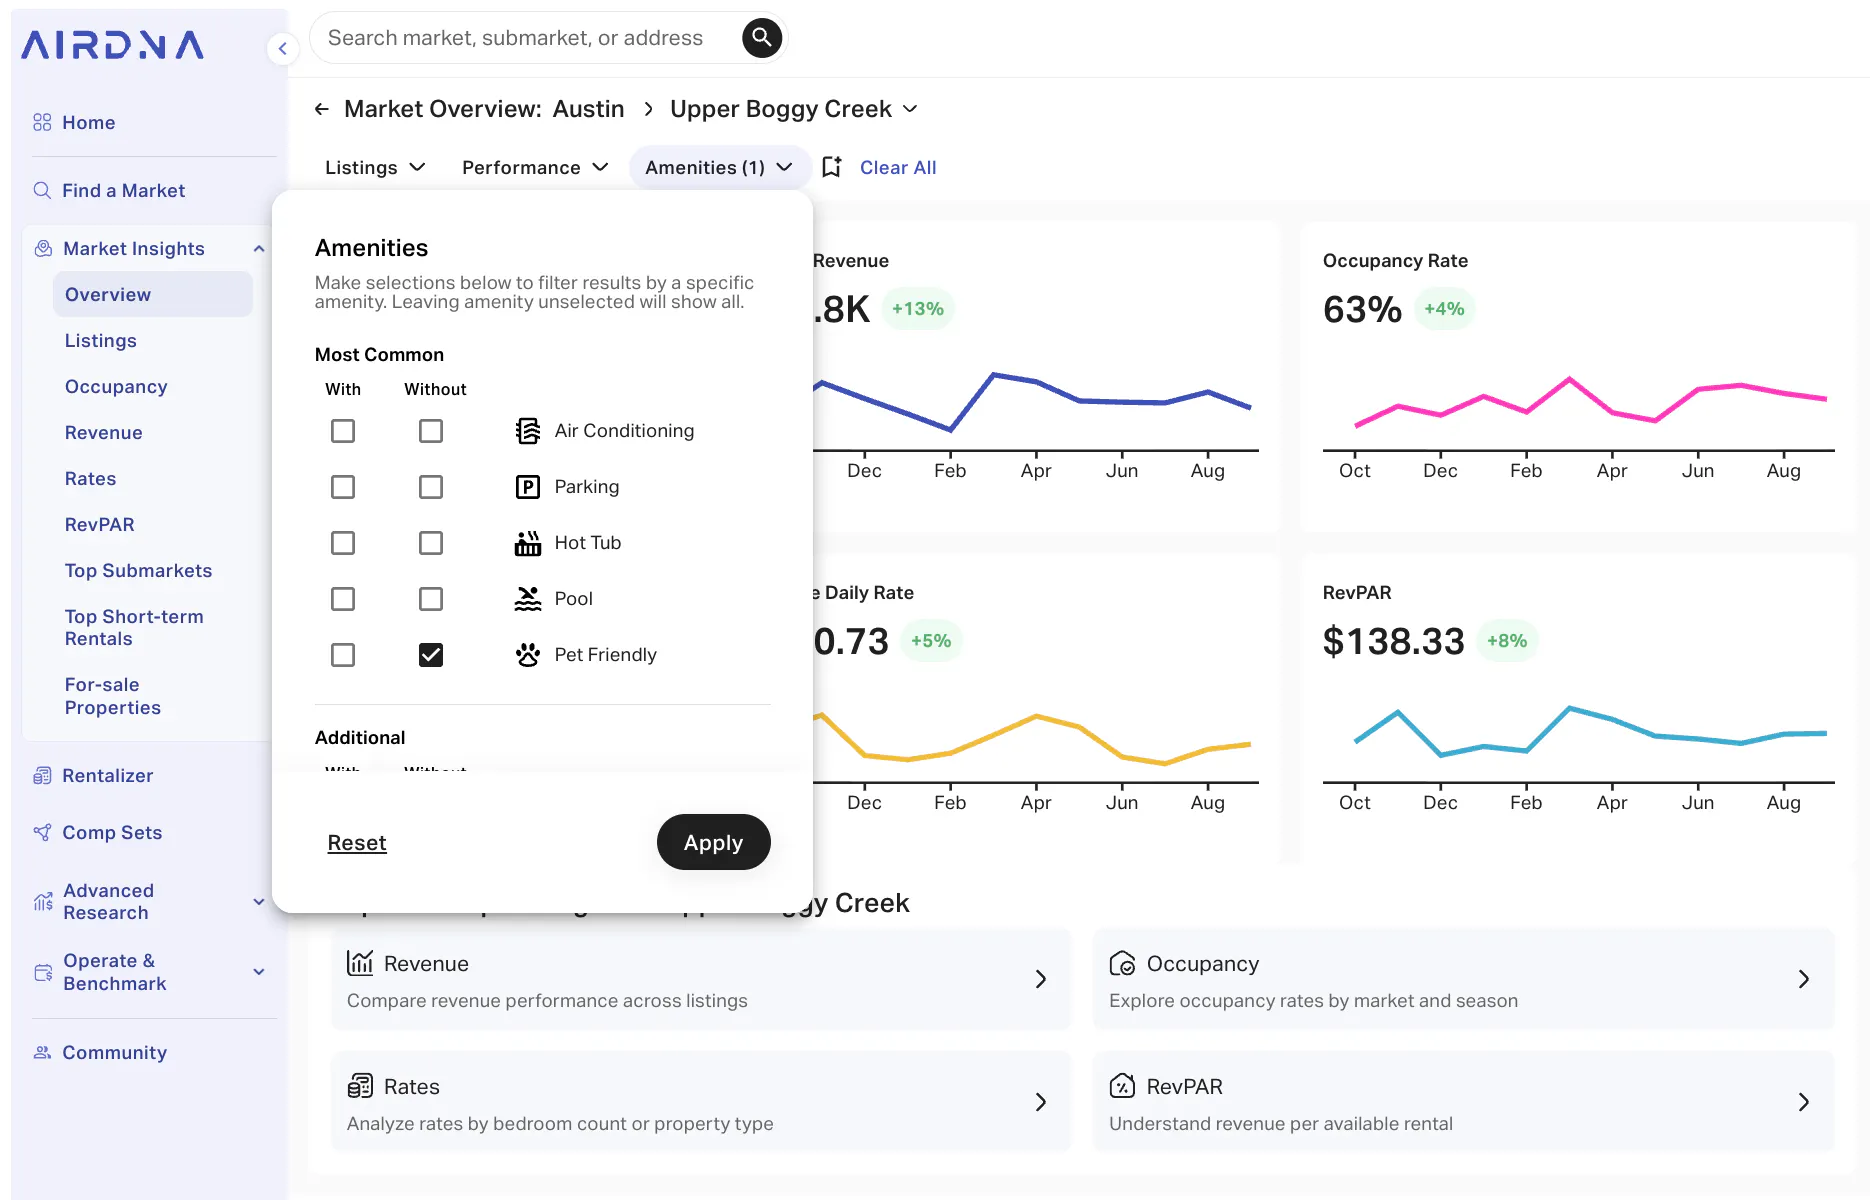
Pet-friendly vacation rentals, on the other hand, earn upwards of $43,800 annually. That’s 54% more revenue! Clearly, visitors to this area are willing to pay more to stay with their pets.
This type of data helps you to tailor your property offerings, amenities, and marketing messages to appeal to the desires and preferences of your target audience.
7. Determine the ideal property type
Consider the preferences and needs of your target audience when selecting the ideal property type for your short-term rental. Evaluate factors such as property size, layout, amenities, and unique features that appeal to your target demographic.
“Working with a short-term rental real estate agent who’s a local expert in what works the best in the area and who has information from past clients and hopefully is an investor themselves is a great place to start,” Coon says.
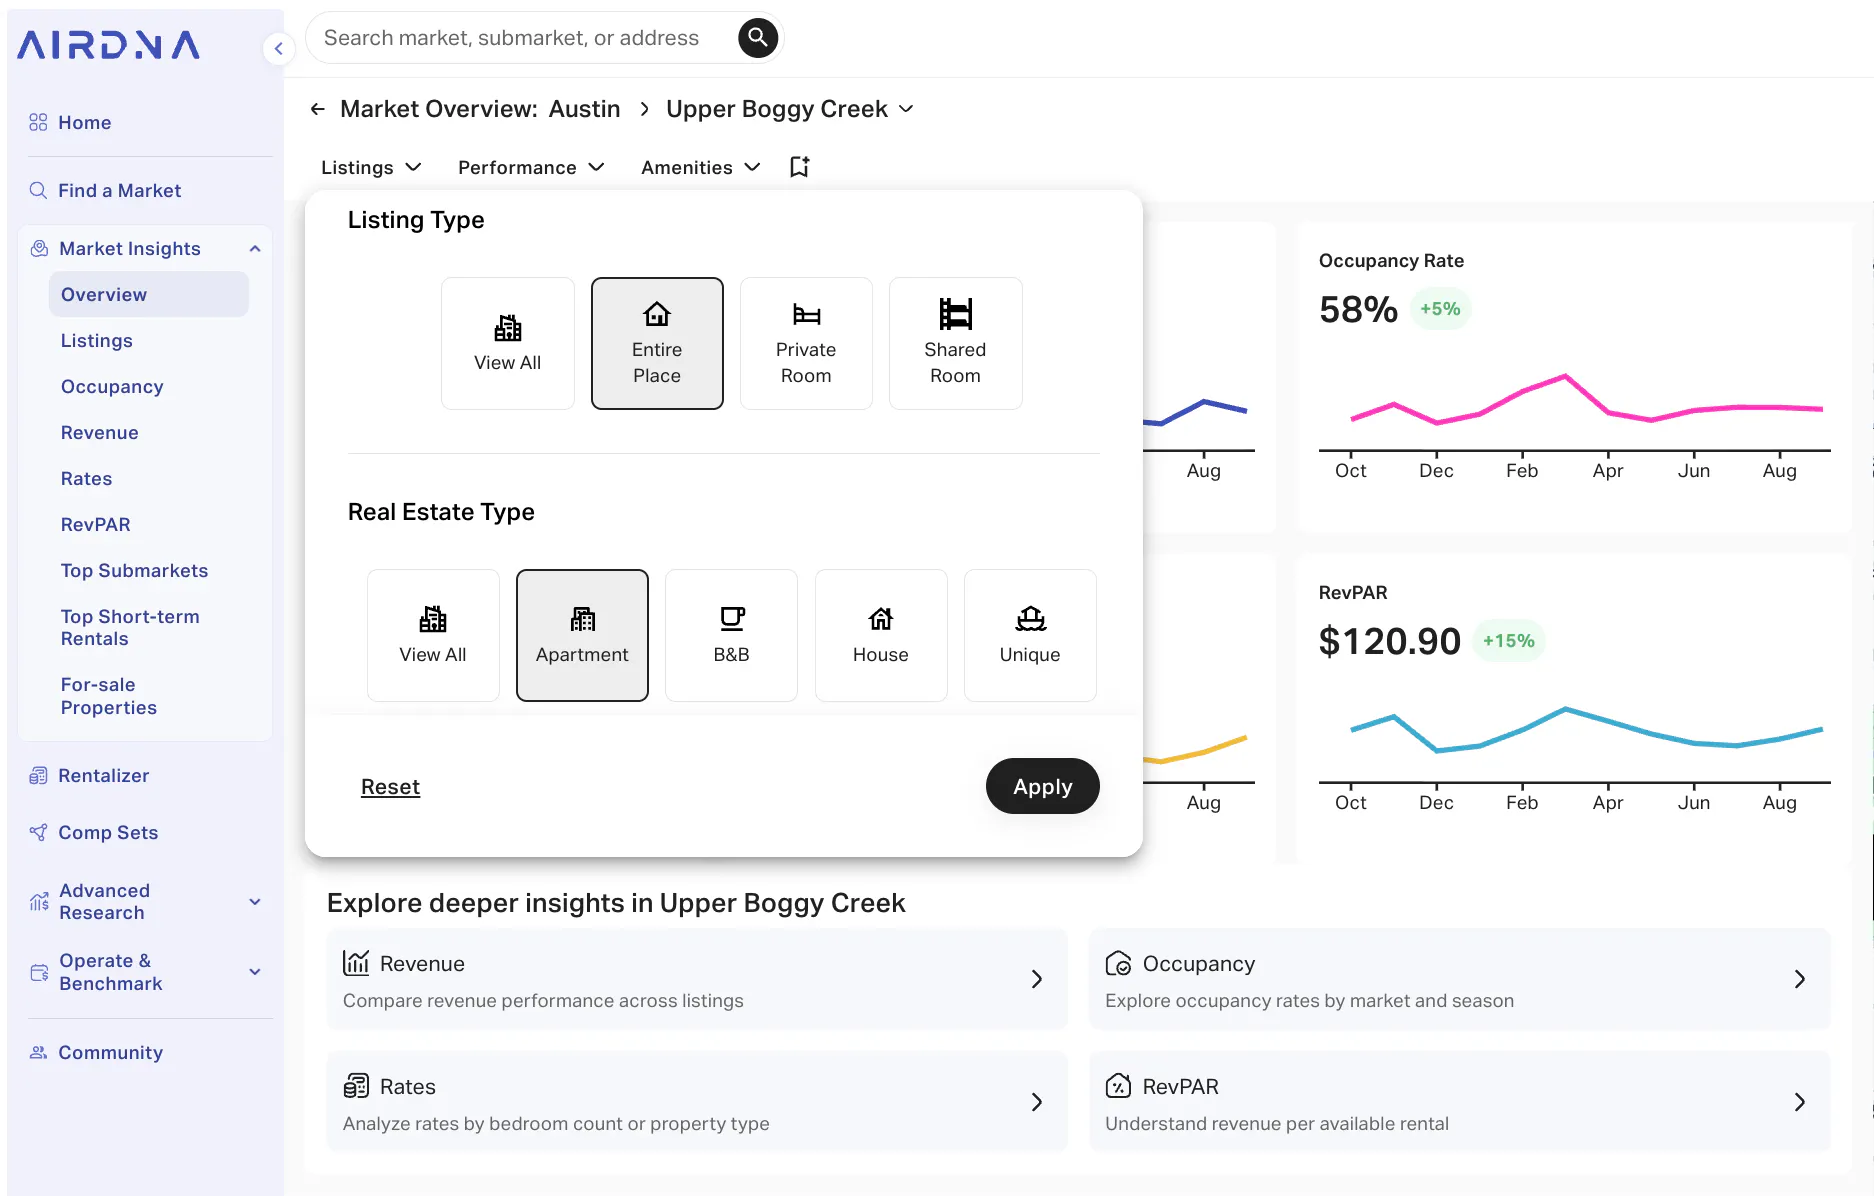
You can research market demand for different property types, such as single-family homes, condos, apartments, or vacation villas, using the Listing Type and Real Estate Type filters in AirDNA. This will help you to identify the option most likely to support your revenue goals.
Keep in mind that the ideal property type isn’t as simple as which rentals earn the most money. Naturally, ADRs for vacation rentals tend to go up along with bedroom count—but so do costs. You need to take into consideration the property value and the cost of furnishing a larger unit.
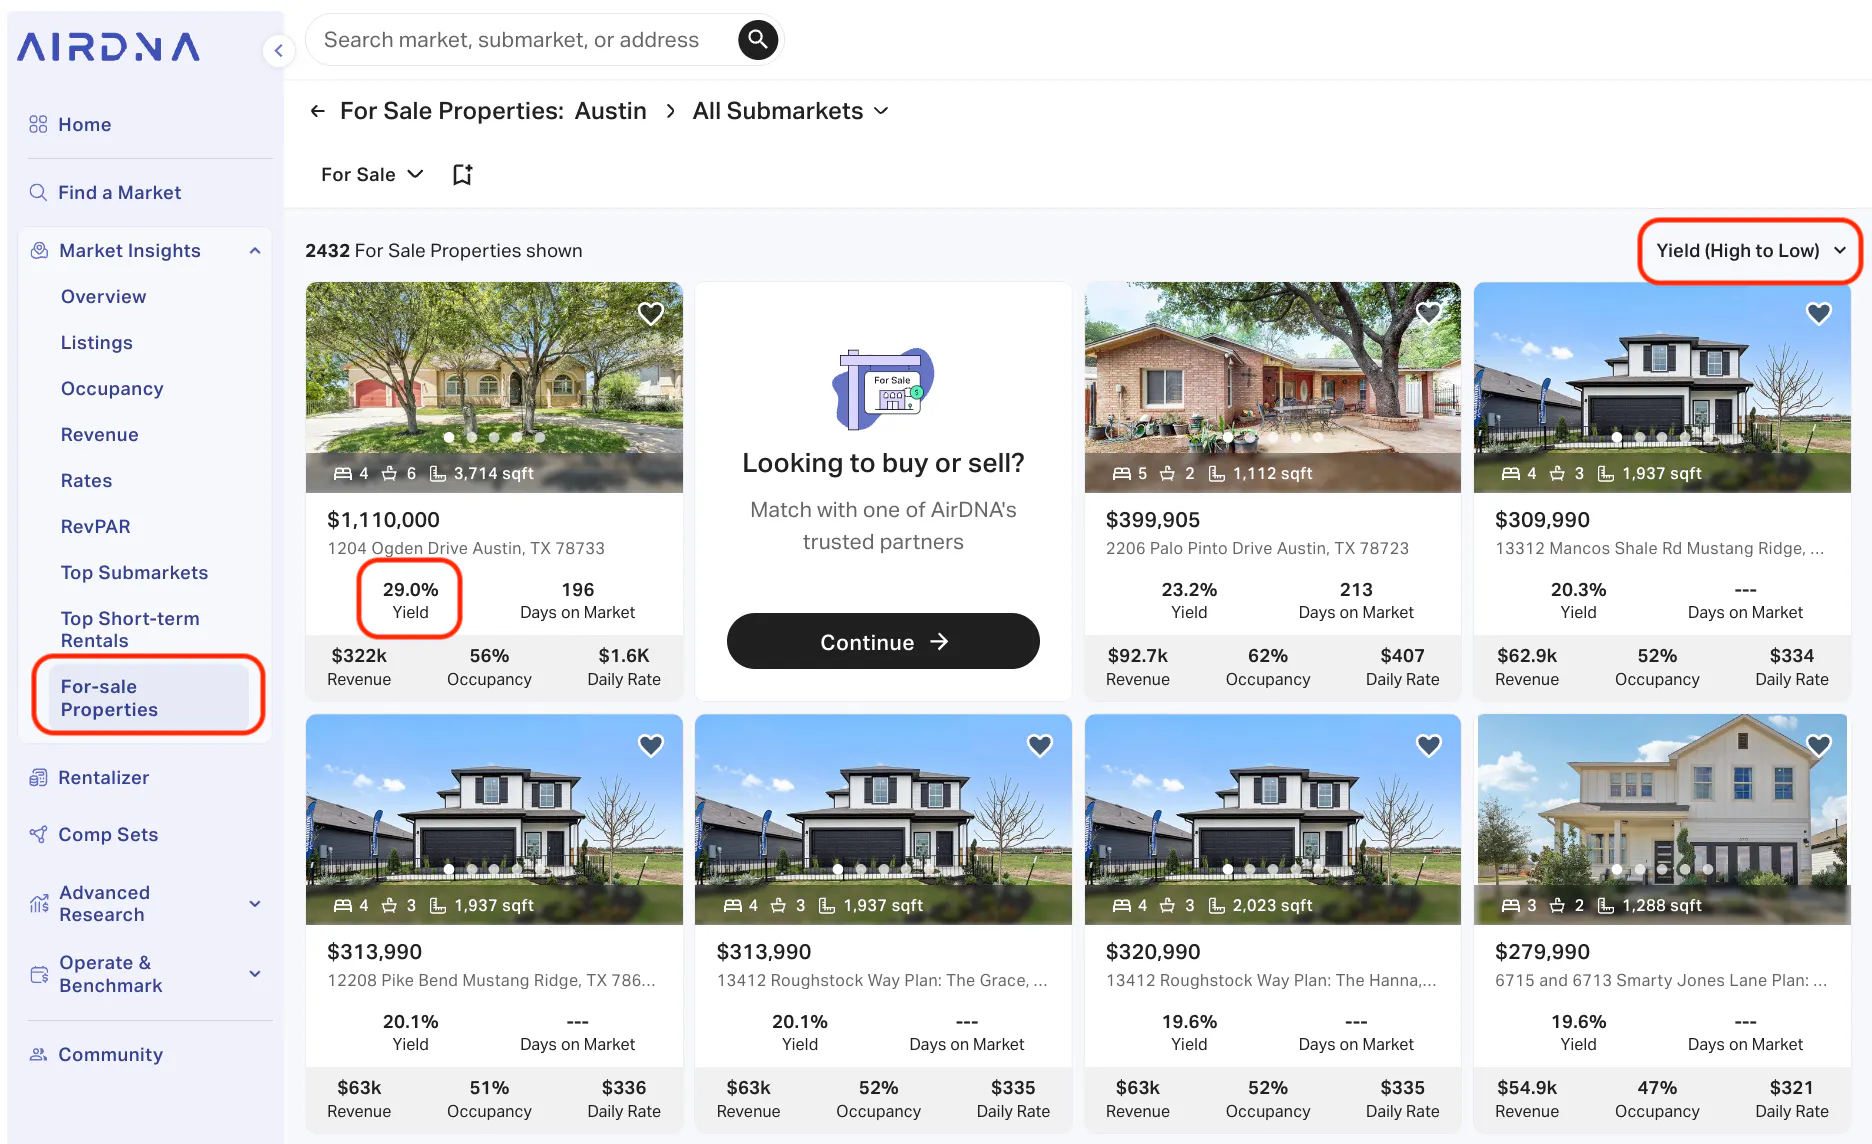
When you’re in the buying stage, yield becomes a useful metric as it takes into account the purchase price. Once you frame earnings relative to expenses, you’ll find that a modest 2-bedroom can sometimes give you similar returns to a 5-bedroom mansion.
AirDNA’s for-sale property feature automatically generates revenue projections for available properties based on how similar short-term rentals in the area are performing. Sort for-sale listings by yield to see which properties will get you the most bang for your buck.
8. Understand pricing strategies
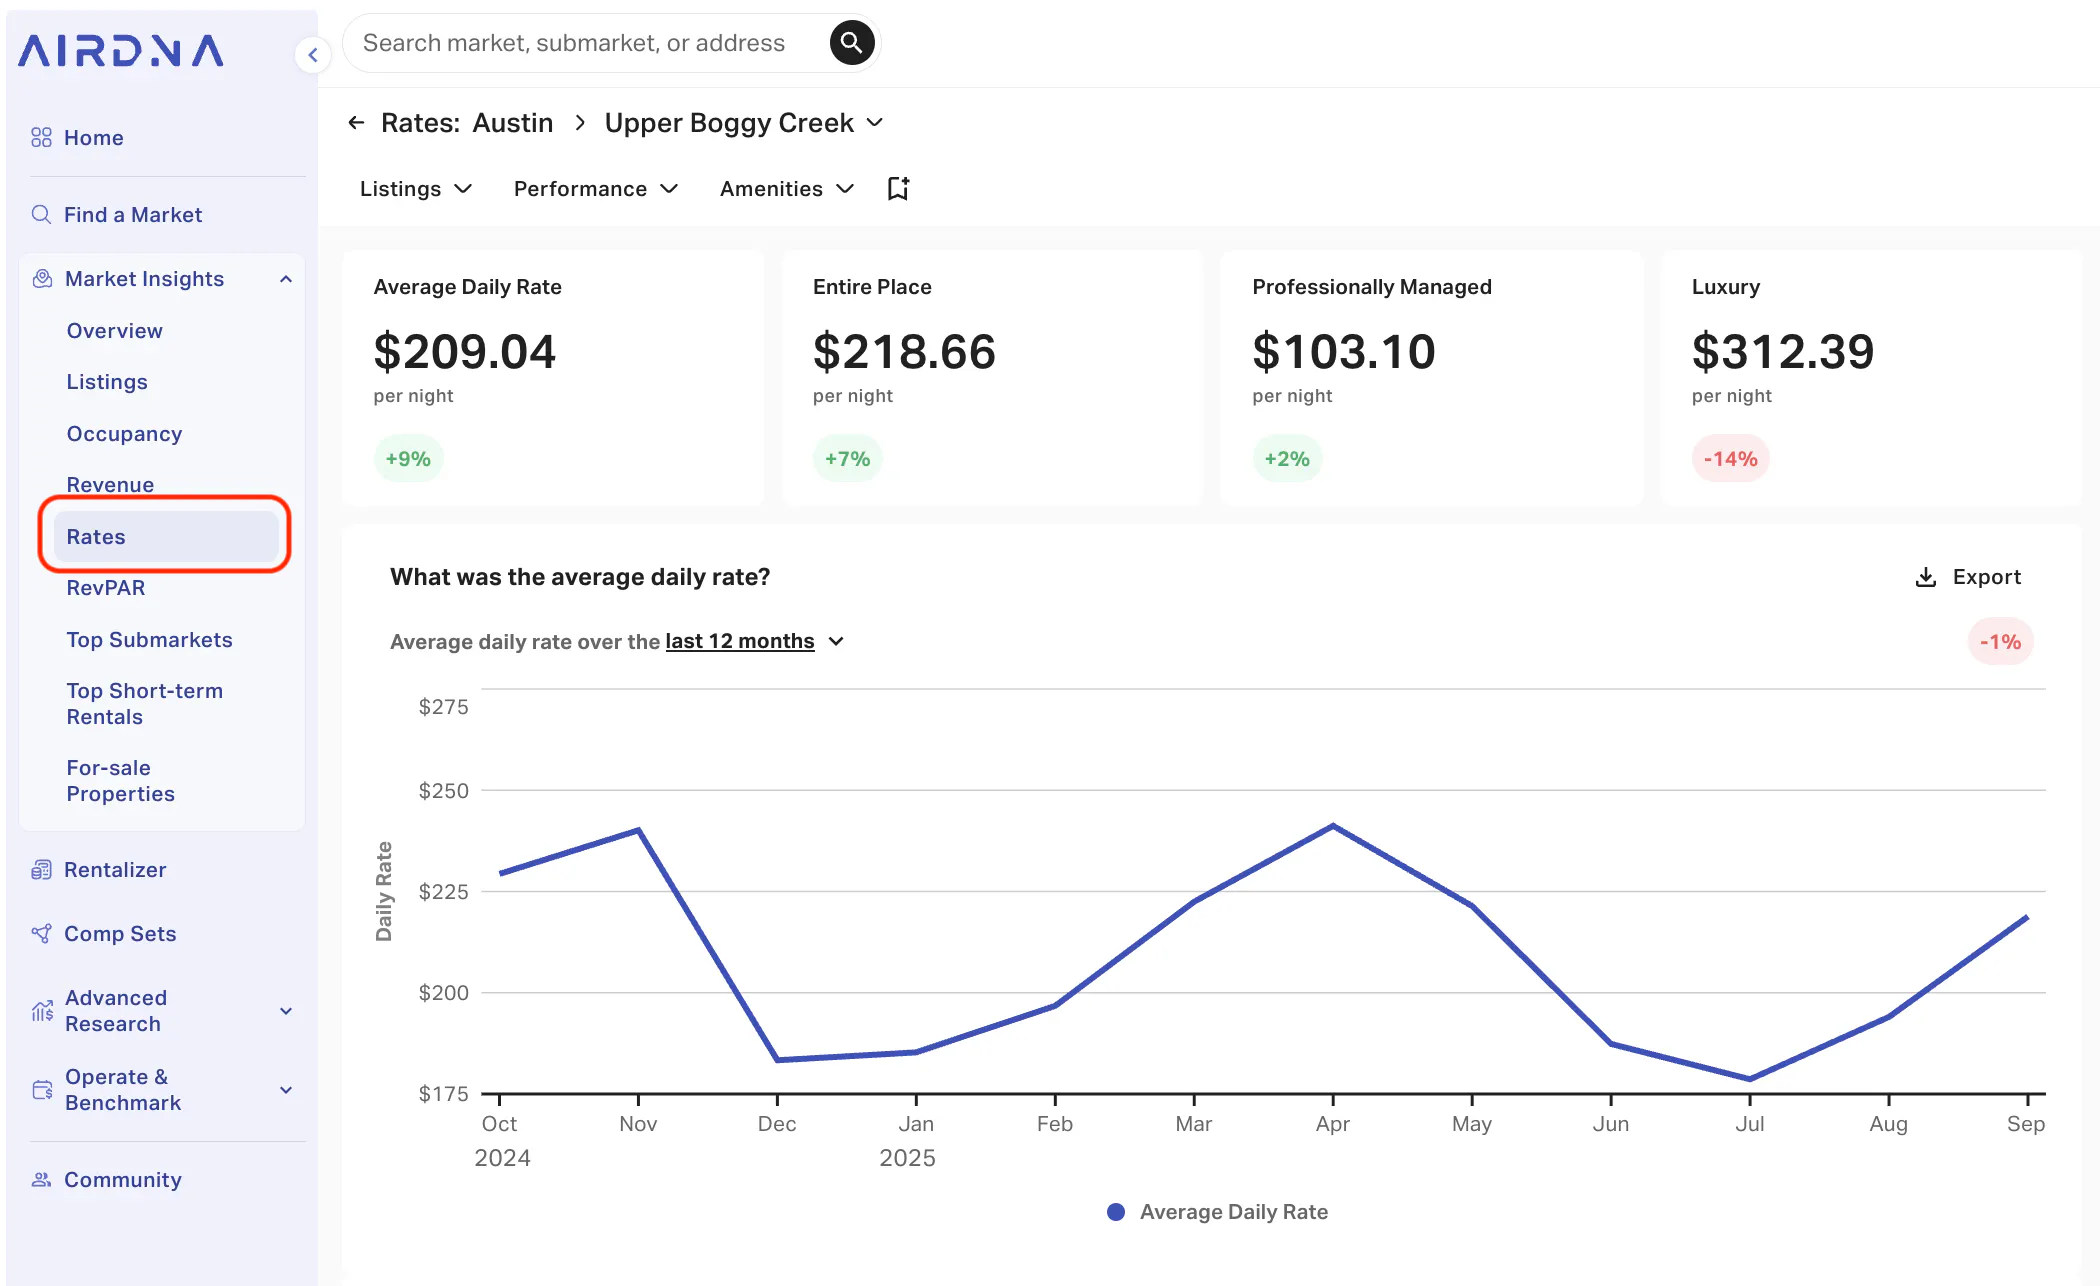
Research pricing trends and the average price for short-term rentals in your target market. The Rates section of Market Insights provides helpful information, including:
- The overall ADR for your submarket
- How nightly rates differ between vacation rentals run by professional property managers versus individual hosts
- ADR by price tier (luxury, upscale, midscale, economy, and budget listings)
- How nightly rates change seasonally
- Nightly rates by bedroom count
- How much guests are willing to pay up to 180 days in the future.
In Upper Boggy Creek, hosts are charging $209.04 per night, on average. Interestingly, professionally managed listings are earning significantly less. This might signal that property managed listings are lower quality and/or guests are willing to pay more for a personalized hosting experience. Nightly rates bottom out in December ($183.20) and July ($178.60) and peak in November ($240.10) and April ($241.20).
If you already have a short-term rental, compare your property's rates to similar listings to ensure that you’re offering competitive pricing while maximizing profitability. Consider factors such as property size, location, amenities, and seasonality when setting your pricing strategy.
9. Calculate potential ROI and net income
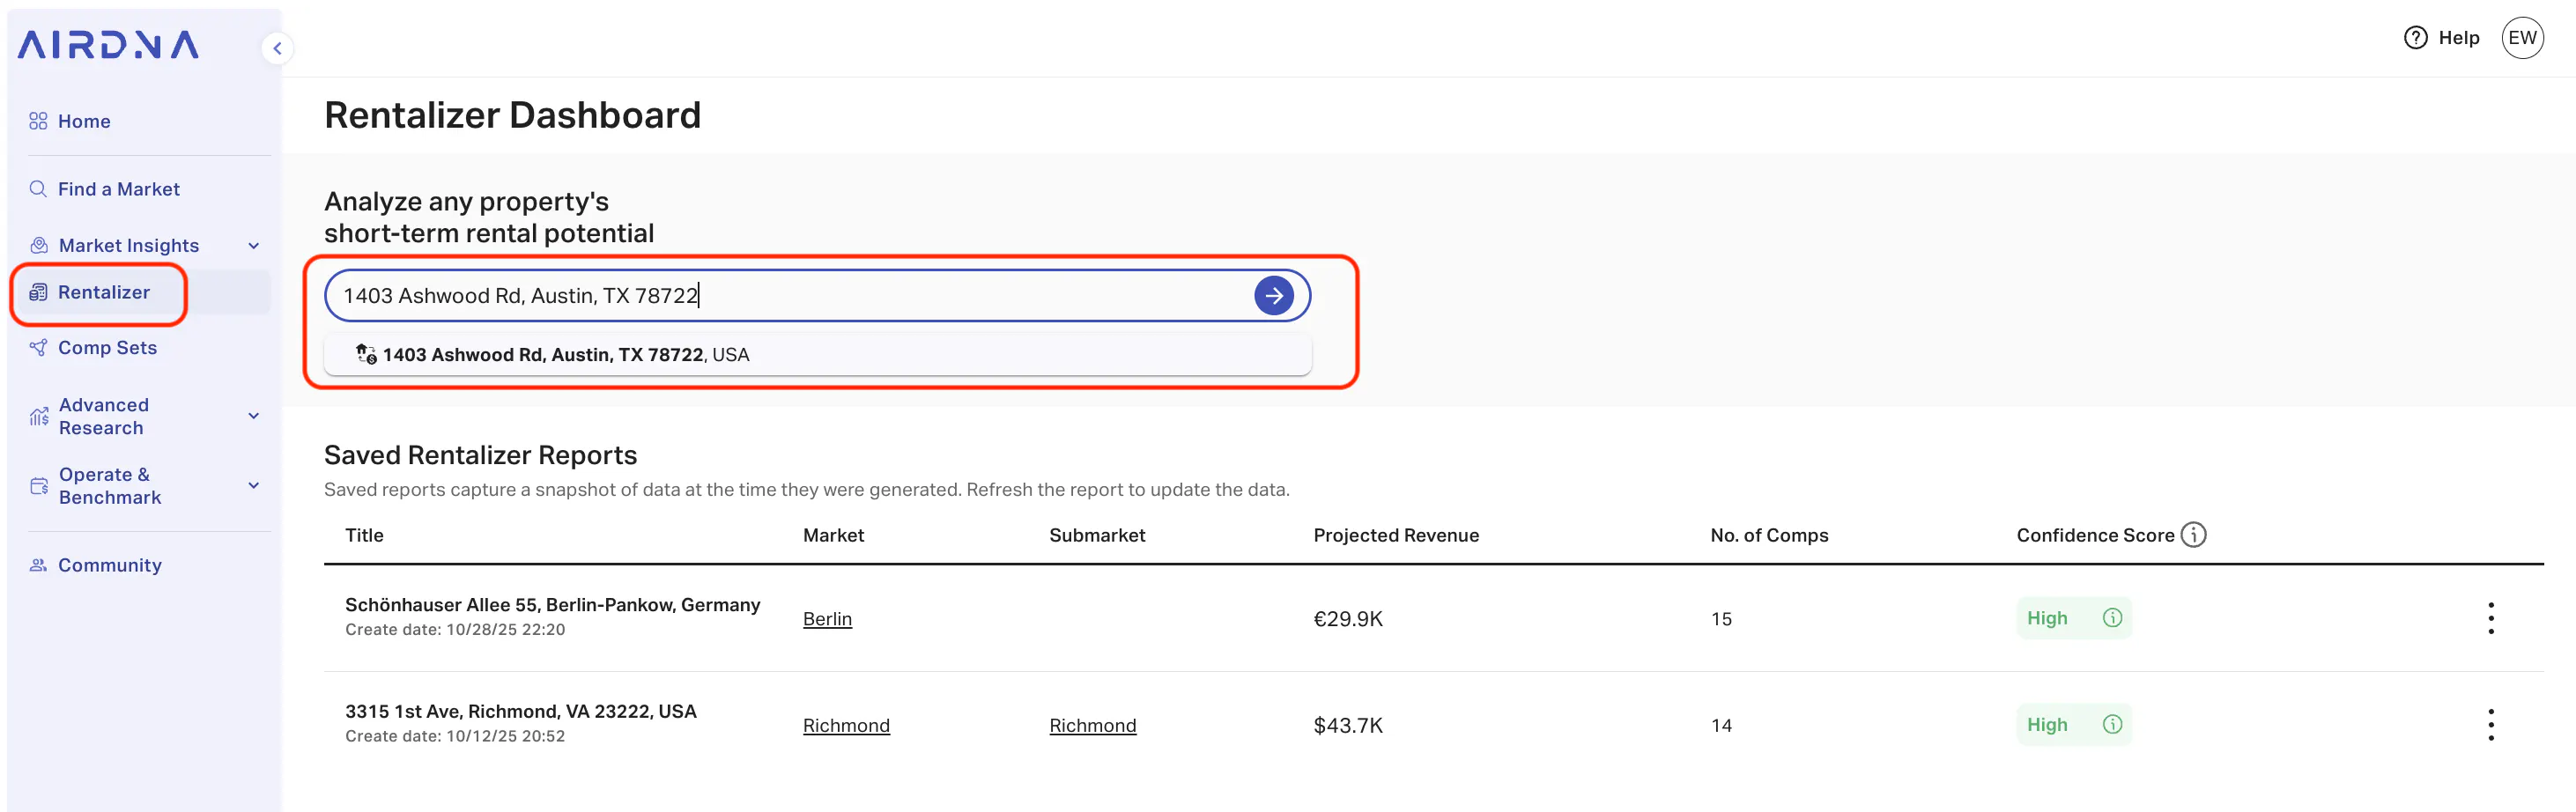
Estimate your potential rental income by projecting the average nightly rate and occupancy rate for your property. This is where AirDNA’s Airbnb calculator comes in. Enter an address and AirDNA will generate a Property Earning Potential report that you can save, return to, and refresh whenever you’d like.
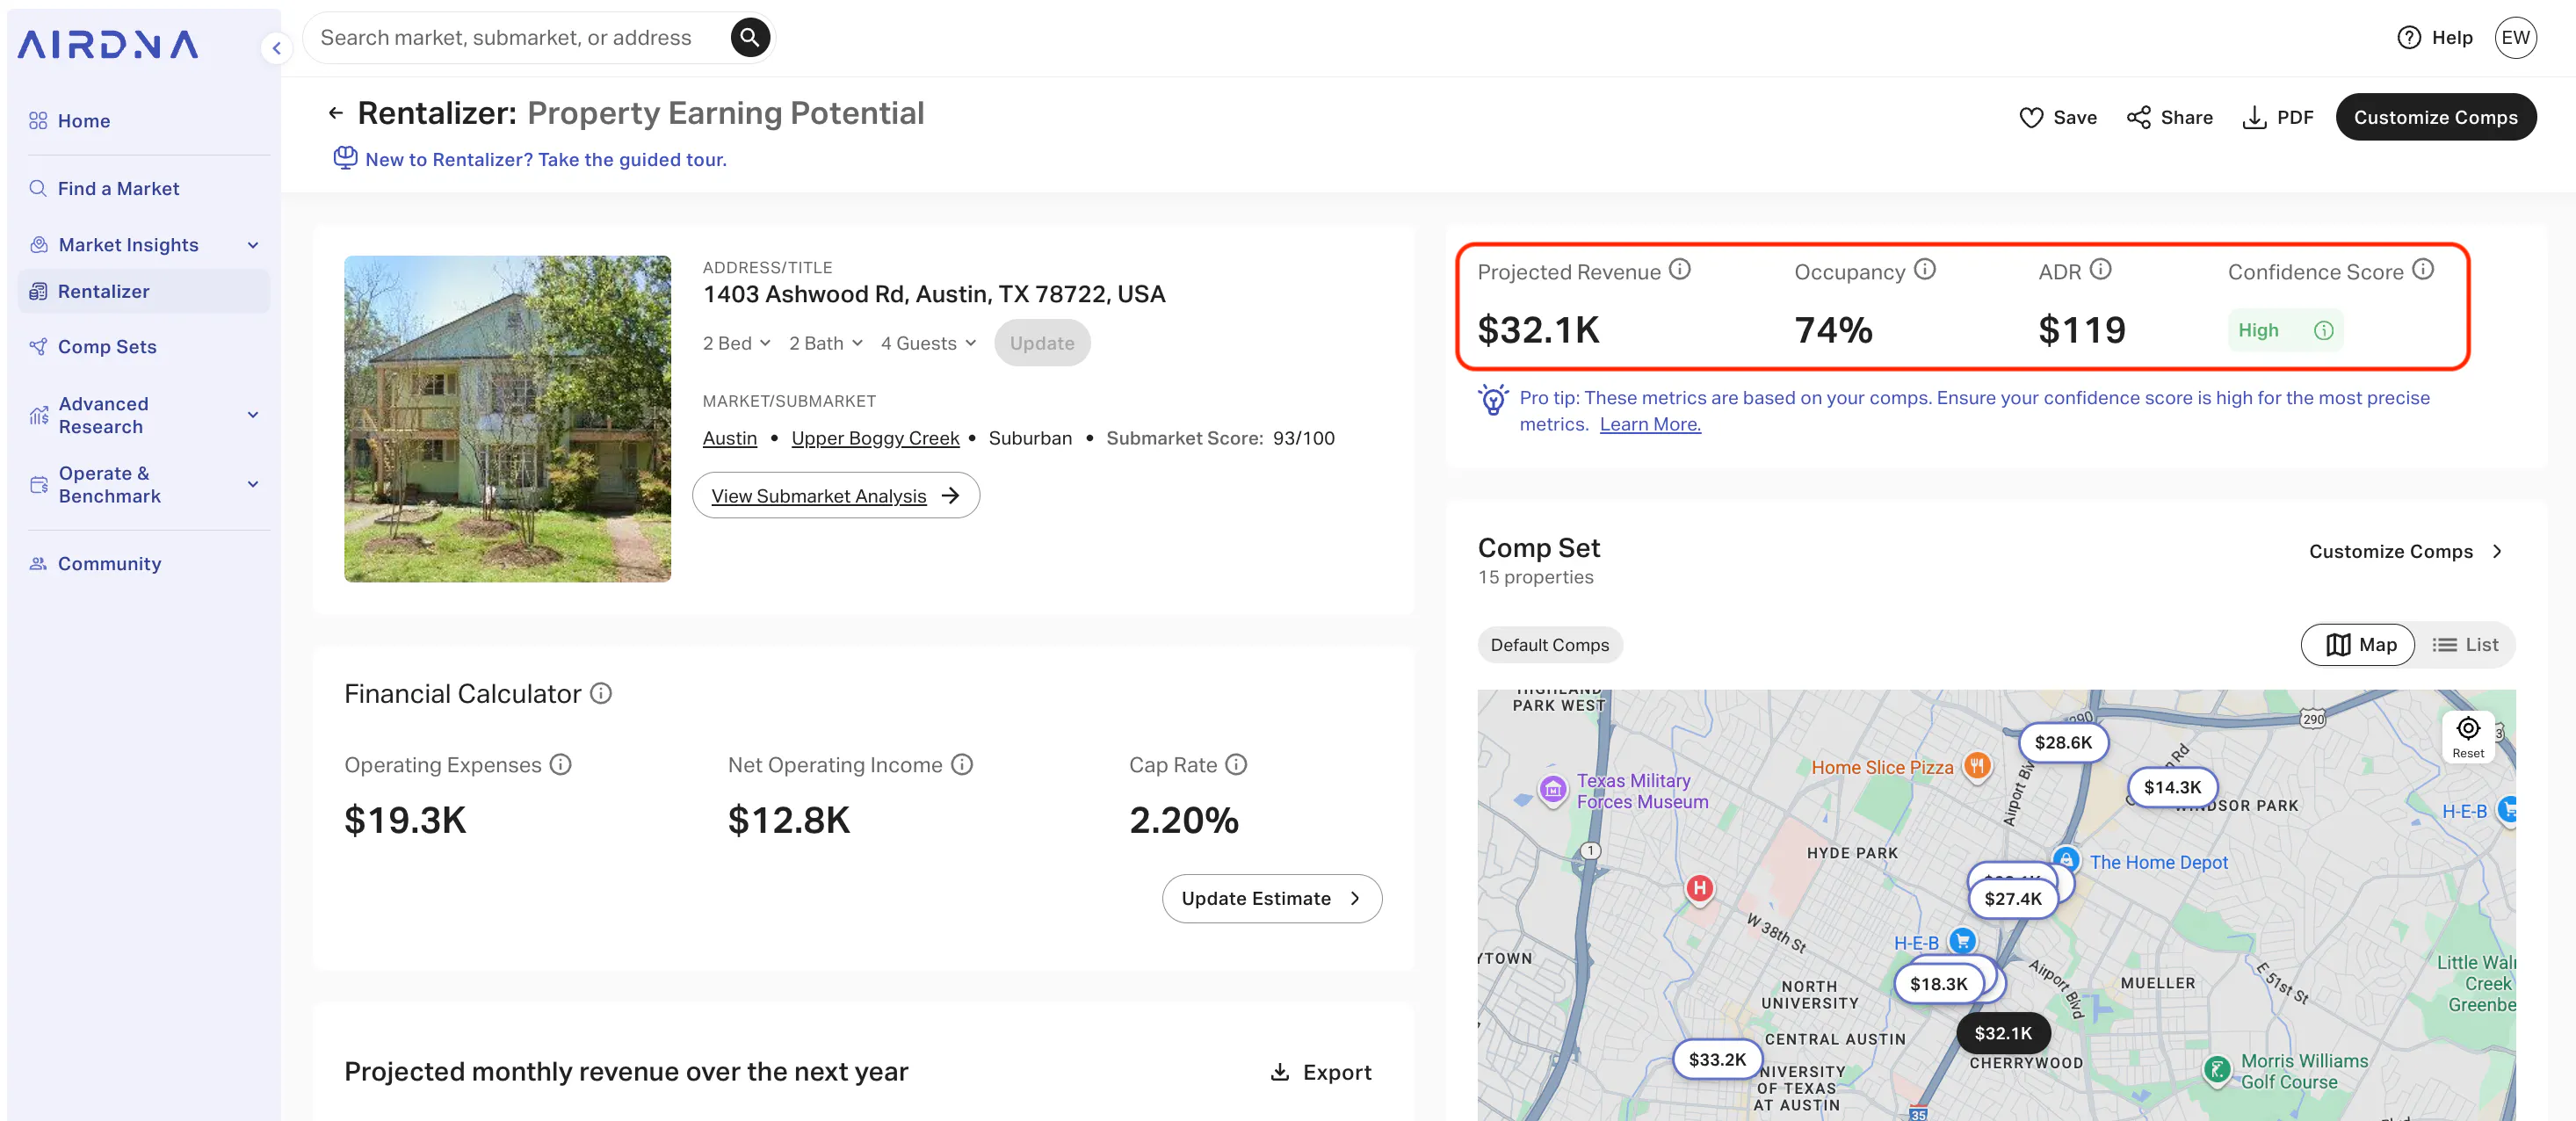
The report’s Confidence Score communicates the accuracy of the projection. If it’s high, that means revenue across properties in your comparable set is consistent. You can customize your comps for a more precise estimate. This means hand-selecting the short-term rentals that are being used as a basis for projected performance. We talk about this strategy more in-depth here.
In the case of this for-sale property in Upper Boggy Creek in Austin, the projected revenue is $32,100 with a 72% occupancy rate and an ADR of $119. The Confidence Score is high, so customizing comps is optional.
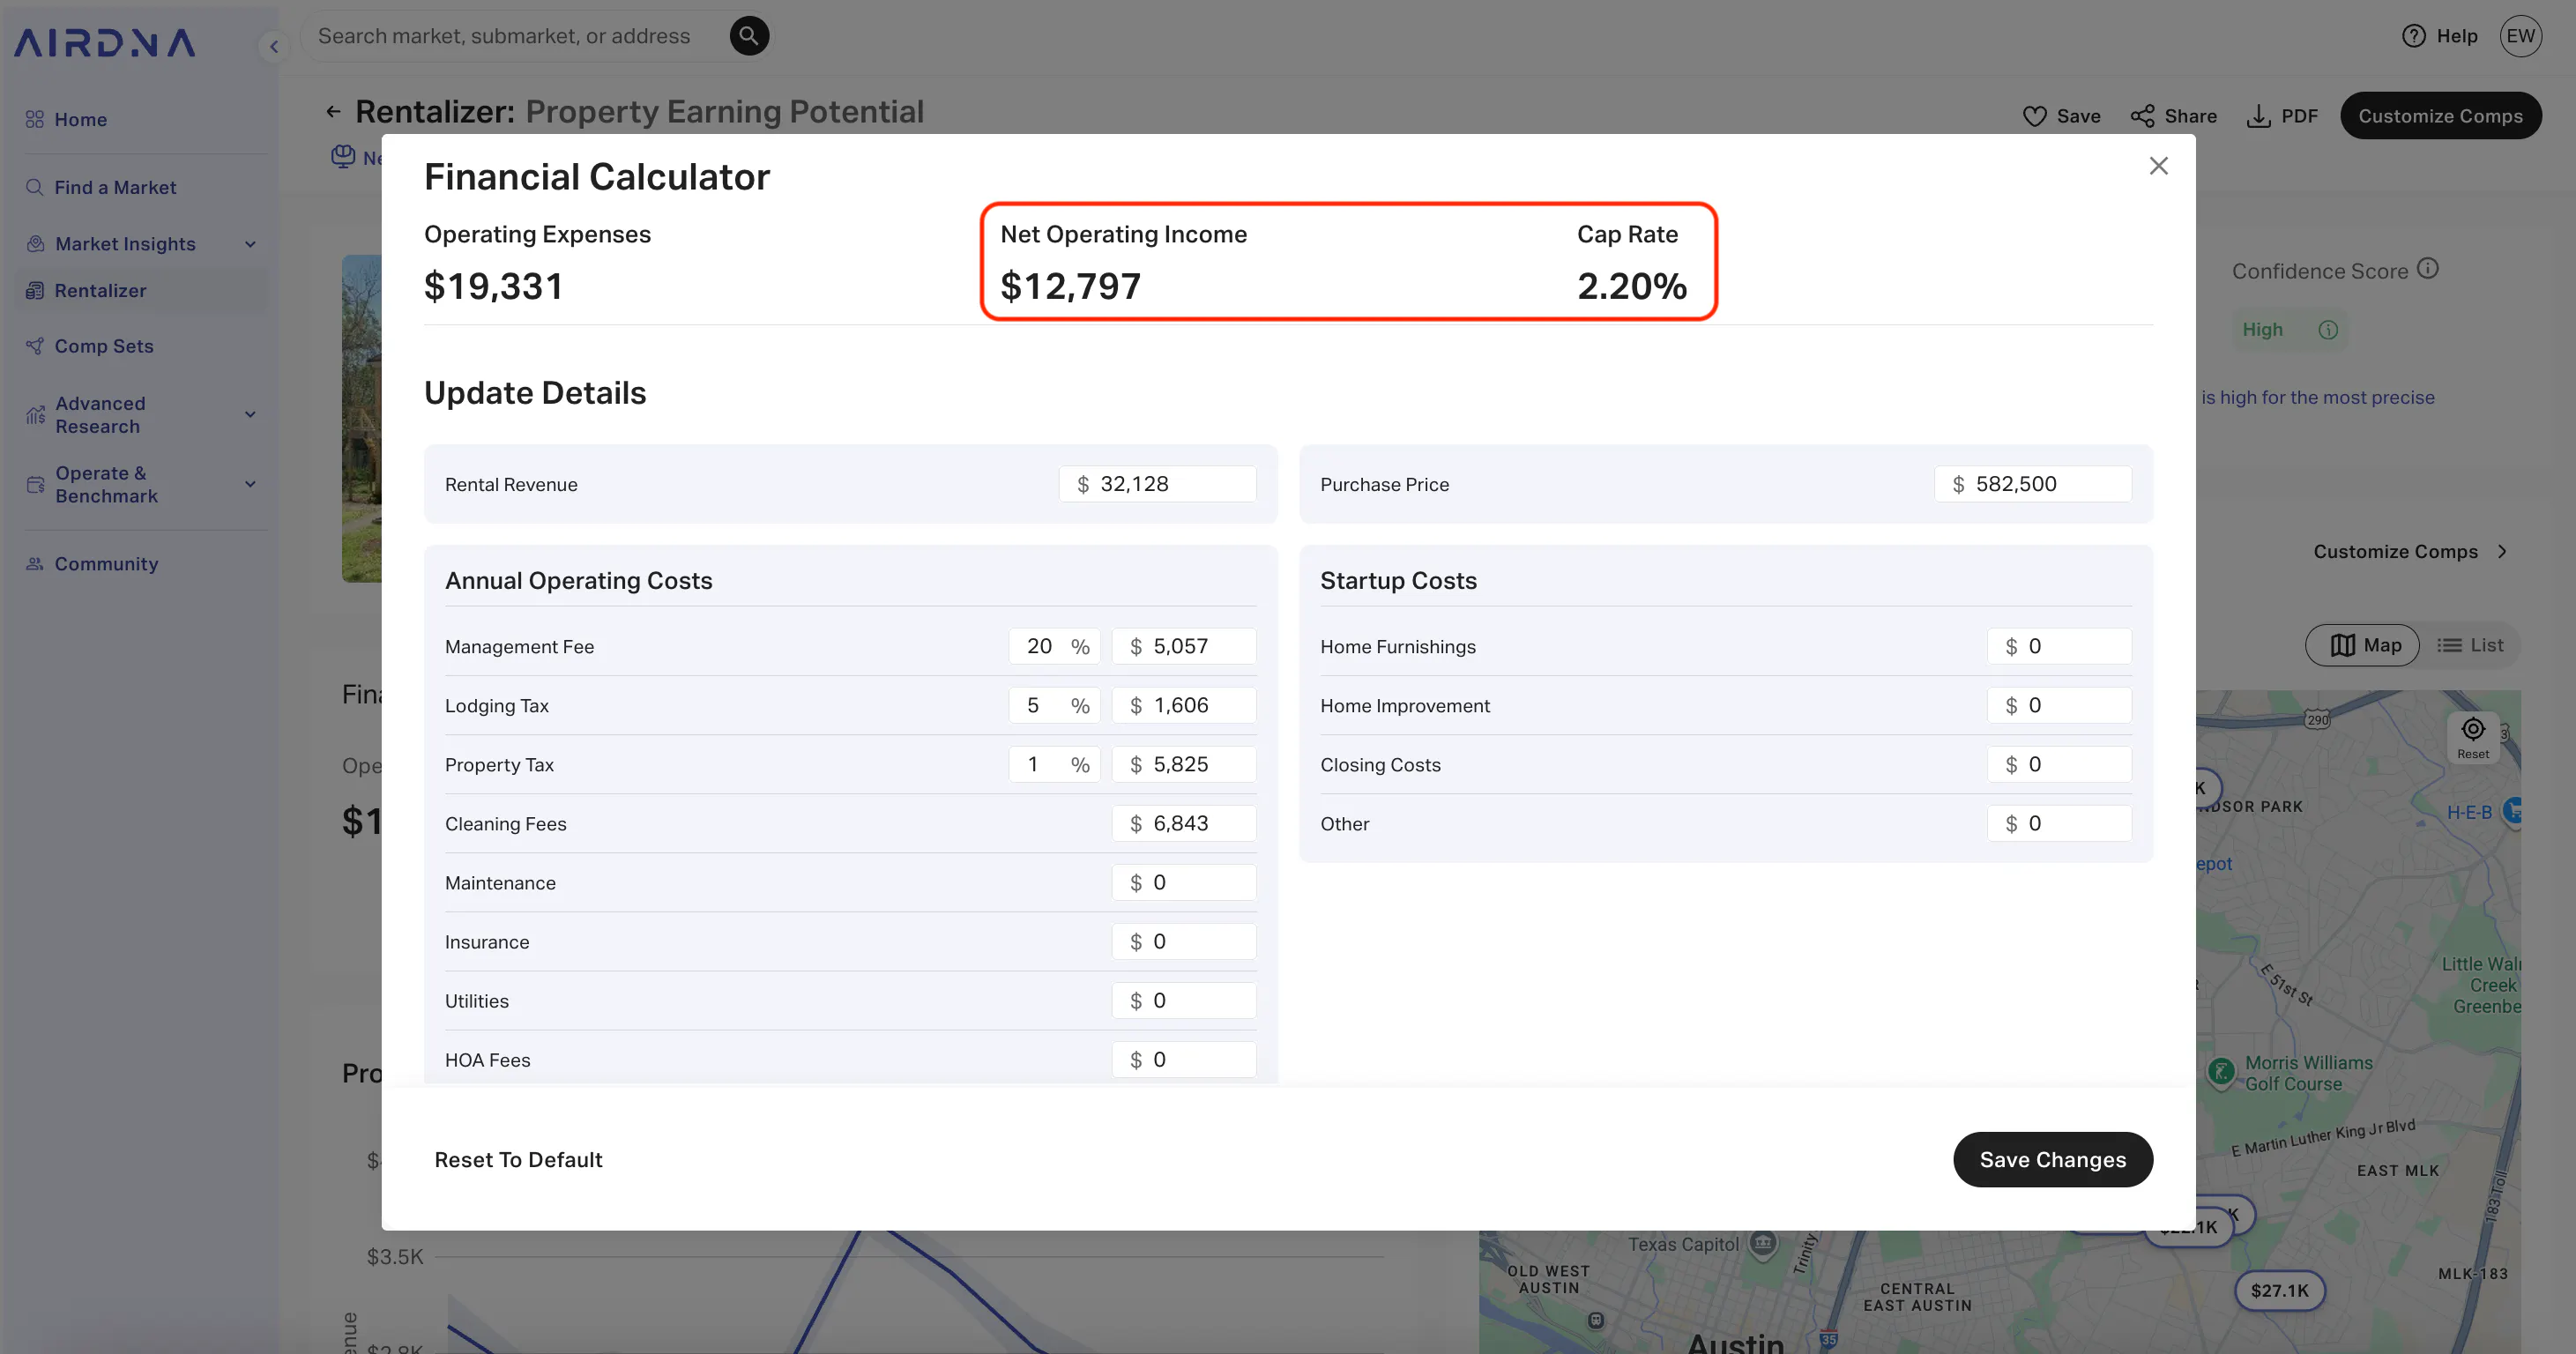
The next step is to factor in operating expenses such as property taxes, insurance, utilities, maintenance costs, and property management fees. Use the Financial Calculator in the Rentalizer Report to fill in these costs. Note that Cleaning Fees is already filled in based on how much of similar properties’ income comes from cleaning fees in your area.
Once you fill out as many of the annual operating costs and startup costs as you can, we automatically subtract your total expenses from your projected rental income to calculate your net operating income and cap rate.
“Investors should also consider the implications of different financing options on their return on investment (ROI) and cash flow,” says Adam Windham of Host Financial. “Tools that provide market-specific data, such as revenue estimators and cost calculators, can aid in assessing the potential profitability of properties in various locations."

Why Invest in Short-Term Rental Properties
In recent years, the short-term rental industry has experienced significant growth and popularity. The global short-term vacation rental market was valued at 134.51 billion USD in 2024 and is projected to reach USD 256.31 billion by 2030, growing at a compound annual growth rate (CAGR) of 11.4% from 2025 to 2030. This growth has been fueled by the rise of online booking platforms, changing consumer preferences, and the increasing appeal of experiential travel.
This shift in consumer behavior has propelled the expansion of the vacation rental market. However, experienced investors and short-term rental owners have long been capitalizing on the growing demand for temporary lodging options over hotels.
Short-term rentals as an asset class are also unique.Airbnb investment offers a compelling combination of financial benefits, flexibility, and diversification opportunities that make it an attractive asset for both seasoned and novice real estate investors alike. That’s why many investors have shifted their portfolio, at least in part, to tap into the growing demand for Airbnbs.

Those who do invest in short-term rentals open their portfolio to:
Higher rental income potential
Short-term rentals often command higher rental rates compared to long-term rentals, especially during peak seasons or in popular tourist destinations. In fact, short-term rentals can generate 2-3 times more revenue than traditional long-term rentals in many markets.
This revenue advantage stems from the ability to adjust nightly rates based on demand, capitalize on high-season pricing, and charge premium rates during local events or festivals. While long-term rentals offer stability with fixed monthly income, short-term rentals provide the opportunity to maximize earnings during peak periods. The trade-off is more active management and potential vacancy during slower seasons.
Flexibility
Because they aren’t beholden to long-term tenants, hosts can opt for short-term renting and use their properties for personal vacations or other purposes when not occupied by guests. Investors can use this flexibility to strike a balance between generating rental income and enjoying their properties themselves.
Diversification
Short-term rental properties provide investors an opportunity to diversify across properties and locations. Investors spread their risk and mitigate potential losses associated with market fluctuations or economic downturns. Additionally, short-term rentals offer the flexibility to target different market segments, such as leisure travelers, business travelers, or event attendees, further diversifying revenue sources.
Stronger ROI potential
Short-term rentals can deliver higher return on investment (ROI) compared to long-term rentals or traditional hotel accommodations. First, there's the cash flow from nightly bookings, which you can optimize through careful short-term rental market analysis and strategic pricing to maximize your occupancy rate.
Short-term rental investors also benefit from significant tax advantages, including bonus depreciation and deductions for mortgage interest, operating expenses, and even travel costs related to property management. These tax savings can substantially increase your net returns. When you factor in rental income, tax benefits, and appreciation together, you're looking at a multi-layered return that can outperform traditional real estate investments.
Opportunity for property appreciation
In addition to generating rental income, short-term rental property values may appreciate over time, especially in high-demand markets or desirable locations. As demand for short-term rentals continues to grow and property values increase, investors may benefit from capital appreciation. This results in higher property valuations and potential equity gains.
Current short-term rental market statistics and projections
The short-term rental market is experiencing a tale of two realities: some markets are thriving while others are struggling under the weight of oversupply. According to AirDNA's latest data, U.S. short-term rentals posted a record high RevPAR in August 2025 at $181—up 3.4% year-over-year—driven by strong nightly rates ($238, up 4.8%) that more than offset a slight dip in occupancy.
Meanwhile, Europe's STR market hit $196 RevPAR in August, up 1.0% from last year, with occupancy holding steady at 71.4% despite a 6.1% surge in active listings. What those headlines don't tell you is that performance can be wildly uneven across markets, property types, and even within the same city, making submarket analysis more critical than ever.
The fastest-growing STR markets are those that have cracked the code on what today's travelers actually want. Markets like Tulum, Mexico, and Lisbon, Portugal are seeing explosive growth fueled by digital nomads and remote workers seeking longer stays in culturally rich destinations.
Meanwhile, traditional vacation hotspots that relied solely on summer tourism are watching their occupancy rates slide as supply outpaces demand. The lesson? Location still matters, but the type of location that wins has fundamentally shifted. Travelers are increasingly prioritizing unique experiences, authentic local culture, and properties that support extended stays, not just proximity to tourist traps. If your market analysis isn't accounting for these behavioral shifts, you're analyzing yesterday's market, not tomorrow's opportunities.
Common Short-Term Rental Analysis Mistakes
As crucial as market analysis is for short-term rental (STR) investments, there are common pitfalls that investors should be wary of to make informed decisions. Here are some pitfalls to avoid:
Misinterpreting average occupancies and nightly rates
Average occupancies and rates can vary significantly across different property types and price tiers within the same market. For example, budget listings in Austin, Texas have an average occupancy of 57%, but luxury listings only achieve an occupancy rate of 52%. That occupancy value changes again when you zoom into Upper Boggy Creek as a submarket of Austin, where luxury listings are only booked 40% of the time.
Similarly, rates can differ substantially between various property types and bedroom counts, emphasizing the importance of analyzing not just the market but also different property types and tiers. AirDNA’s custom filters can help you splice performance by different variables.
Not accounting for varied seasonality
Assuming every market follows the same seasonal pattern is like assuming every restaurant gets busy at dinner time. It ignores local realities that make or break your cash flow;.
Seasonality trends vary wildly across different markets and directly impact both occupancy rates and rental pricing in ways that can torpedo your investment if you're not prepared. Sure, the national high season typically peaks in June and July, but markets like Phoenix/Scottsdale flip that script entirely, hitting maximum occupancy in March when snowbirds and spring breakers flood in to escape colder climates. Mountain markets might peak in both winter (ski season) and summer (hiking season), while beach towns could see 80% occupancy in July and 30% in January.
If you're financing a property based on peak-season revenue assumptions and applying them across all 12 months, you're setting yourself up for a cash flow crisis during the inevitable slow months. Smart investors map out month-by-month occupancy and rate patterns for their specific market, then stress-test their financial models against the worst-performing quarters—not just the averages.

Short-term rental market analysis is the compass that guides investors toward success. While you now have the skills to analyze markets and make informed decisions on your own, also take notice of the broader trends shaping the industry. At AirDNA, our team of economists and data experts conducts regular market analyses to provide valuable insights into emerging trends and market movements.
Our monthly short-term rental market reviews dive into the data shaping travel trends across Europe and the U.S. Think of our reviews as the macro analysis that complements your local research to uncover hidden opportunities in specific markets you’ve got your eye on. Read our monthly market reviews to tap into our latest insights.
FAQs
What is the 80/20 rule for Airbnb?
The 80/20 rule suggests that around 20% of listings typically generate about 80% of the revenue in a given market. This disparity often results from some properties having premium amenities, standout design, or prime locations. For hosts, it emphasizes the importance of optimizing listings to stand out among the competition.
What is the projection for the short-term rental market?
The global short-term vacation rental market is projected to expand significantly in the coming years. Steady demand from remote workers and longer-stay guests is expected to fuel additional revenue growth. Markets in Europe and the U.S. appear particularly strong despite rising competition and regulatory challenges. Check out our article on growth trends for more information!
Are short-term rental bookings down?
Although occupancy can vary by region and season, current U.S. short-term rental data shows that bookings have remained mostly stable with only minor year-over-year dips in occupancy. Slight decreases in occupancy are being offset by increases in daily rates, leading to overall revenue growth.
ARTICLE SUMMARY
Before investing in short-term rentals, it's important to analyze the market carefully. Looking into demand, competition, prices, and regulation helps you make smart choices, understand what you can earn, and avoid common pitfalls.
Bram Gallagher
AirDNA Director of Economics and Forecasting
Bram Gallagher is an Economist at AirDNA, specializing in uncovering insights that drive smarter short-term rental decisions. He put his Ph.D. in Economics from the University of Georgia to work researching and forecasting hotel data with CBRE prior to joining AirDNA, as well as teaching economics at a number of universities. In his spare time, Bram enjoys making wooden furniture with hand tools.


