

 Calculate Revenue
 Research Markets
 Find For Sale Properties
 Compare My Listing
 STR Revenue Calculator
 Custom Comp Sets
 Submarket Insights
 Custom Search Filters
 Rate Recommendations
 Performance Benchmarking
 Competitor Comparison
 Owner Contact Details
 Property-level performance data
 Tourism Insights
 Real Estate Investment Analytics
 About Us
 Sales
Sales Support
 Press
PressUnpacking Key London Short-Term Rental Data for 2024
Published: June 6, 2024
Last updated: February 24, 2025

Jamie Lane
In Q2 2022, Hungary, Greece, and Croatia respectively saw 342.1%, 116.5%, and 80.4% more Airbnb reservations made by international travellers year over year, while reservations made by domestic travellers in the same comparison period had declined in each of these countries.
Key Takeaways:
- Short-term rental data shows that vacation rental demand has seen greater growth in coastal and rural towns in the UK since the pandemic, while demand in larger cities such as London is still recovering.
- Stronger supply than demand growth in London has led to declining occupancy, ADR, and RevPAR growth over the last year.
- Localized data is important because market performance can vary across London’s boroughs.
London, with its iconic skyline dominated by the historic Big Ben, the imposing Tower Bridge, and the majestic Buckingham Palace, has long been etched in the global imagination as a premier travel destination. Does the current short-term rental (STR) data echo this romantic vision of London as a thriving tourist hub?
Recent data reveals a mixed picture. While the city has not fully rebounded to its pre-pandemic vibrancy, the landscape for Airbnb hosts is gradually brightening. Today's hosts benefit from higher Average Daily Rates (ADRs) and the data for 2024 shows promising projections.
We use the AirDNA dashboard—available to users with a paid OR free subscription—to delve into the complexities of London's rental trends, providing a grounded perspective on its status as a tourist magnet in the post-COVID era.
Supply
Vacation rental listings have been slow to bounce back in London. The number of Airbnb listings is 11% lower than it was in 2019.
In the second half of 2021 and throughout 2022, supply was slower to recover than demand. That is, there were more people looking to book Airbnbs than there were listings to choose from.
However, since the beginning of 2023, supply growth in London has surpassed demand growth. The number of booked listings over the last 12 months has averaged 51,000 in London, up 33% year-over-year (YOY). Of those listings, smaller properties dominate:
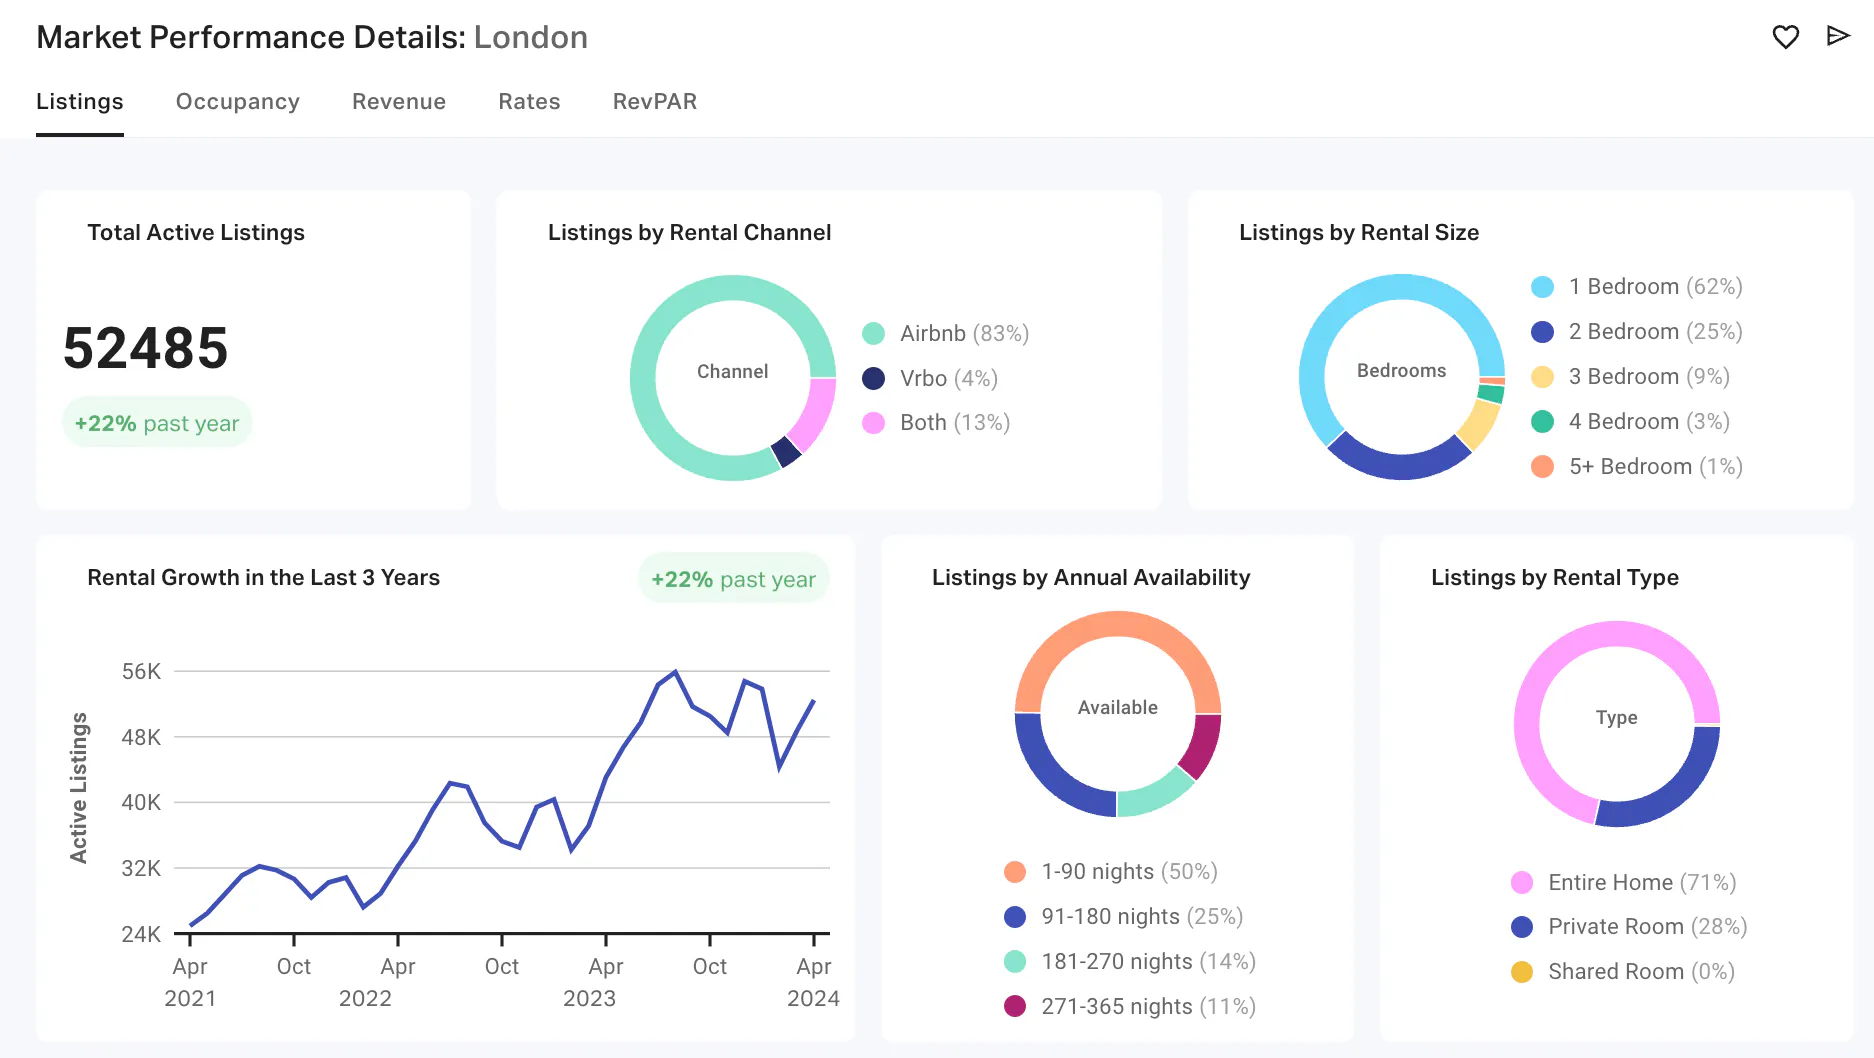
- 62% of London listings are 1 bedroom.
- 25% are 2 bedrooms.
- 13% are 3 or more bedrooms.
Vacation rentals offering a private room within a shared property make up 28% of all listings by rental type.

Demand
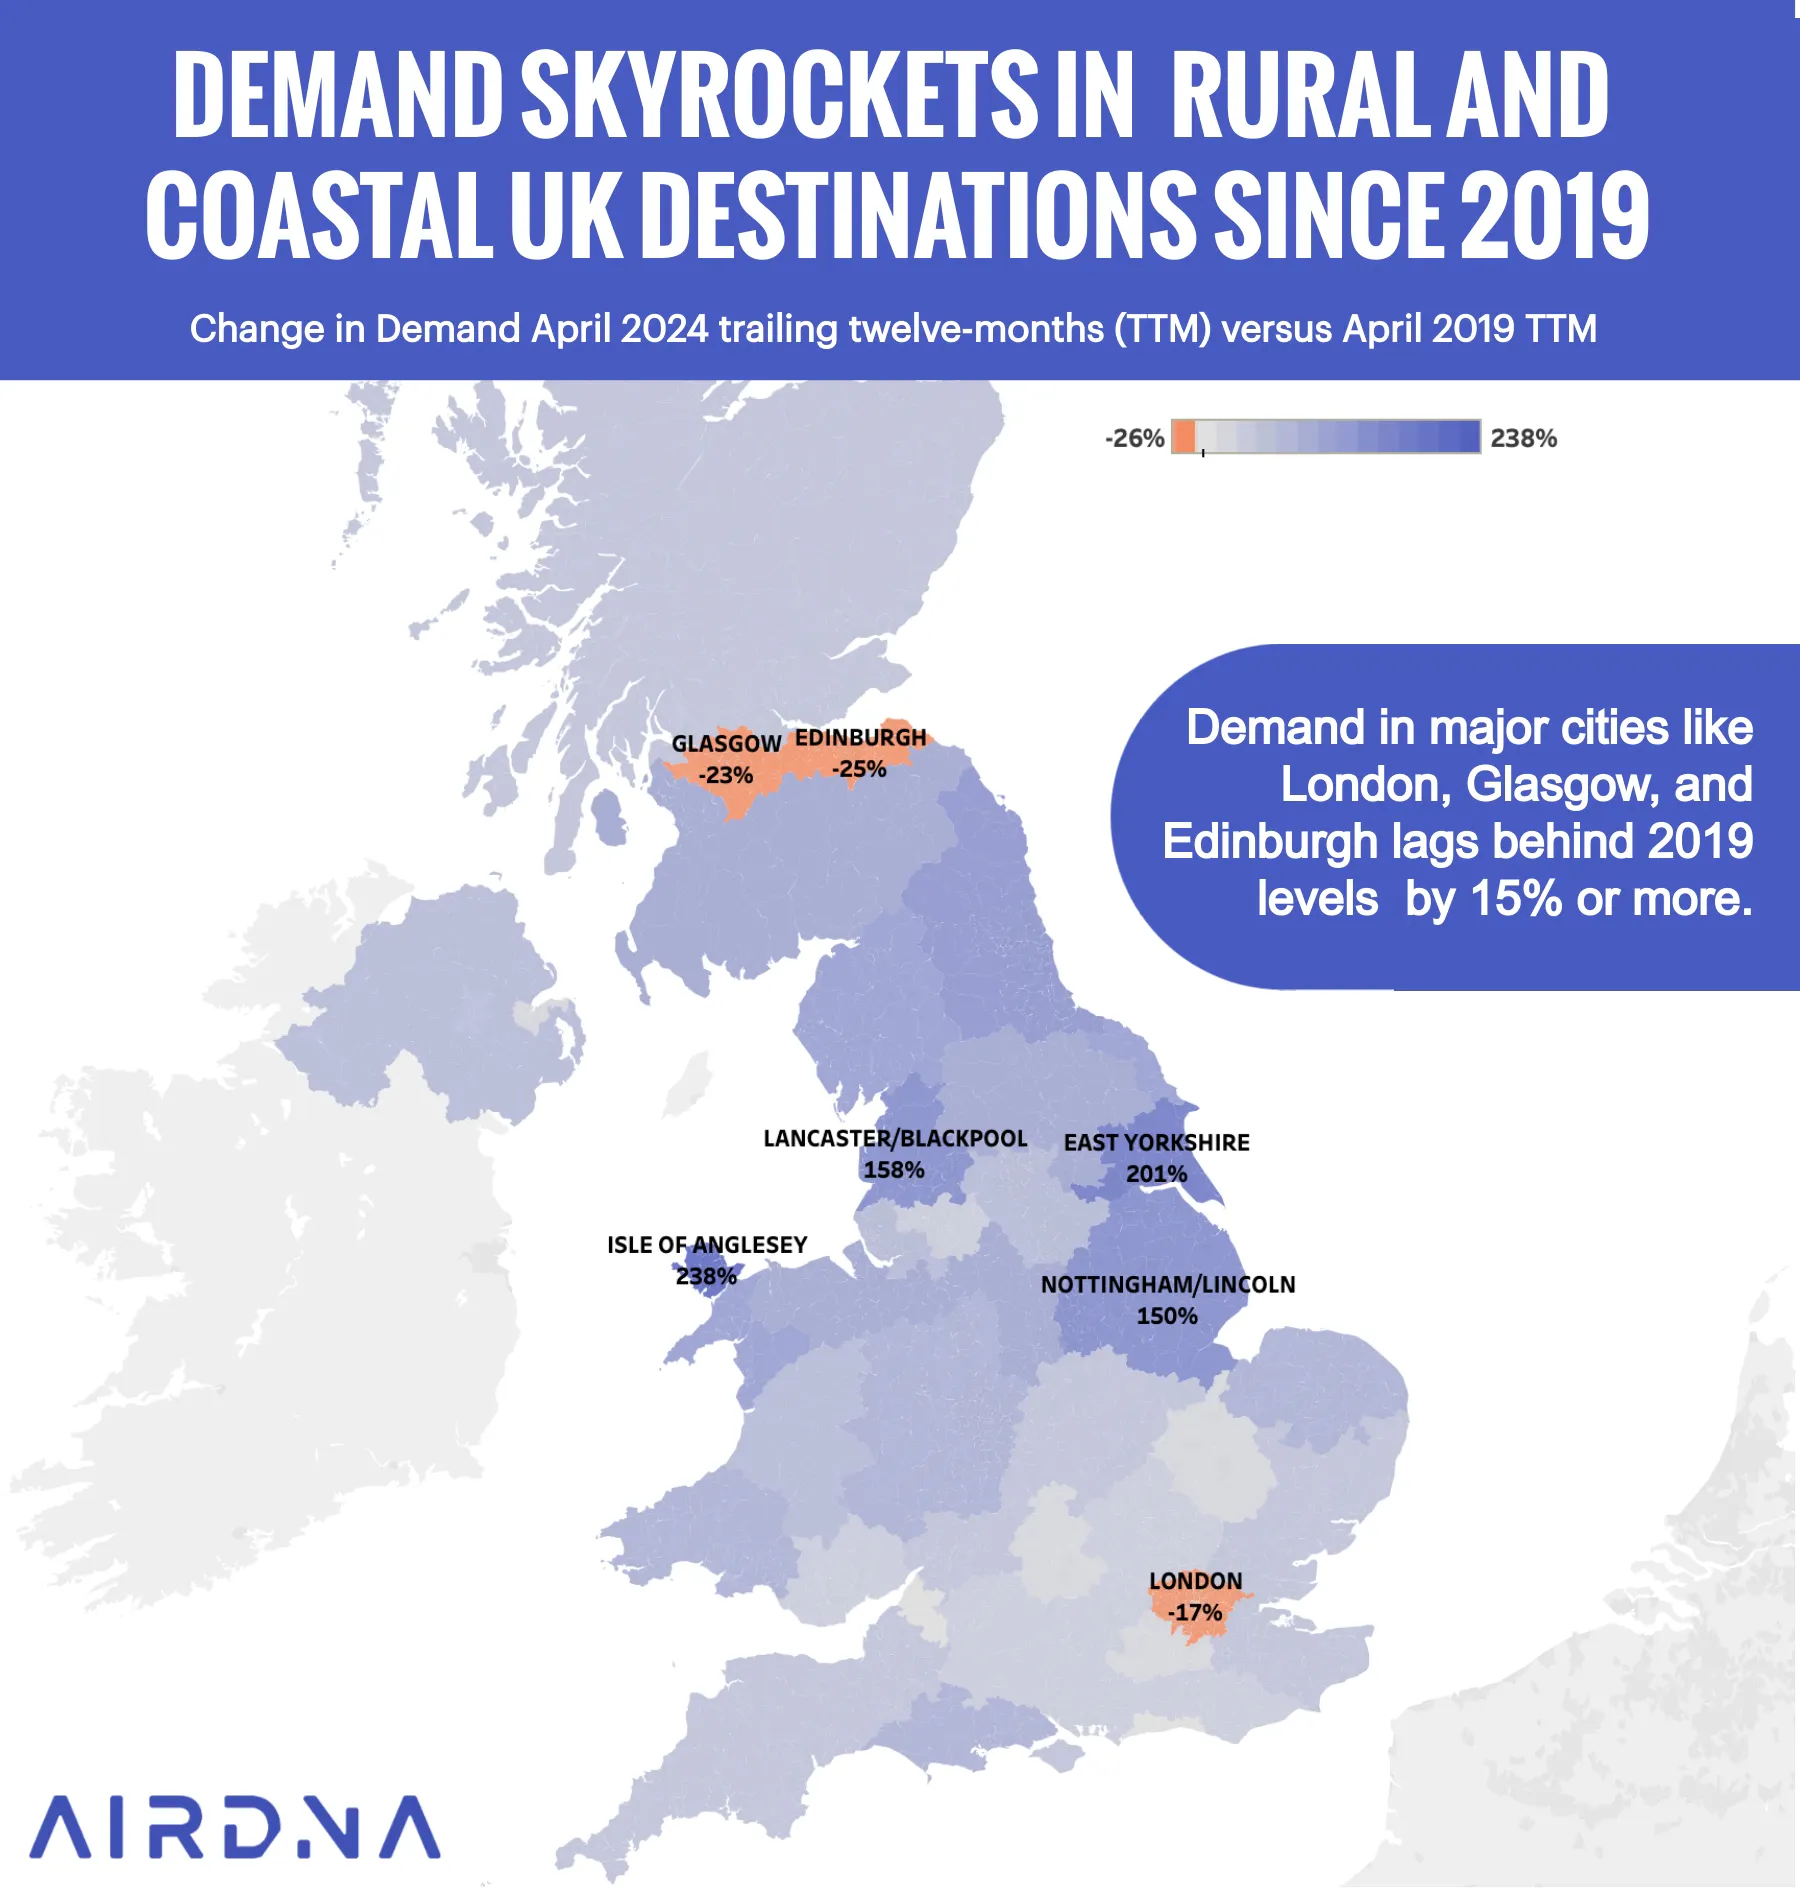
Among the major markets in the UK, London ranks in the bottom three for demand recovery since the pandemic.
Rural and coastal markets in the UK, such as East Yorkshire and the Isle of Anglesey, benefited most from increased travel demand during the pandemic. Major cities such as Edinburgh and London, on the other hand, suffered from poor domestic and international travel demand.
Demand growth has been stronger among the UK's largest cities this past year. London, for instance, has experienced a 26% year-over-year (YOY) increase in demand, putting it in third place for demand growth in the UK.
However, 8.1 million total demand nights over the last year is still 17% below 2019 levels. Demand nights is the total number of booked nights during the reporting period.
Top Booking Channel: Airbnb
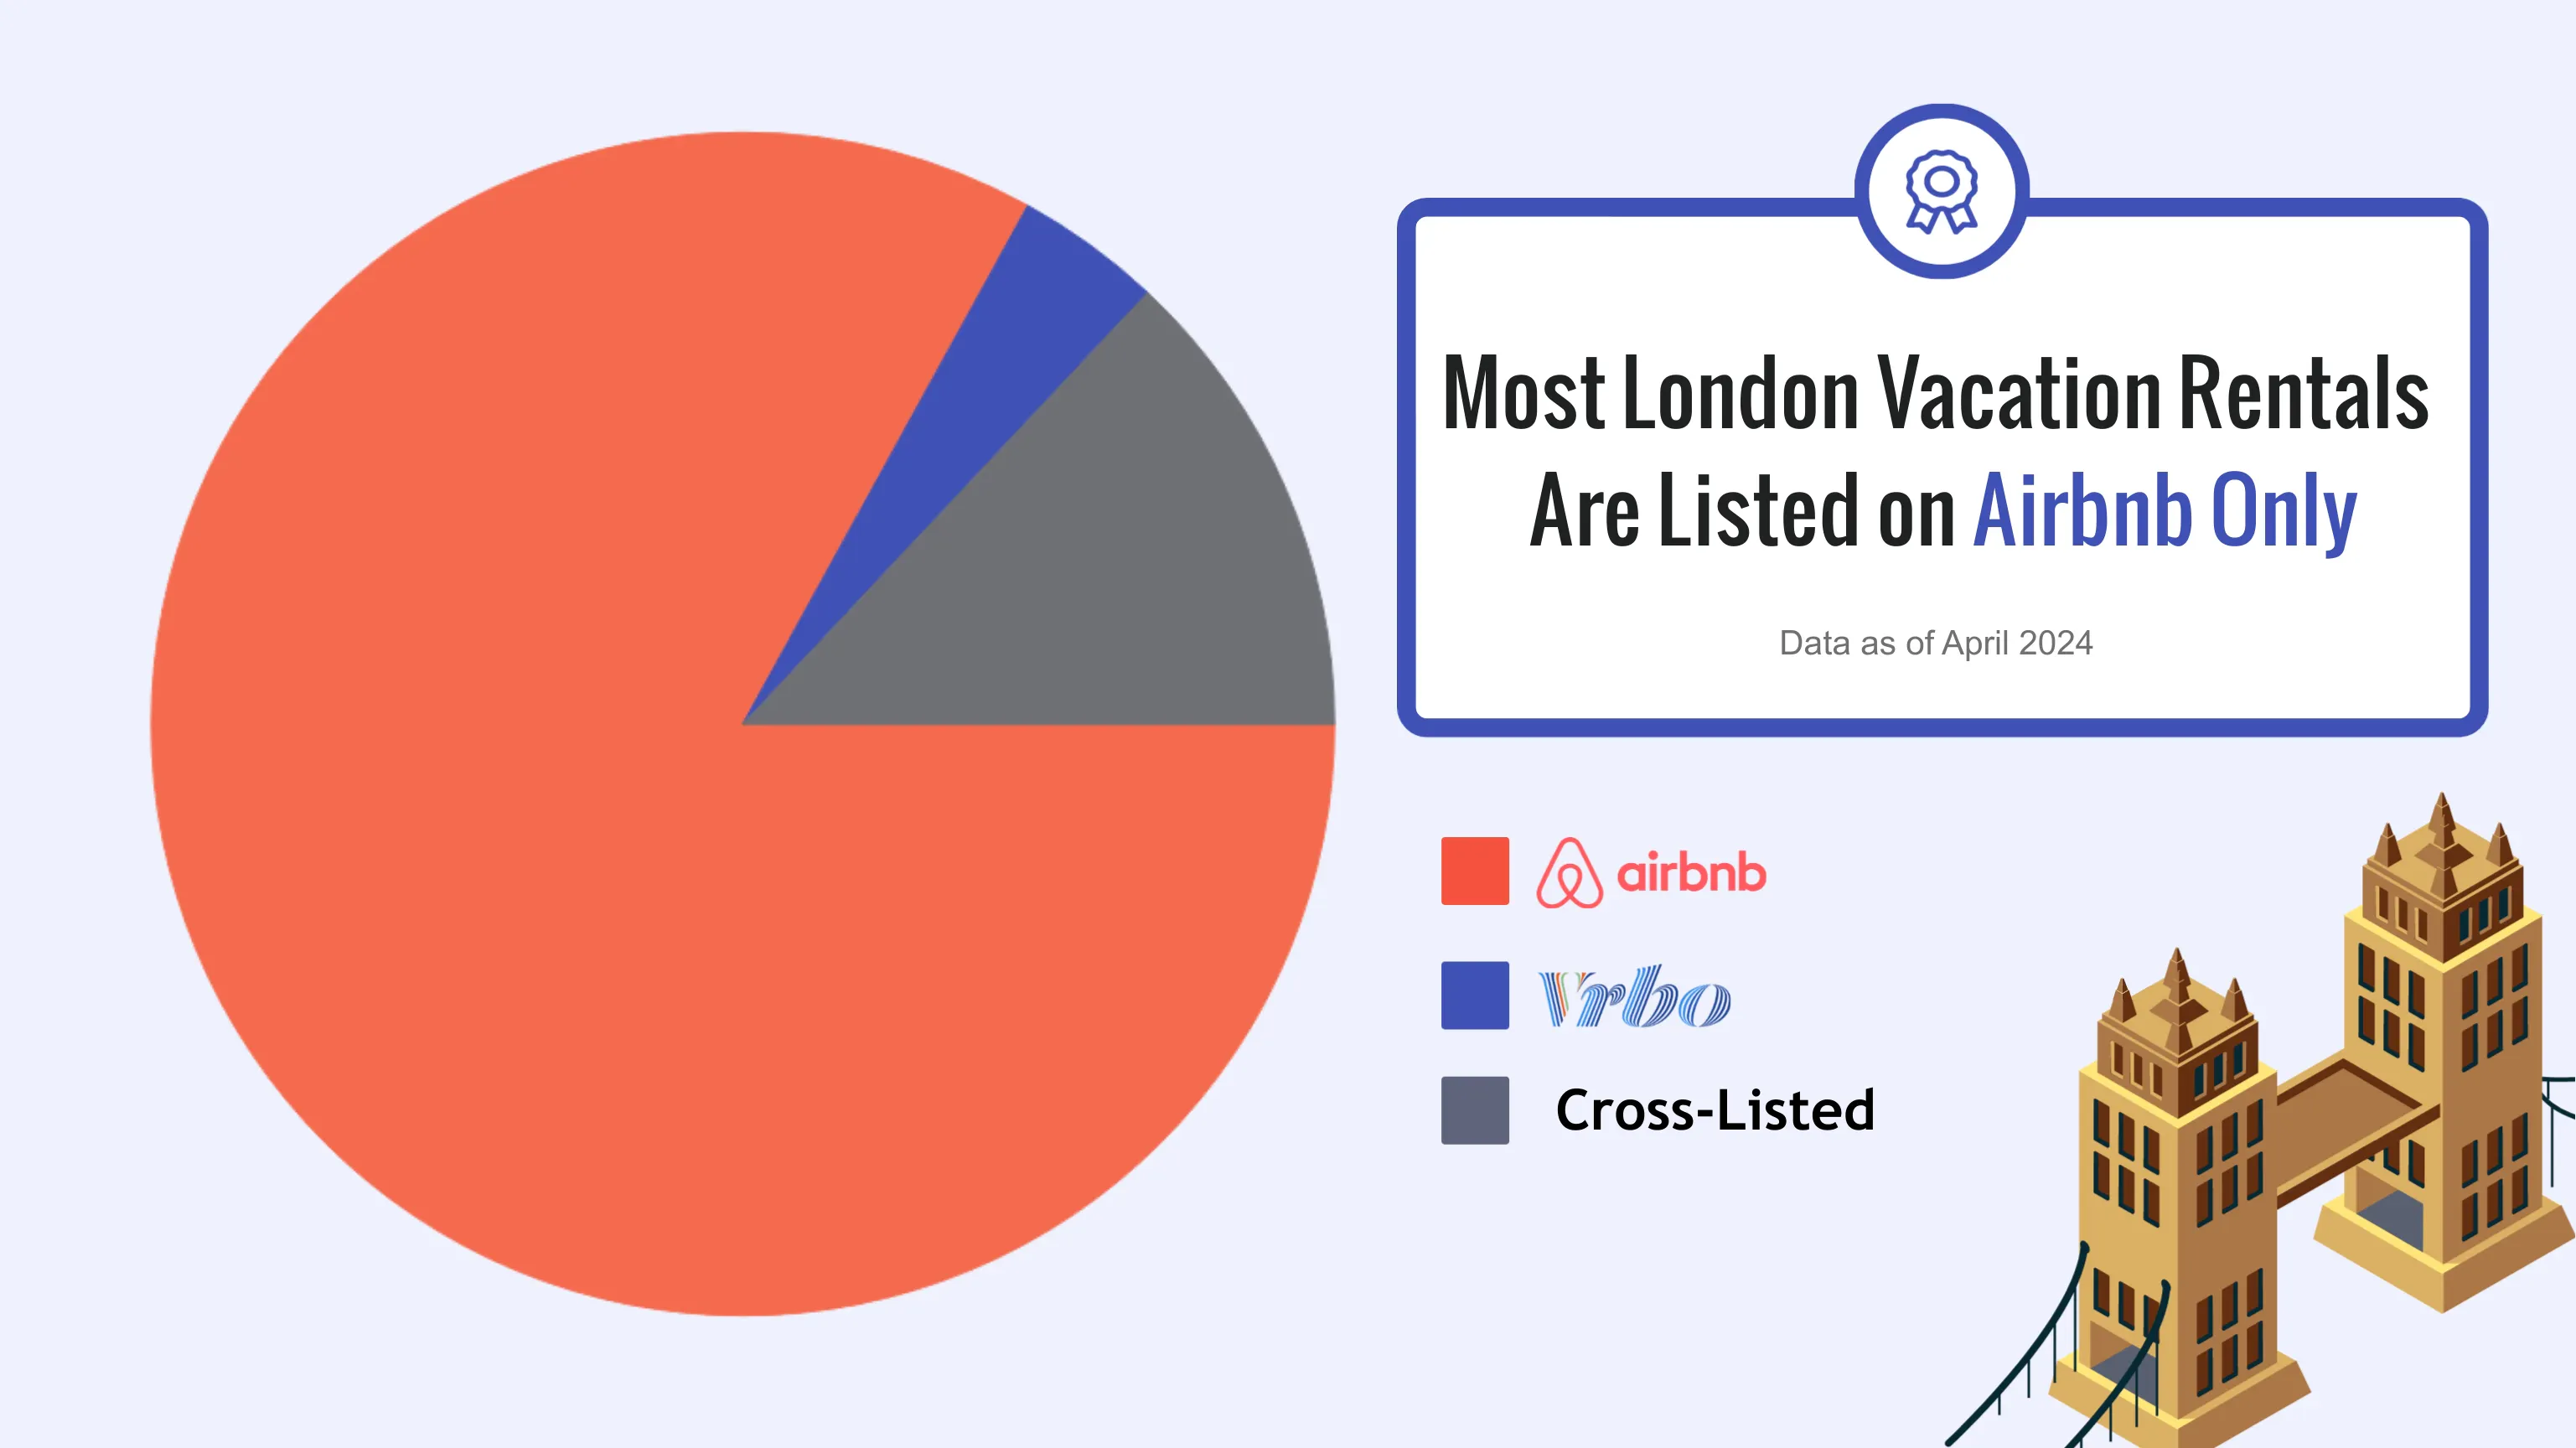
There's no question: London Airbnb hosts prefer to list on Airbnb over Vrbo. 83% of all hosts list only on Airbnb—that’s in stark contrast with the 4% who list only on Vrbo. Only 13% choose to list on both platforms.
Exploring London Through the AirDNA Dashboard
Did you know that you can self-access comprehensive short-term rental data using the AirDNA app? It’s all about knowing where to look. We’ll use performance data for London as an opportunity to walk you through how to review key performance metrics for any market of your choosing.
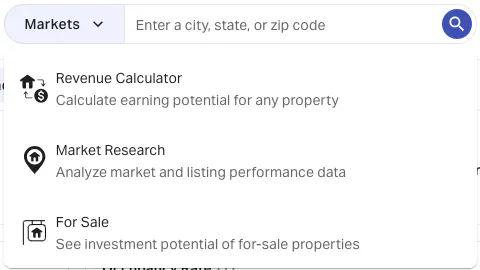
Start by inputting London into the top search bar on the AirDNA landing page, which is accessible through a free account.
Make sure you’ve selected Market Research from the drop-down menu of search features.
The market research results begin with a Market Overview of the chosen location. We showcase the overall Market Score as well as average annual revenue, occupancy rates, average daily rates (ADR), and revenue per available rental (RevPAR).
Just below are Market Performance Details. Here you’ll see some of the key performance metrics that we’ve already covered, plus some additional information.
The lower left hand corner graph on Rental Growth in the Last 3 Years, for instance, offers a visualization for the rapid supply growth that took off around April 2023. We discussed this trend in the previous section on Supply.
Occupancy
Under Market Performance Details, you can select from 5 tabs depending on the data that you’re interested in.

Alternatively, the data for each tab will pop up in order of the navigation bar as you scroll down.
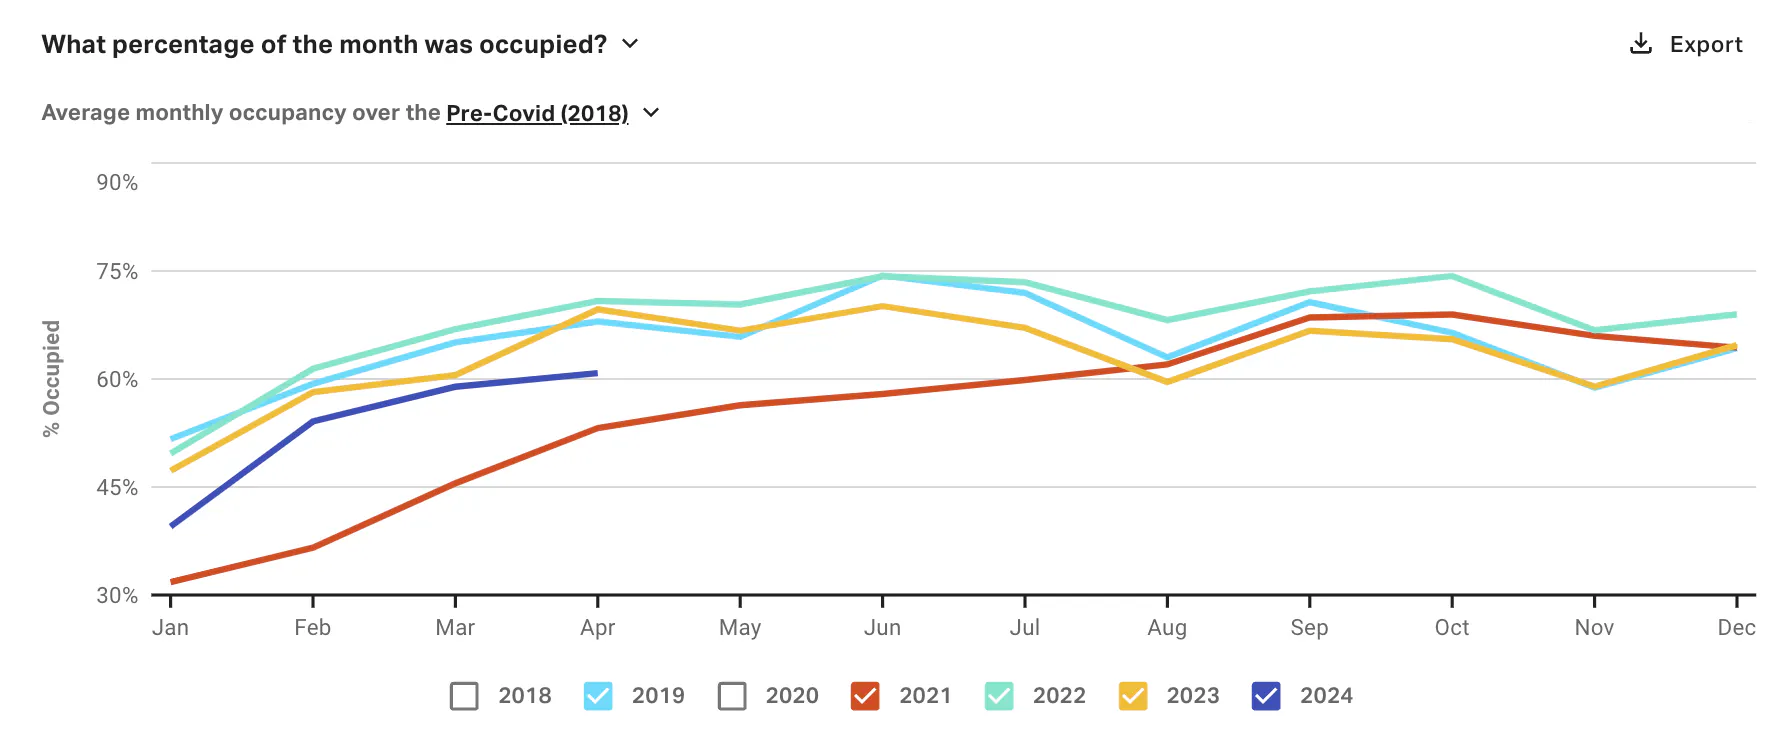
For the following graph on occupancy over the course of the year, we chose to look at data dating back to 2018. If you click the drop-down arrow next to Pre-Covid (2018), though, you can choose from the following additional options:
- Last 12 months
- Last 2 years
- Last 3 Years
In an effort to make the graph more legible, we excluded 2018 as well as 2020 data. Short-term rental data from 2020 is not representative of typical trends due to the pandemic.
Here are our key takeaways about London occupancy rates, based on the chart below:
- Occupancy in London reached record highs between the summer of 2021 and December 2022 when supply was slower to recover than demand.
- Since supply growth surpassed demand growth over the last year and a half, occupancies have been on the decline.
- Occupancy over the last 12 months averaged 61%, down 9% YOY.
- London’s occupancy rate over the last year has been tracking below 2019 levels.
As you can see, London short-term rental performance thus far in 2024 has been lagging behind all previous years with the exception of 2021.
Pro tip: You can explore other facets of occupancy and how it varies over the course of the calendar year by clicking on the drop down icon next to ‘What percentage of the month was occupied?’ and selecting from the following options:
- How long were guests staying?
- How many bedrooms did listings have?
- How does demand change over time?
- When are future reservations being booked?
Keep in mind that London is a massive city, and you can’t expect Westminster rentals to perform the same as Camden listings or properties in Southwark. That’s why we recommend exploring multiple neighbourhoods to get a clear sense of just how widely London’s average Airbnb occupancy rates vary. The AirDNA dashboard also allows you to compare STR performance on a submarket and an individual listing level if you want to get granular.
Monthly Revenue
Insights on Revenue follow the section on Occupancy in the AirDNA dashboard. The default chart shows how much revenue listings earn per month, but you can select from other options in the drop-down menu.
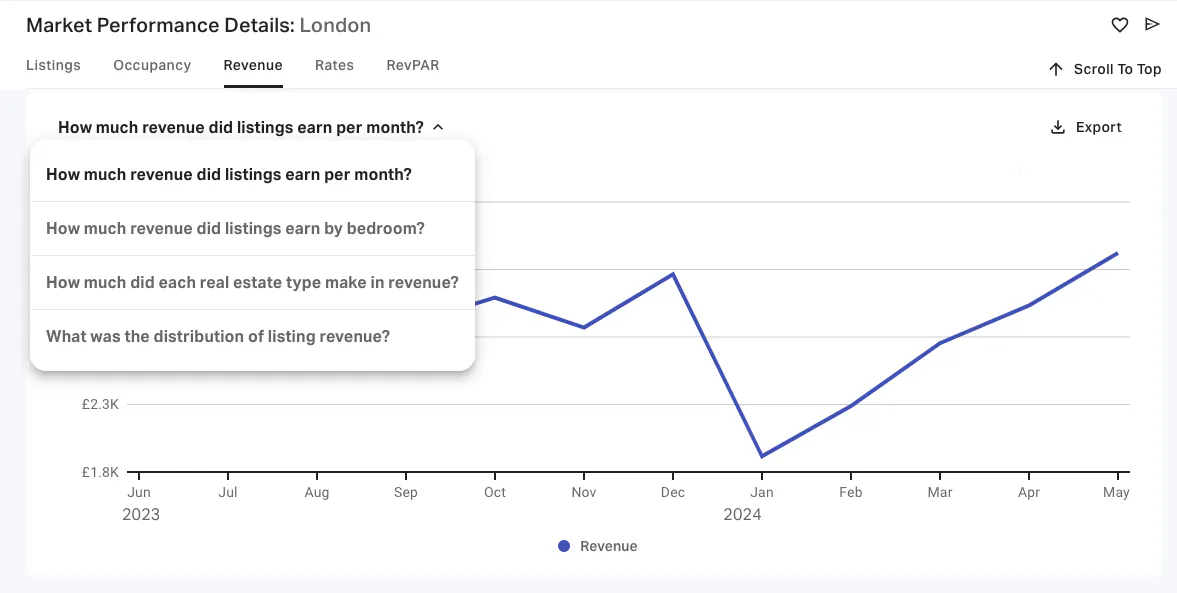
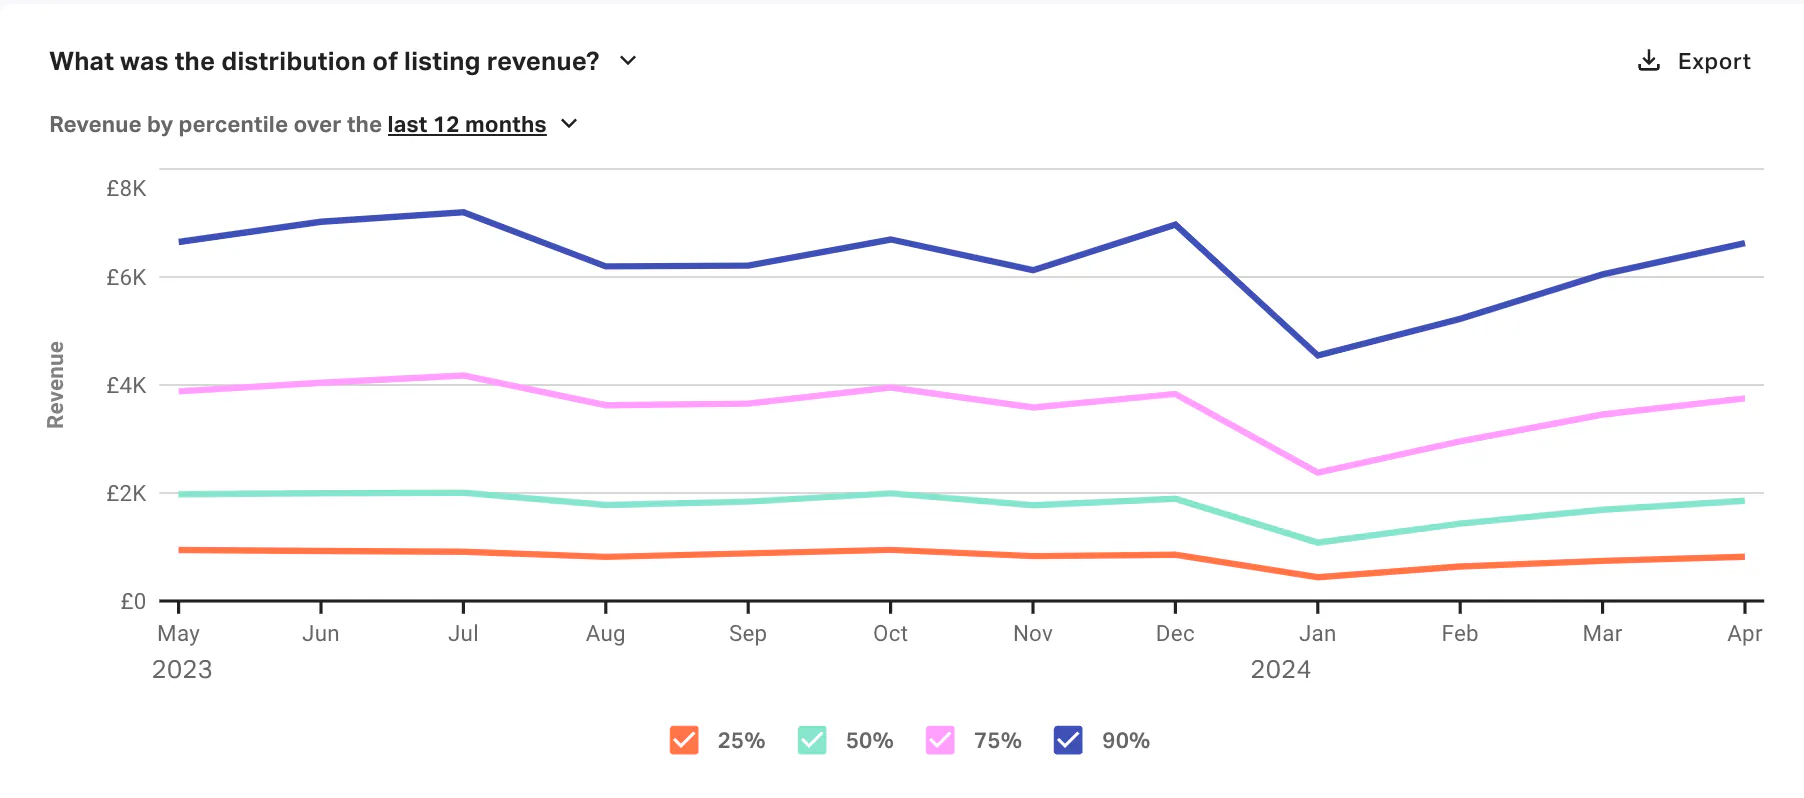
Average annual revenue for booked listings in London was £33K over the last 12 months, down 2% year-over-year (YOY).
Properties in the 50th percentile for revenue earned £21K in annual revenue over the last year, while top earning properties in the 90th percentile earned £75K.
Average Daily Rates (ADR) in London
Occupancy rates are a great place to start when choosing the right neighbourhood. However, occupancy doesn’t tell you how much Airbnb hosts earn in those neighbourhoods. While a host in Covent Garden may earn more than one in Vauxhall, London’s average daily rate (ADR) can indicate how the city performs as a whole.
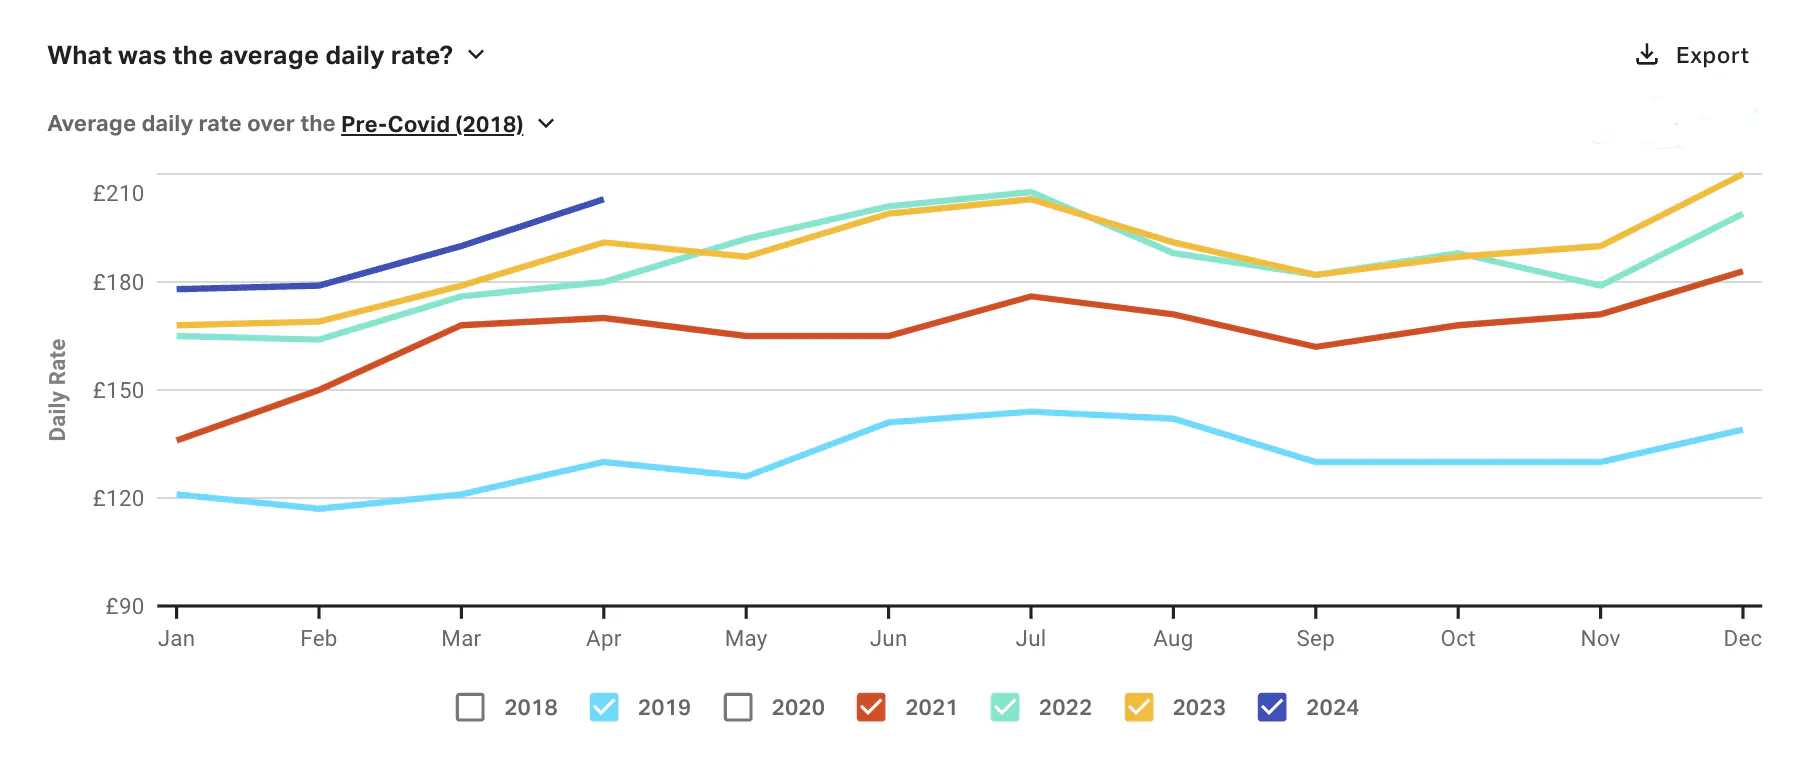
The average daily rate (ADR) in London was £191 over the last 12 months.
If you scroll past Revenue on the Market Performance Details landing page for London, Rates are up next.
Inflation and slow supply recovery all played a large role in rapid ADR growth in the latter half of 2021 and throughout 2022 (red and green lines on the chart). Average ADRs between 2019 and 2022 jumped an astounding 41%.
ADR growth in London didn’t start slowing until early 2023 when occupancy growth started to slow. Declining occupancy goes hand in hand with declining demand, which means more unbooked nights for hosts and consequently less pricing power.
In the last 12 months, YOY ADR growth has slowed to 2%. Despite slowing growth, you can see on the chart that ADR in 2024 is so far tracking higher than in all previous years.
London ADR by Bedroom Count
Let’s look at how much ADRs differ based on bedroom counts. You can explore the data from this angle by selecting the corresponding question from the drop down menu by ‘What was the average daily rate?’
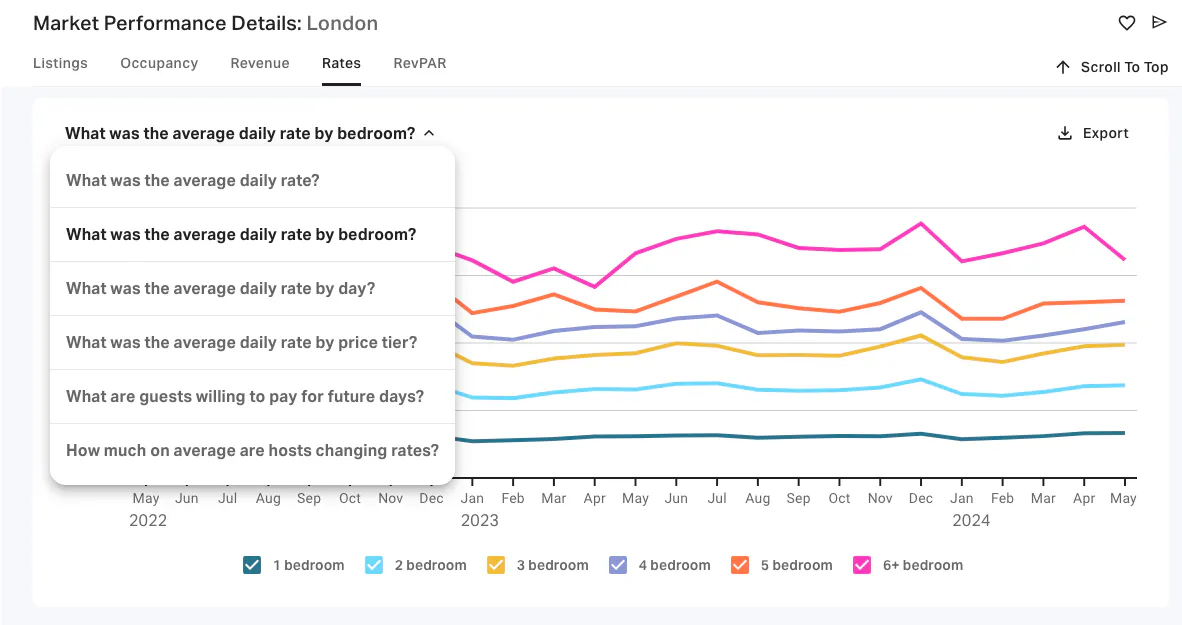
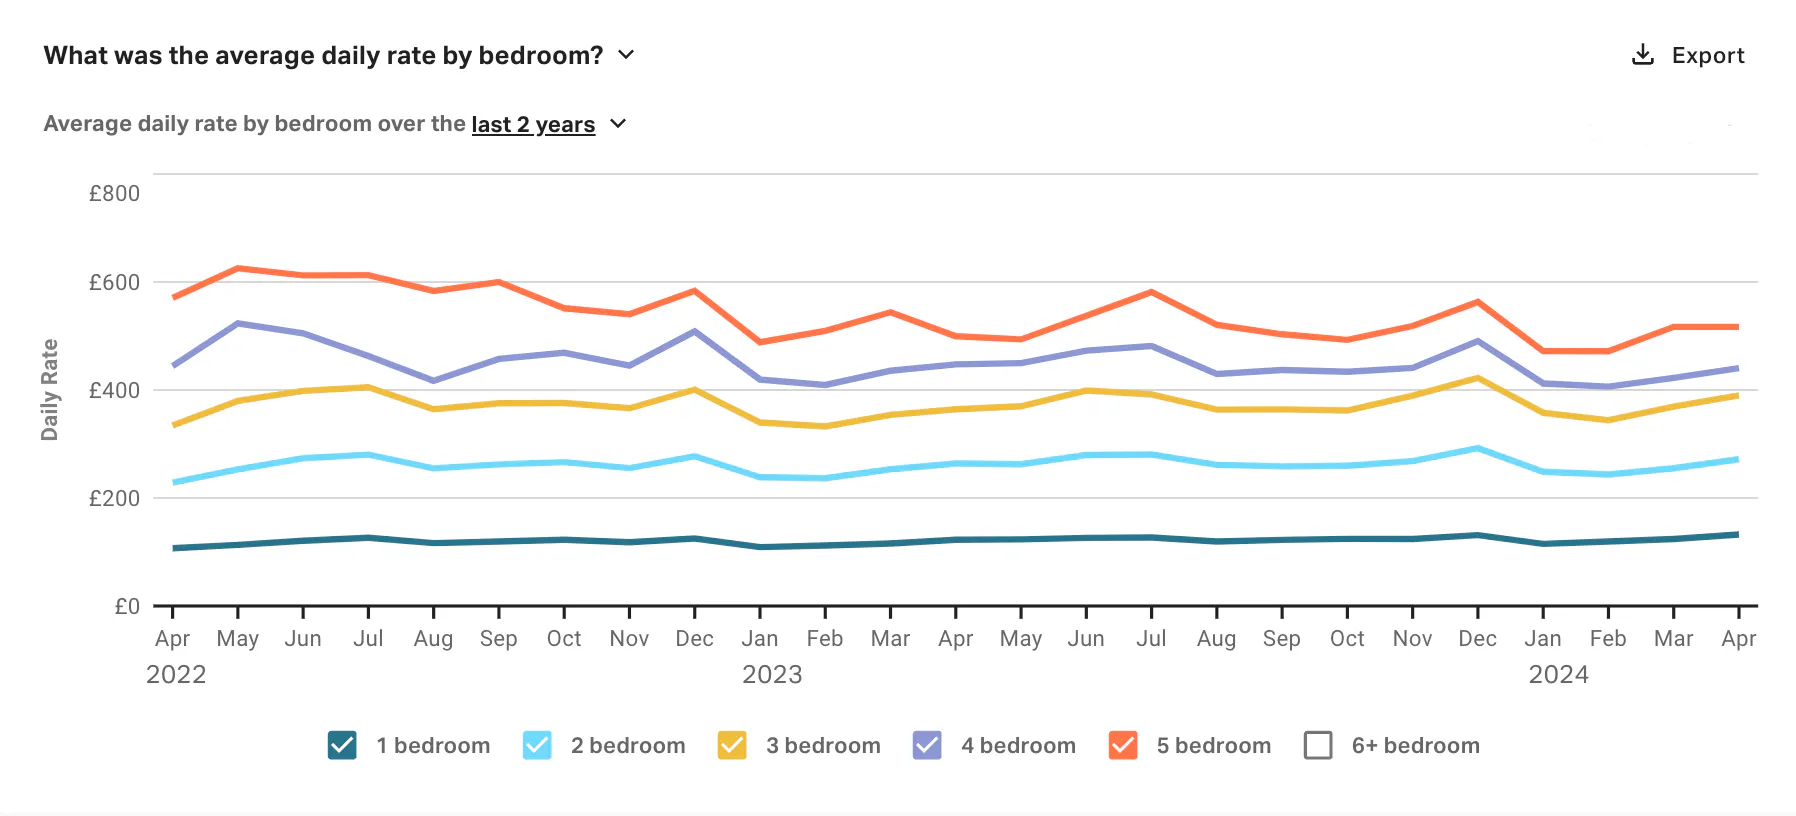
Don’t forget to select the timeframe that you’re interested in—in this case, we want to look at the last two years.
The data shows that rate growth over the last year has favored properties with smaller bedroom counts. One and two bedroom properties have seen modest but positive year-over-year (YOY) growth in ADRs, while rates for properties with 4-5 bedrooms have fallen YOY.
London ADR by Price Tier
Luxury short-term rental accommodations in London cost a pretty penny. Over the last year, the average ADR for a luxury 2 bedroom property (£446) was more than 3X the average ADR for a budget 2 bedroom property (£133).
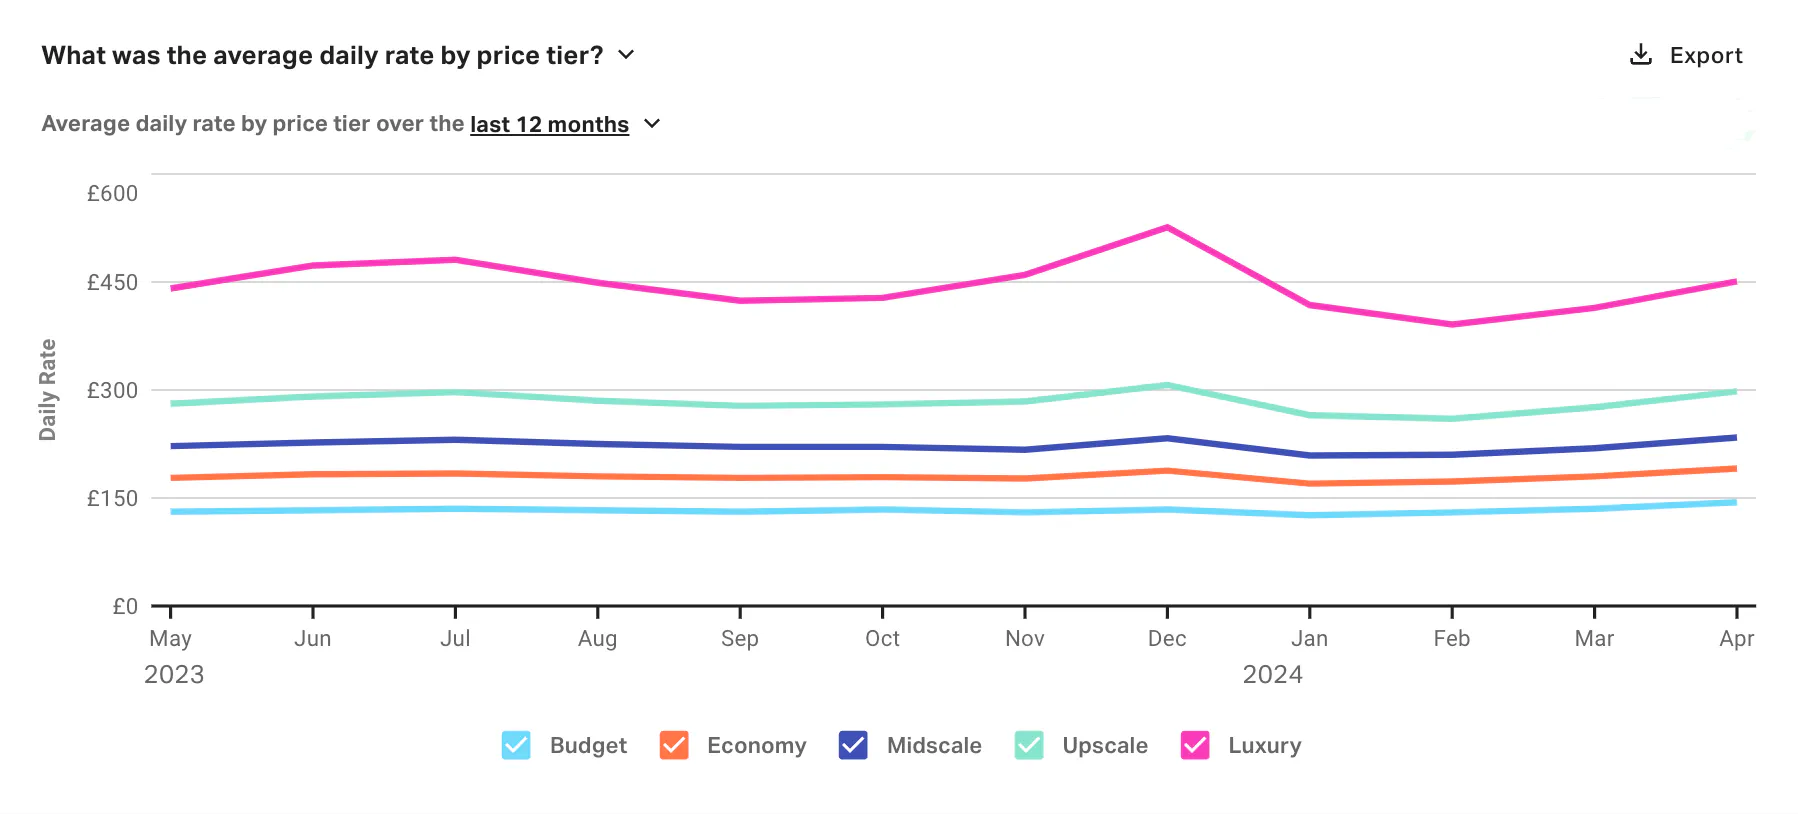
Pro tip: You can filter the Market Performance Details to better match your property by using the Listing, Performance, and Amenities drop down menus beneath the search bar at the top of the page.
Do you have a luxury 4-bedroom home in London that is professionally managed and only available to rent during the summer months? Select for those features and see how properties with similar attributes are performing.
Under Listing, you can sort by:
- Listing type: Entire Place, Private Room, Shared Room
- Real Estate Type: Apartment, B&B, House, Unique
- Number of bedrooms
- Number of bathrooms
- Number of guests that the property accommodates
Under Performance, you can sort by:
- Price tier: Budget, Economy, Midscale, Upscale, Luxury
- Professionally managed or not
- Property Manager or Airbnb Host ID
- Number of units operated by host
- Number of days available per year
- Guest rating
- Number of reviews

Looking Forward: Demand Pacing in London
Pacing is the rate at which reservations are made for a particular date in the future. Under the Rates section of London’s Market Performance Details, you can select ‘What are guests willing to pay for future days?’ to get a sense of what time periods are popular and at what prices.
Note that we deselected Daily Rates in the graph snapshot below and the bars represent only the total number of booked nights for each date.
Taylor Swift’s Eras Tour is currently driving the biggest STR demand spikes in London this summer. Swift is scheduled to perform in London June 21-23 as well as August 15-20th. Booked nights for Swift concert dates is up 20% compared to demand for the weeks prior.
Current demand on the books for June, July, and August is up 21% YOY.
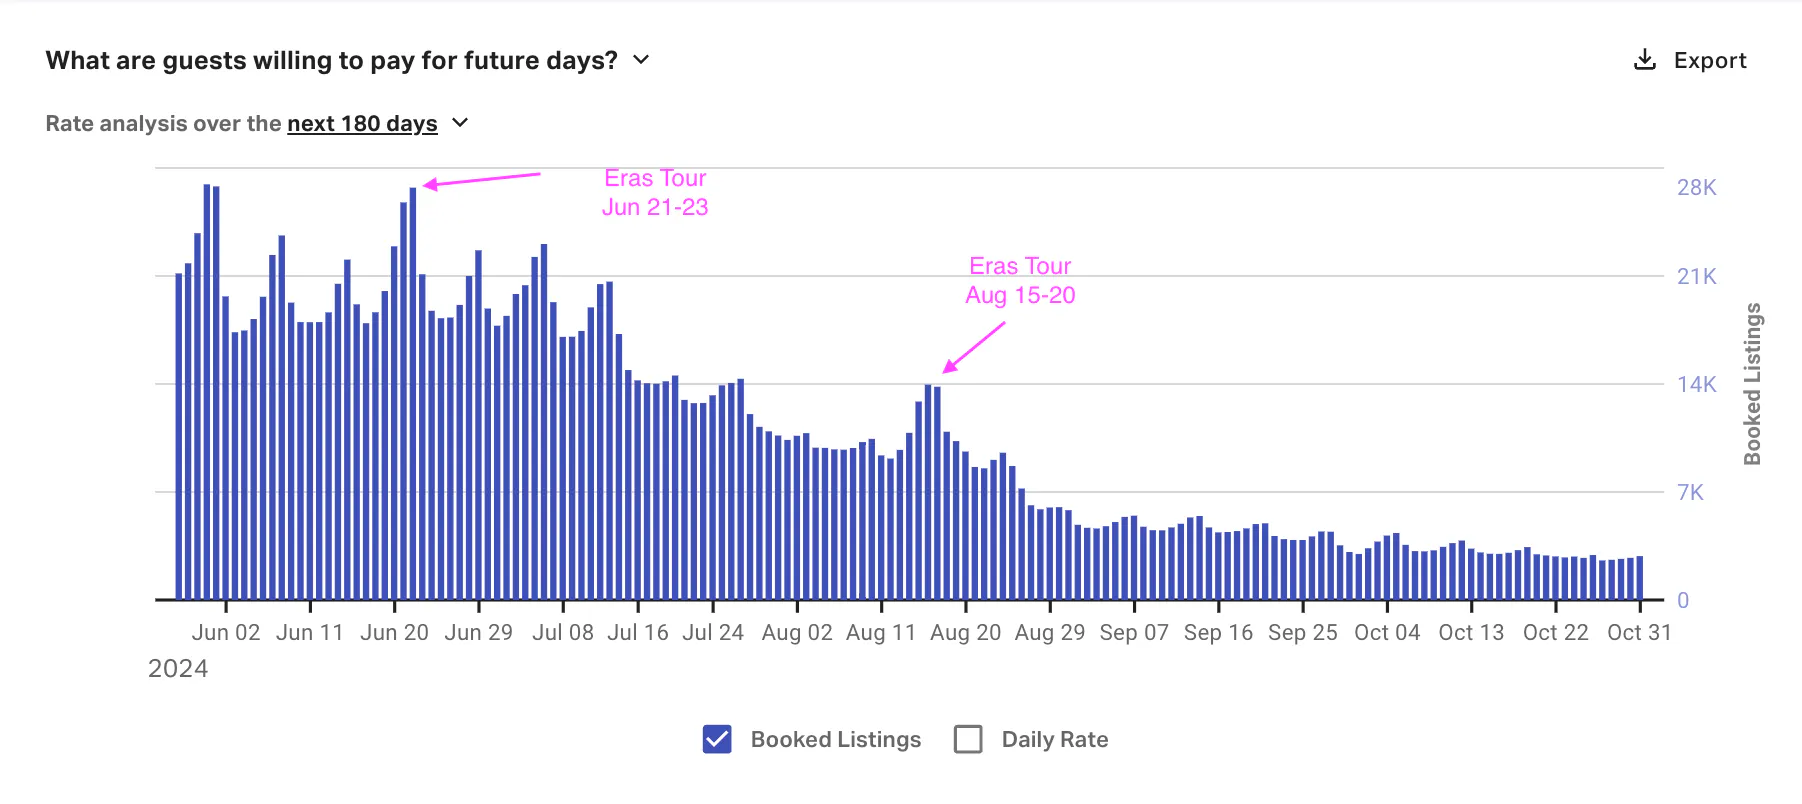
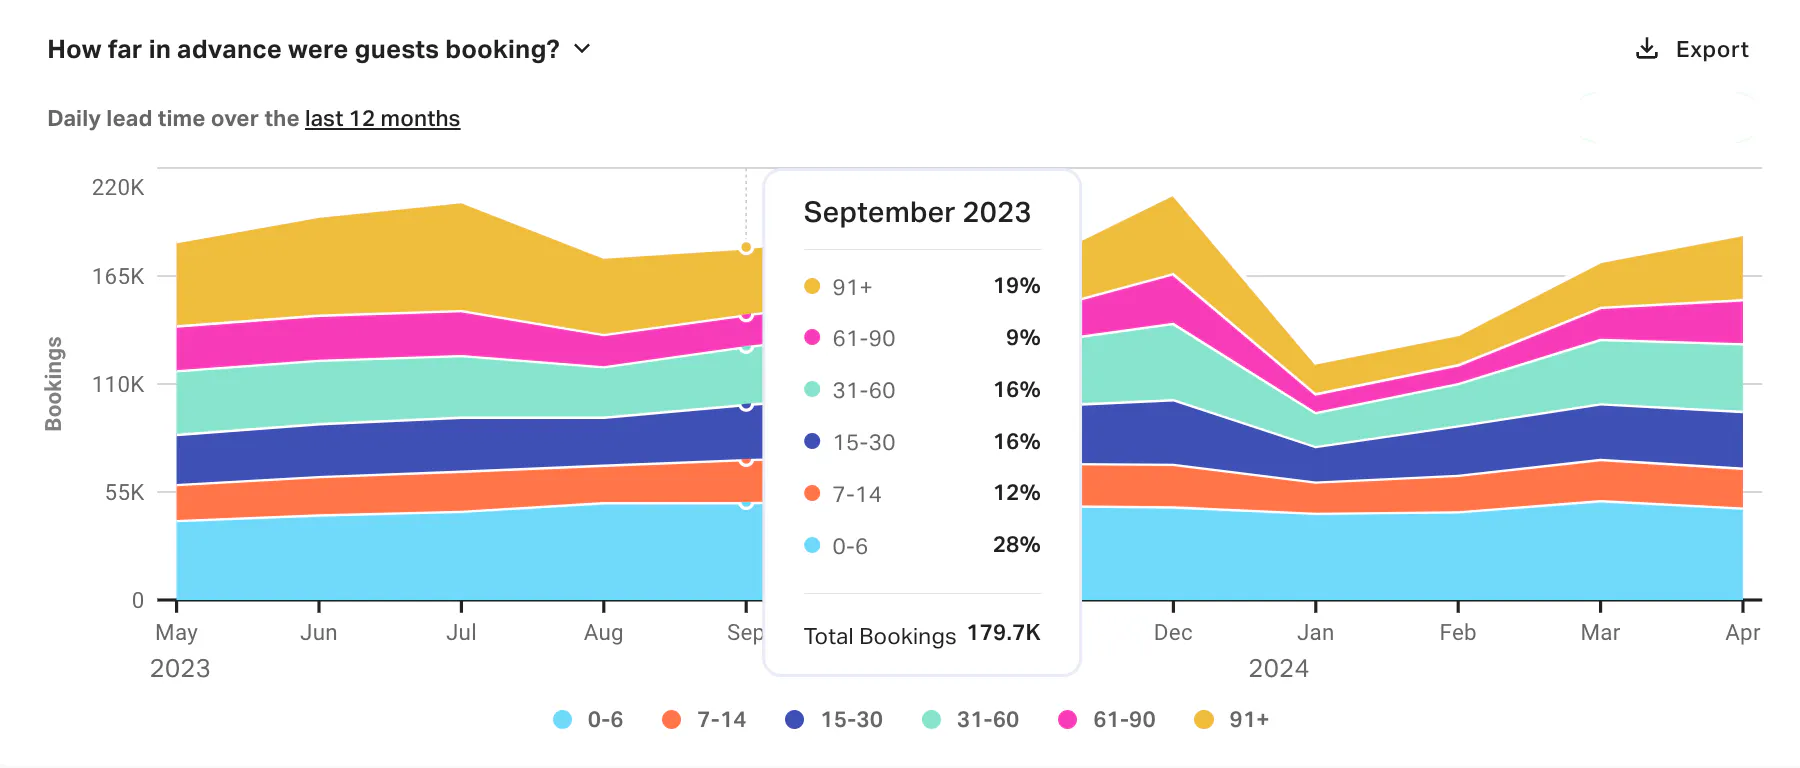
The chart indicates that bookings hover between 14k and 28k per night June through August, but are less than 7k per night for September and October. Why is there such a large drop off in bookings? Looking at how far in advance guests typically book provides an answer.
The following graph can be found under the RevPAR section of the Market Performance Details, which follows the section on Rates. You can find this data slice by selecting the drop down menu by the default question, ‘What was RevPAR?’
Demand pacing data for the last twelve months indicates that 40% of bookings made for September stays were reserved within two weeks of the guests’ stay. Only 19% of September stays were booked more than 90 days out last year. The point is, we are still very early into the booking window for fall stays. Hosts can expect more reservations for fall dates to come in later this summer.
Revenue Per Available Rental (RevPAR)
While ADR is what London Airbnbs charge, on average, RevPAR measures what they actually earn each night. You can calculate your own RevPAR by dividing your annual revenue by your nights available.
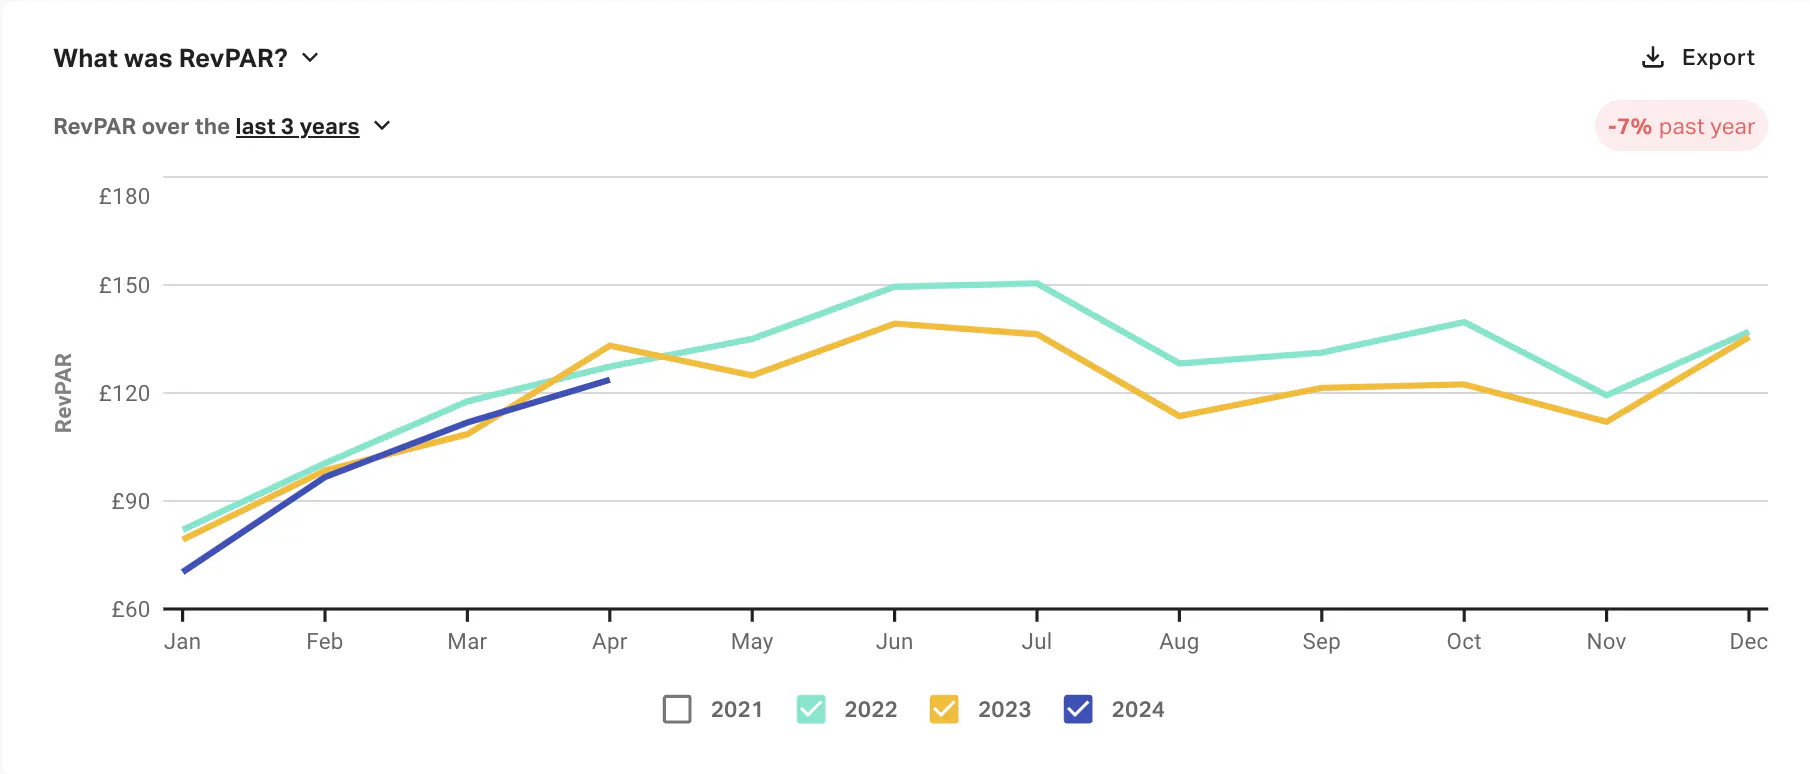
RevPAR is the final Market Performance Detail category in the AirDNA dashboard when you’re exploring a location using Market Research as a filter. The default chart shows RevPAR over the last 12 months, but we’ve selected for the last 3 years in the snapshot below to explore trends across a larger time period.
Declining occupancy and weak ADR growth has led to declining RevPARs. Average RevPAR in London over the last year was £117, down 7% YOY. Higher occupancy and ADR premiums during the summer months and around Christmas translates to peak RevPARs in June, July, and December.
Master Your Next London Airbnb Investment
In a market as dynamic as London's, the ability to harness actionable London short-term rental (STR) data is the cornerstone of long-term success in the STR industry. After all, the boroughs Londoners love may be very different from those travelers want to visit.
Though our London market data only validates the city’s potential, don’t forget to get granular. Learn how to strategically select a property in any market, anywhere, with our Airbnb investment guide.
Frequently Asked Questions (FAQ)
Are short-term rentals allowed in London?
Yes, short-term rentals are allowed in London, but hosts must adhere to short-term rental regulations set by local authorities. Regulations might include obtaining planning permission and complying with safety standards. Additionally, hosts must stay compliant with lease agreements, building regulations, and any homeowner association rules that may apply to their property.
What is the 90-day rule for Airbnb in London?
Since 2017, the 90-day rule for Airbnb in London restricts hosts from renting out their entire property for more than 90 days in a calendar year without getting planning permission for short-term lets. As a result, 50% of properties in London are available for 90 days or less. The remaining 50% of properties operate as mid - long term rentals
This regulation aims to balance the growth of short-term rentals with the need for affordable long-term housing. It’s also meant to ensure that properties are not permanently removed from the residential market.
ARTICLE SUMMARY
Peel back the curtain on London short-term rental data and see how this iconic city performs. We cover occupancy rates, average daily rates, demand pacing, and more.
Jamie Lane
AirDNA Chief Economist
He is responsible for data analysis, thought leadership, and leveraging advanced analytical techniques to provide new insights into short-term rental market trends. Native to Atlanta and an Airbnb host himself, Jamie enjoys cycling, mountain biking, backpacking, running, and playing in a dart league in his free time.
