

 Calculate Revenue
 Research Markets
 Find For Sale Properties
 Compare My Listing
 STR Revenue Calculator
 Custom Comp Sets
 Submarket Insights
 Custom Search Filters
 Rate Recommendations
 Performance Benchmarking
 Competitor Comparison
 Owner Contact Details
 Property-level performance data
 Tourism Insights
 Real Estate Investment Analytics
 About Us
 Sales
Sales Support
 Press
PressAirbnb Seasonality and How to Maximize Profits Year-Round
Published: May 13, 2026
Last updated: August 4, 2026

Bram Gallagher
Key Takeaways
- Seasonality refers to the cyclical variation in traveler demand throughout the year.
- High seasonality markets can offer lucrative peak periods but come with increased risk, while low seasonality markets provide more consistent year-round income.
- Understanding seasonality helps hosts optimize pricing, attract diverse guest segments, and stay profitable across different times of the year.
If you're an Airbnb host in a beach town, ski resort, or any destination where bookings surge and ebb with the seasons, you know the impact of seasonality on your bottom line. But how well do you really understand these patterns, and are you making the most of them?
Airbnb seasonality in the short-term rental (STR) market isn’t simply about identifying peak months and increasing your prices. A true understanding of seasonality means recognizing the shifting patterns that can make or break your investment.
While some markets still heavily rely on peak seasons, others see more consistent demand throughout the year. Understanding where your property fits in this spectrum is crucial for maximizing your revenue.
At AirDNA, we've analyzed millions of listings to uncover the most and least seasonal markets in the U.S. We'll explore what makes a market "seasonal," how it affects your property's performance, and strategies to thrive no matter the season.
What Is Airbnb Seasonality?
Seasonality is the cyclical variance in traveler demand throughout the year that's unique to each vacation rental market. Think of ski towns bustling with visitors every winter, then quieting down as the snow melts. It's arguably the most defining characteristic of a short-term vacation rental market.
While some markets enjoy a steady stream of bookings year-round, others earn the lion's share of their revenue in a short window. But here's the catch: high seasonality can be a double-edged sword. Those lucrative peak seasons? They come with increased vulnerability in the off-season. Relying on such a short time frame can be a gamble.
That's why understanding and leveraging your market's seasonality (or lack thereof) is crucial for maximizing profits.

The Three Vacation Rental Seasons
Let's explore how seasonal patterns play out across different markets.
Peak Season
Peak season is when demand—and revenue—hit their highest points. However, the timing of peak season varies significantly depending on the location.
In Aspen/ Snowmass, Colorado, for example, the winter months reign supreme. Our data shows that Aspen/ Snowmass hosts can earn upwards of $1000 per night during ski season, making it a true winter wonderland for short-term rental income.
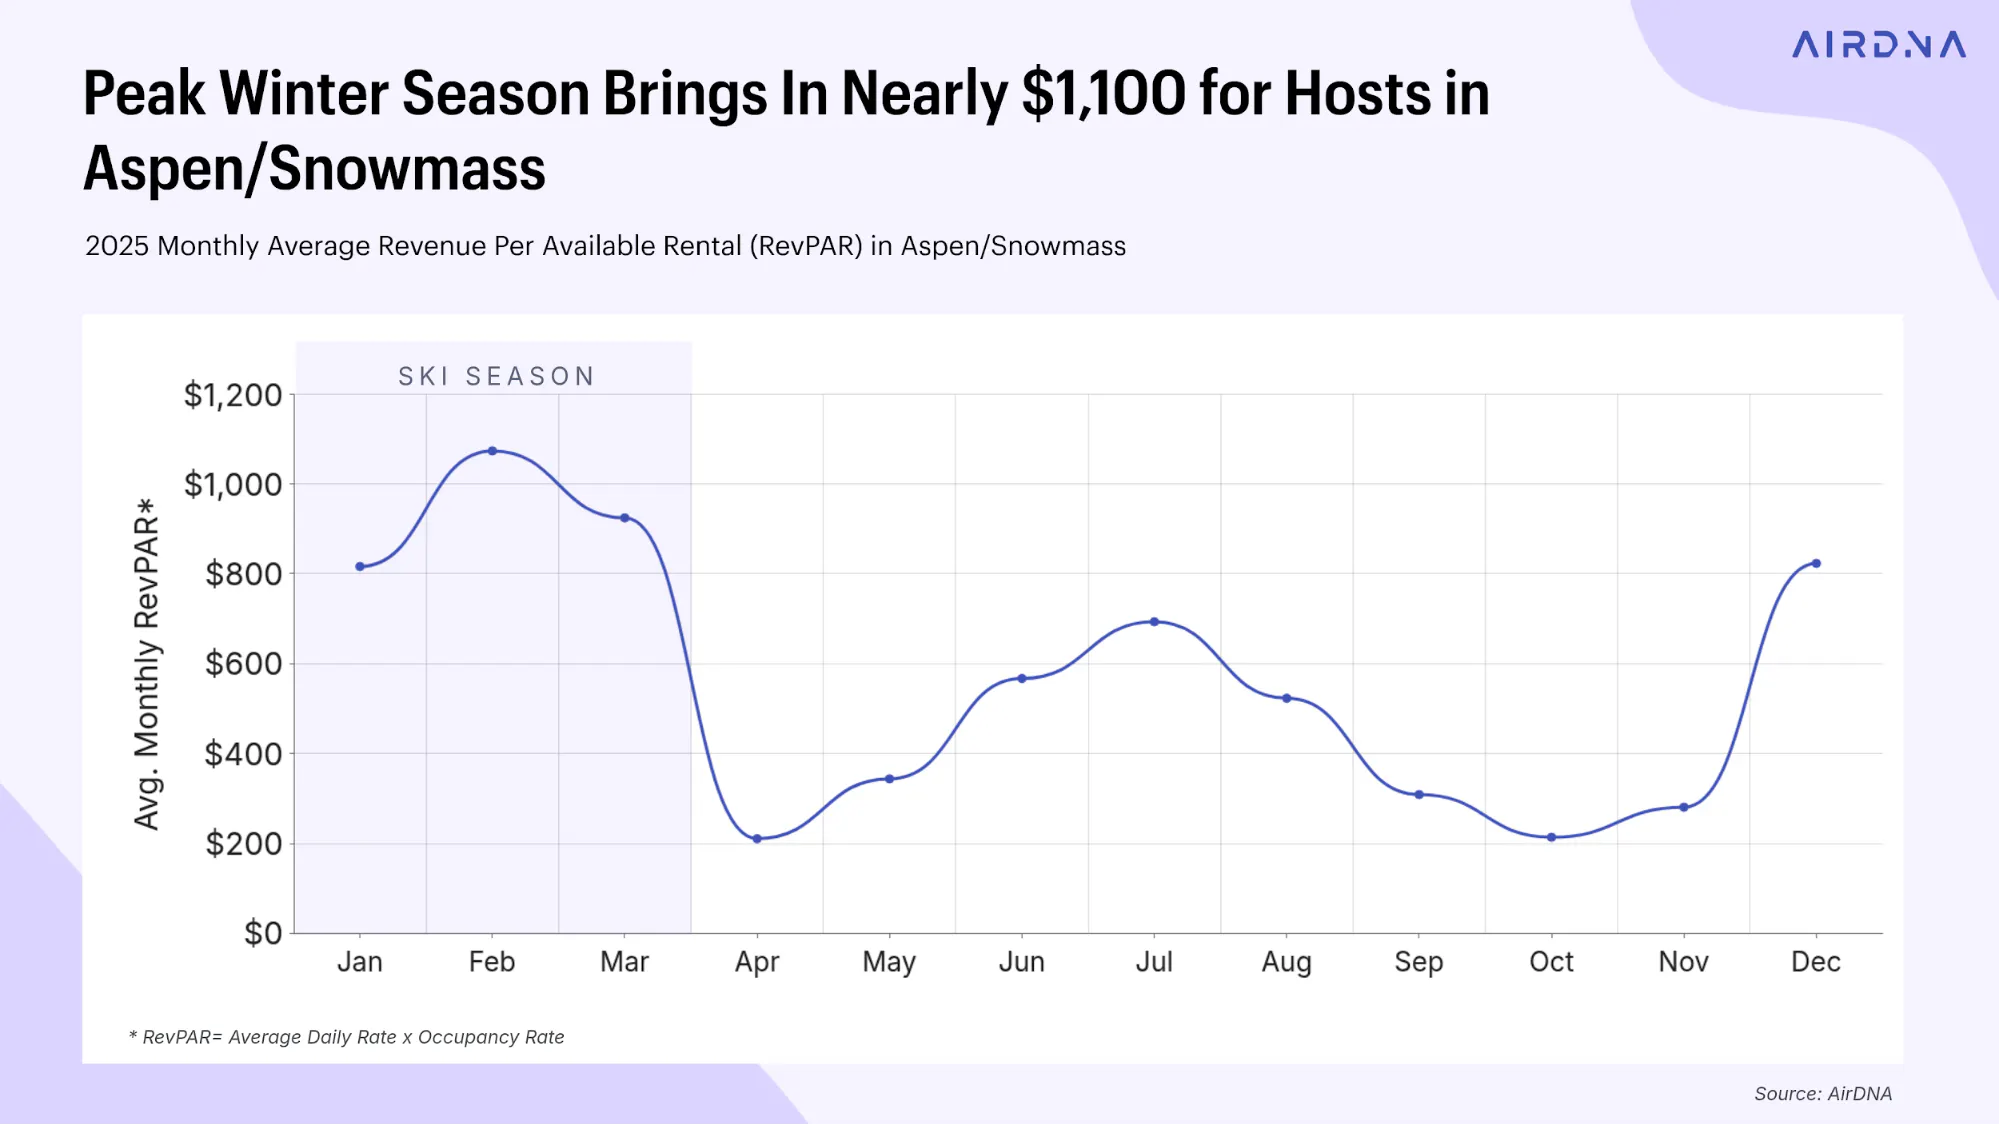
However, the national trend tells a different story. As you can guess, summer is America’s peak STR season.
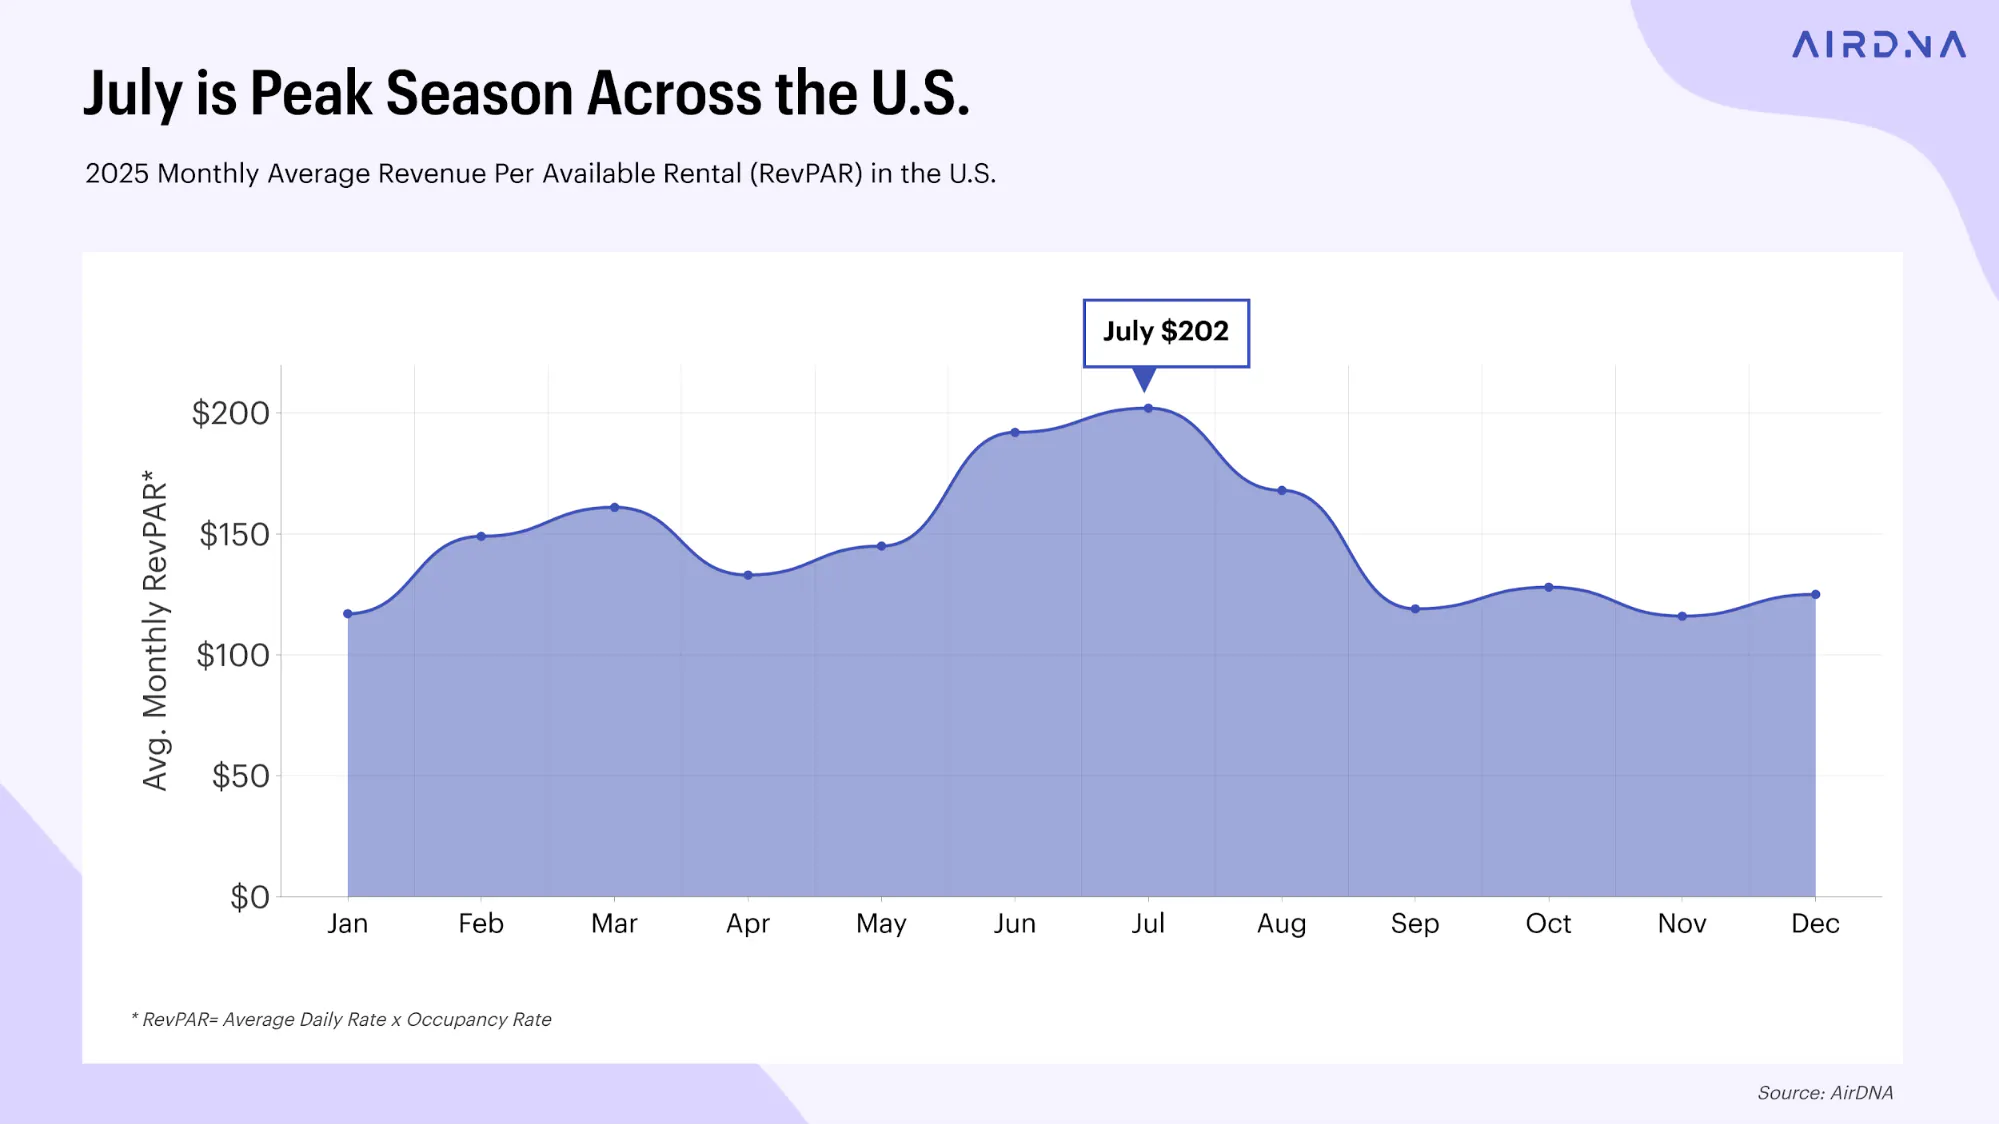
Across the U.S., July emerges as the peak season, with RevPAR (Revenue per Available Rental) reaching its highest point. This aligns with traditional summer vacation patterns when warm-weather destinations see a surge in visitors.
Shoulder Season
The shoulder season, the period between peak and off-peak, is becoming increasingly influential in the vacation rental market.
We're seeing evidence of expanding shoulder seasons in some markets. The Jersey Shore provides a great example. Prior to the pandemic, visitors to the Jersey Shore peaked in August. The average occupancy rate for that month was 76.7% in 2019. From there, occupancy rates fell below 30% in October before rising slightly, to around 35%, in November and December.
Since the pandemic, however, occupancy trends have shifted. August in the Jersey Shore did not reach as high a peak in 2025 (75.2%), and vacation rentals saw more guests in the fall shoulder season instead. Occupancy during the month of October grew by approximately 40%, while November and December occupancy increased by almost 20% between 2019 and 2025.
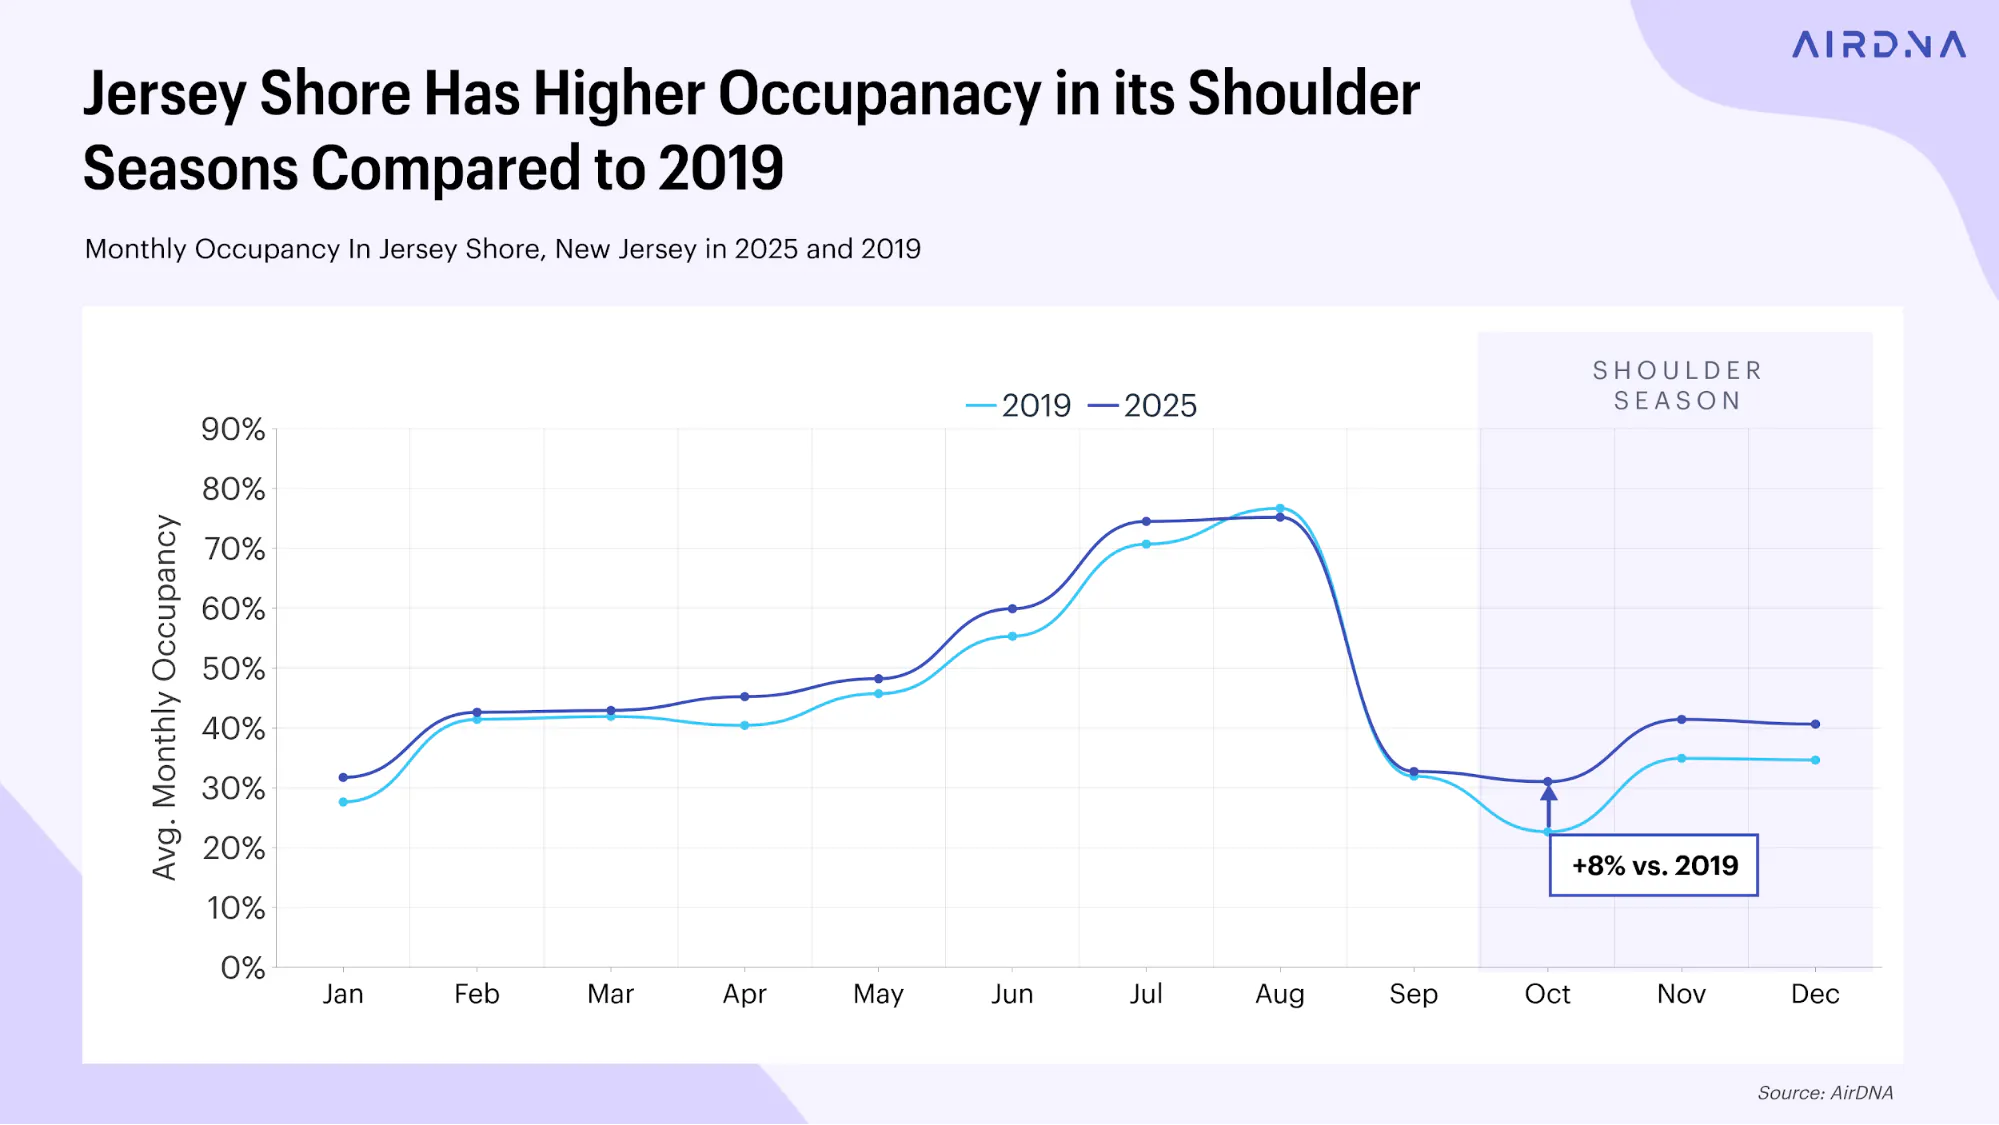
This change provides some subtle clues that travelers are less beholden to an arbitrary vacation schedule than they used to be, in part due to remote work. The data also suggests that some travelers are purposely avoiding the busiest times of year to escape crowds and high prices.
For property owners in areas seeing this trend, it's a chance to make more money during what used to be slower months. Keep in mind, though, that every location is different. If you’re looking to succeed in STR hosting for the long haul in a seasonal market, it’s important to keep a close eye on trends over time.
Off-Season
The off-season is typically when demand and prices are at their lowest. However, the timing of the off-season can vary dramatically by location.
Take Myrtle Beach, South Carolina, for example.
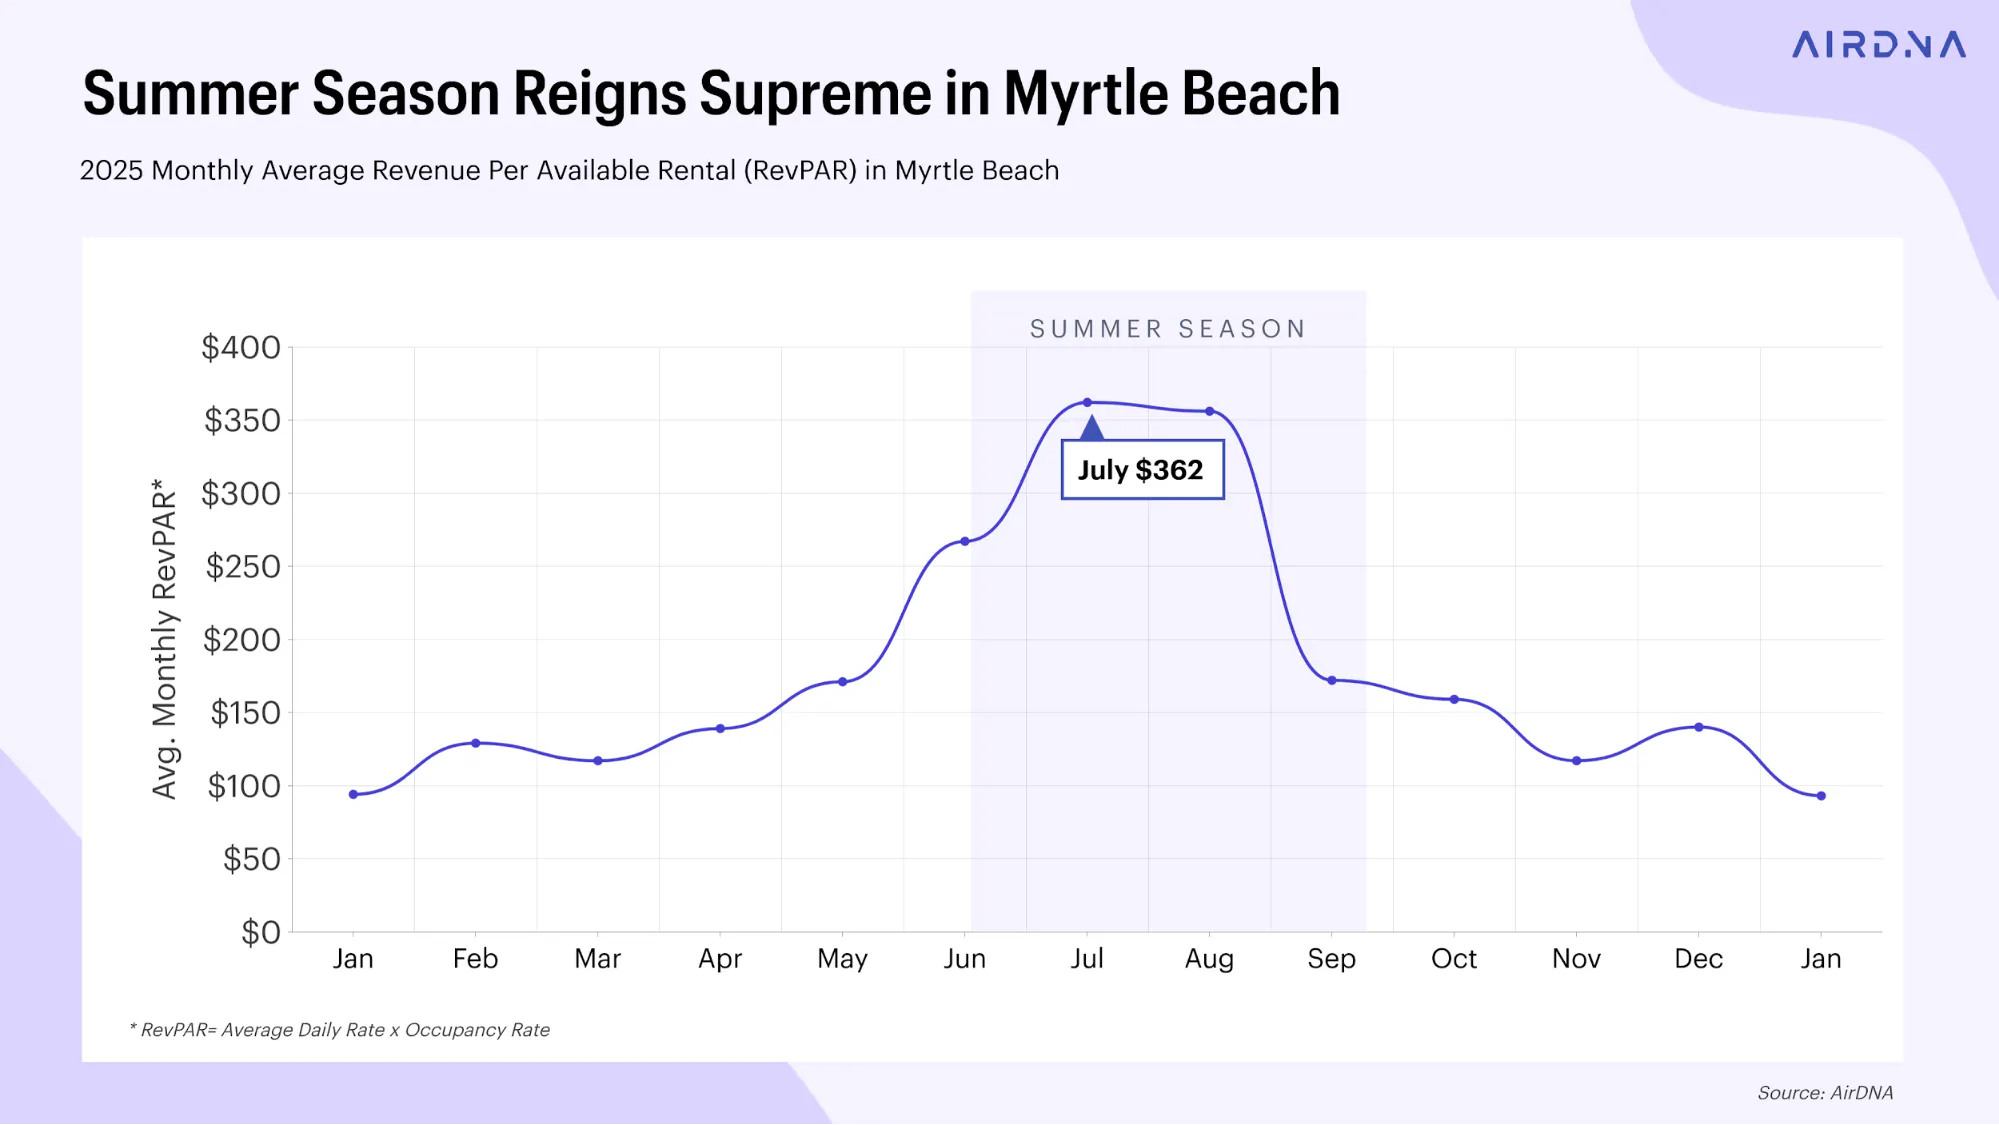
The data shows that Myrtle Beach follows a pattern similar to the national trend, with peak RevPAR in June and July. However, it gets an interesting boost in March and April, likely due to Spring Break travelers. The off-season here is clearly visible from November through February, when RevPAR drops to its lowest levels.
Now, let's look at Phoenix/Scottsdale, Arizona.
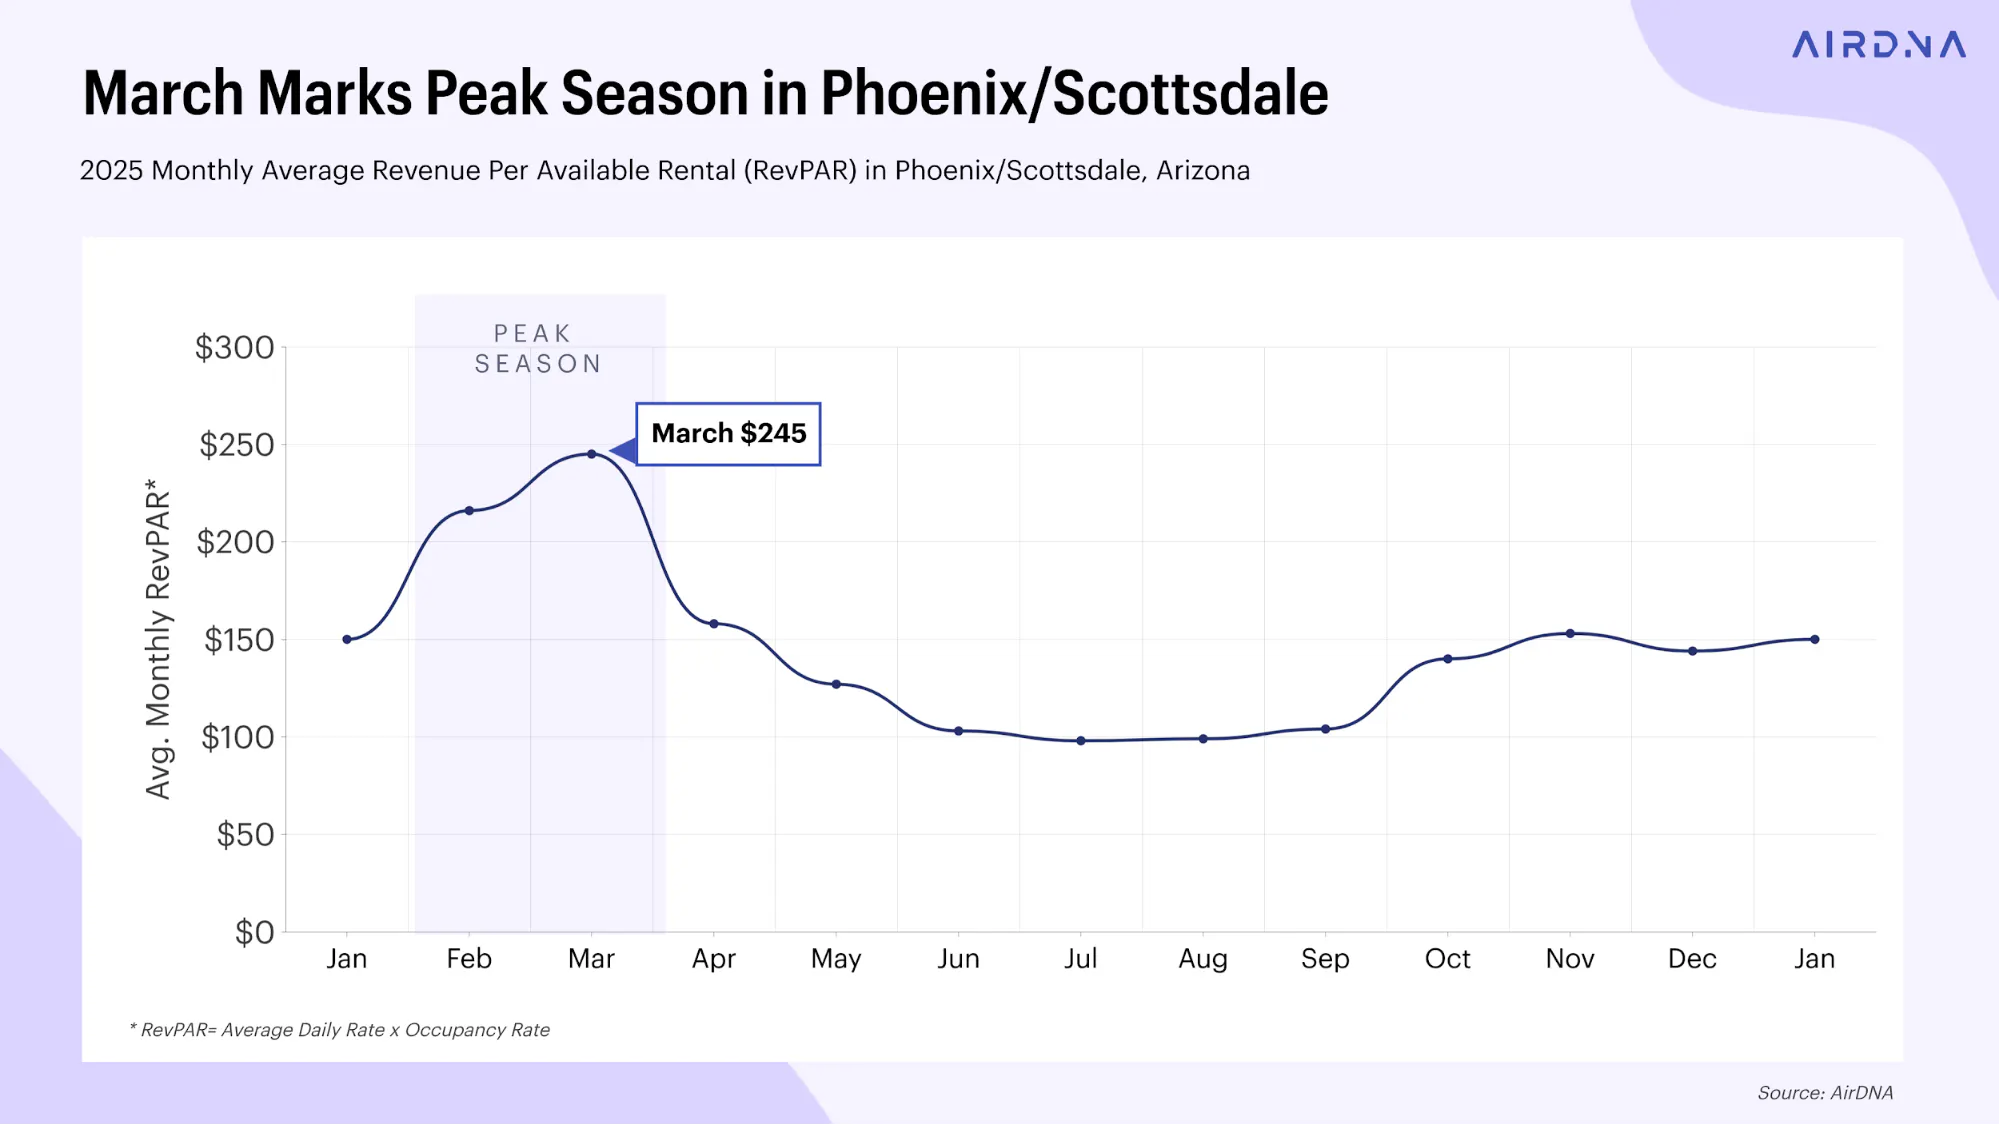
Here, we see a completely different pattern. The peak season is actually in February and March, when RevPAR reaches upwards of $245. Summer is the off-season in this desert destination, with June through September bringing in about $100 in RevPAR.
Why the inverse graph? An Airbnb seasonality pattern like this is likely due to the extreme summer heat in the region. With average summer temperatures over 100 degrees fahrenheit, it’s no surprise that travelers to the area clamor for rentals during the 70-degree midwinter and early spring months.
Whether you're dealing with a traditional summer peak or a wintertime boom, adapting your Airbnb seasonality strategy to these trends can positively impact your success as a short-term rental host.
Most and Least Seasonal Markets
Let's face it—timing is everything in the vacation rental game. How do you know when to expect those booking bonanzas or prepare for the quiet times? AirDNA's data provides valuable insights into which U.S. markets experience the most and least seasonal fluctuations in demand.
AirDNA's Seasonality Score reflects the extent to which seasonality affects a market's bookings throughout the year. A high score indicates low seasonality and consistent demand throughout the year, while a lower score suggests more demand fluctuation.
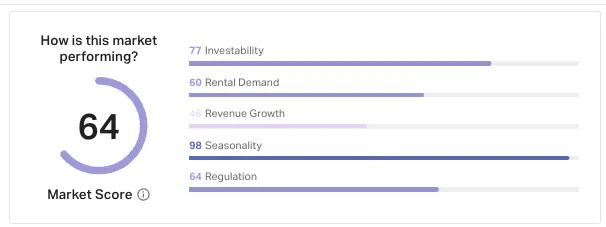
Here’s a closer look at American markets and how their Airbnb Seasonality Scores shape up:
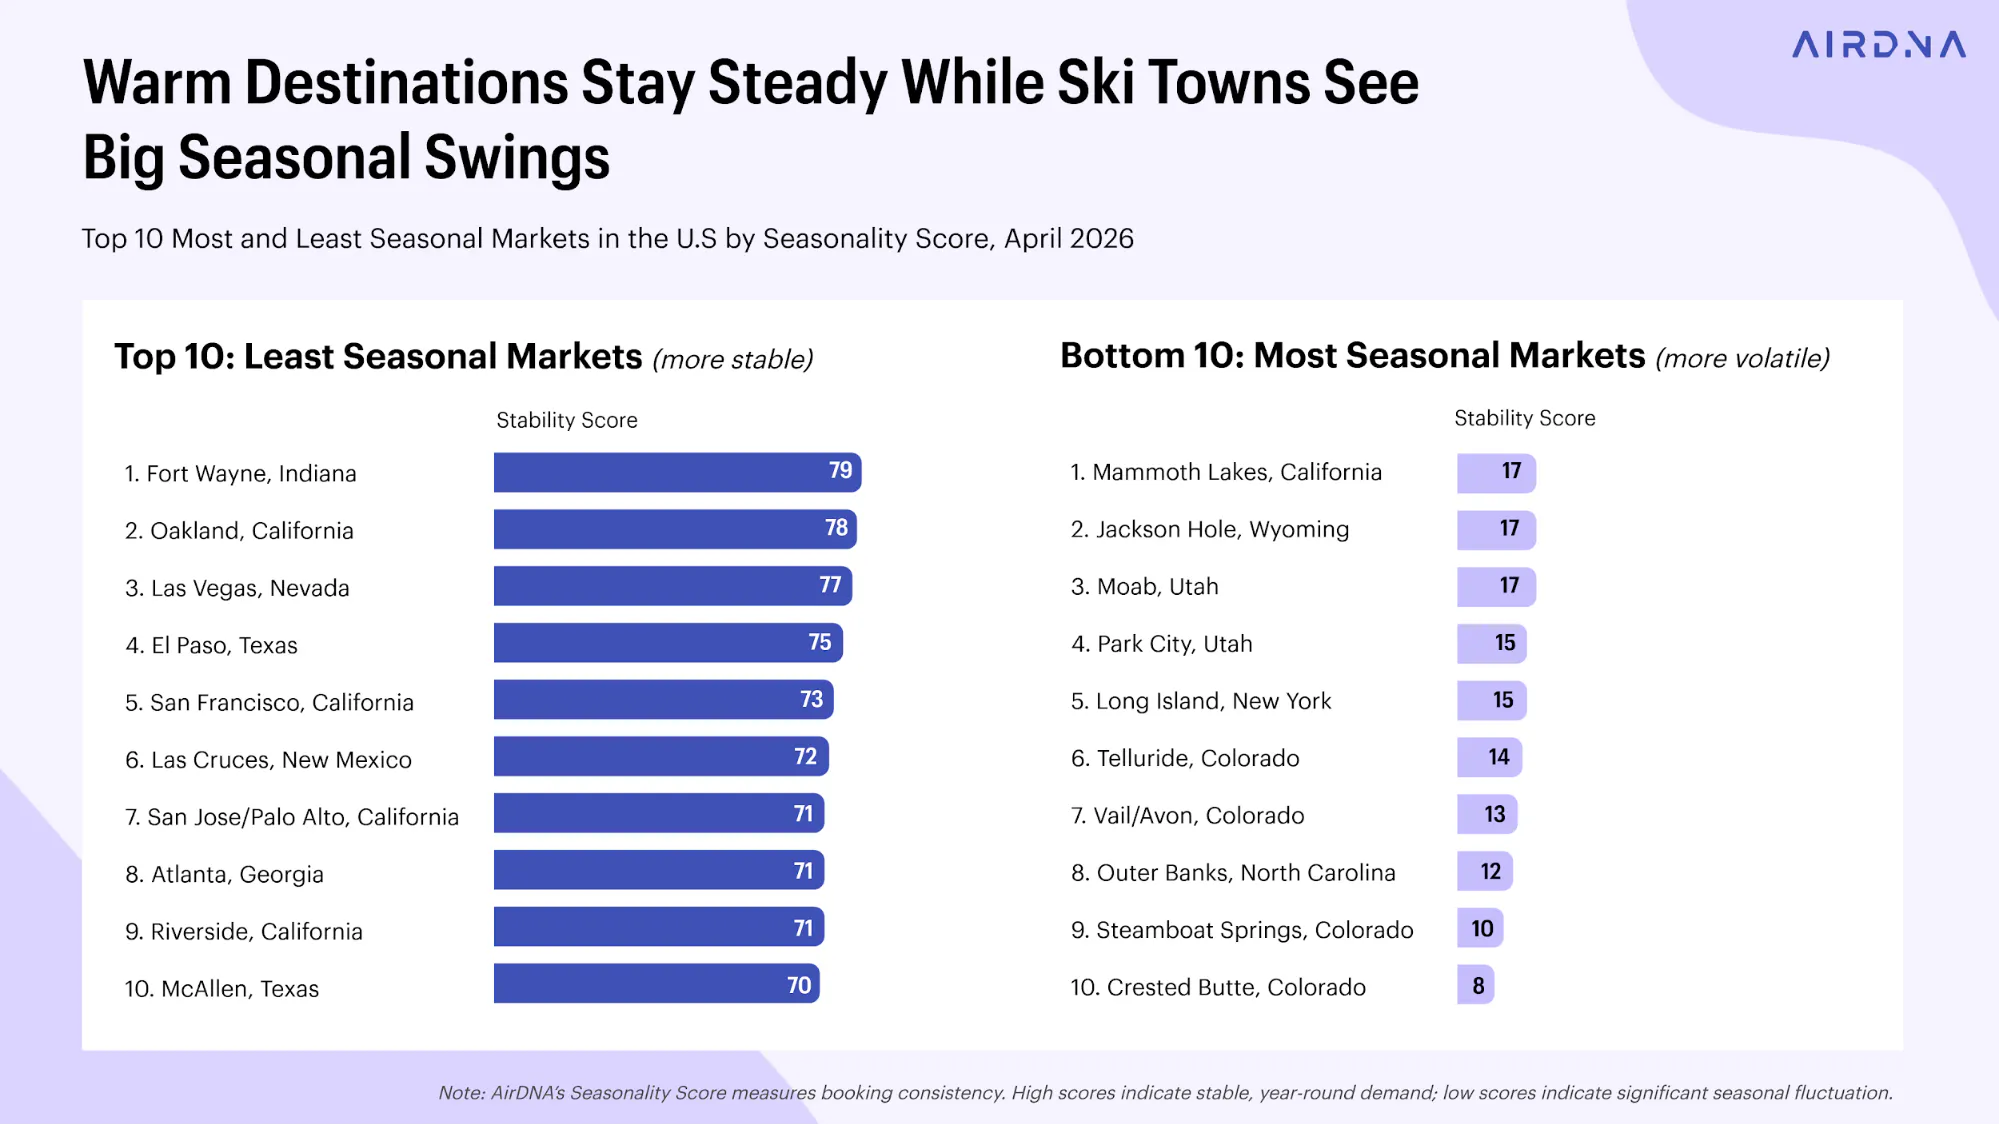
Most Seasonal Markets:
- Crested Butte, Colorado
- Steamboat Springs, Colorado
- Outer Banks, NC
- Vail/Avon, Colorado
- Telluride, Colorado
- Long Island, New York
- Park City, Utah
- Moab, Utah
- Jackson Hole, Wyoming
- Mammoth Lakes, California
The most seasonal markets have distinct high seasons related to outdoor recreation in their area. Park City, Utah, and Colorado destinations Telluride and Crested Butte are all home to ski resorts that welcome an influx of visitors during the winter months.
On the other hand, vacation markets that lean heavily on their water features for visitor appeal—the Outer Banks, for instance—are busy in the summertime and hard-pressed to find visitors during the winter months.
Least Seasonal Markets:
- Fort Wayne, Indiana
- Oakland, California
- Las Vegas, Nevada
- El Paso, Texas
- San Francisco, California
- Las Cruces, New Mexico
- San Jose/ Palo Alto, California
- Atlanta, Georgia
- Riverside, California
- McAllen, Texas
The least seasonal markets likely benefit from a mix of business and leisure travel, along with diverse attractions that appeal to visitors year-round. Las Cruces, New Mexico, has mountains, desert, and nearly year-round festivals and events for visitors passing through. The main attractions for typical Las Vegas visitors are indoors and are therefore unaffected by high summer temperatures.
Unsurprisingly, destinations with relatively consistent year-round temperatures are among the least seasonal markets. This includes Bay Area markets such as San Francisco, Oakland, and San Jose/Palo Alto.
Understanding your market's Airbnb seasonality can help inform pricing strategies, maintenance scheduling, and property selection. While highly seasonal markets may offer opportunities for higher peak-season rates, markets with low seasonality scores may provide more predictable year-round income.

Does Low Airbnb Seasonality Mean a Market Is Better?
No. When comparing markets in the U.S. and Europe, we see that highly seasonal markets can actually achieve high average monthly RevPAR despite having pronounced low seasons. RevPAR, or Revenue Per Available Rental, measures the average revenue earned on every available night, booked or not, by combining ADR and occupancy into a single number. It's the clearest signal of a market's overall revenue efficiency. A seasonal market with a short but lucrative peak can still outperform a steadier one on an annual basis. Many of these seasonal markets are traditional resort areas where travelers book larger homes at premium prices.
Managing a vacation rental in a highly seasonal market can be quite profitable. However, success hinges on understanding how to price your property effectively during both high seasons and low seasons. It's also crucial to prepare for market conditions beyond your control. For instance, if you own a luxury home in a ski resort town, a poor snow season could significantly impact bookings for extended periods.
On the other hand, if you prefer consistent income throughout the year (even if it means a lower average RevPAR), a market with low Airbnb seasonality might be more suitable. In these markets, you're less likely to face dramatic revenue dips. However, you'll also miss out on those peak periods where demand allows for substantially higher pricing.
Take Las Vegas, Nevada, for example. This desert destination demonstrates remarkable stability in RevPAR throughout the year. With its steady stream of visitors across seasons, Las Vegas offers property owners more predictable income. This consistency stems from the market’s year-round appeal to various traveler types, from summer vacationers to winter sun-seekers and international gamblers.
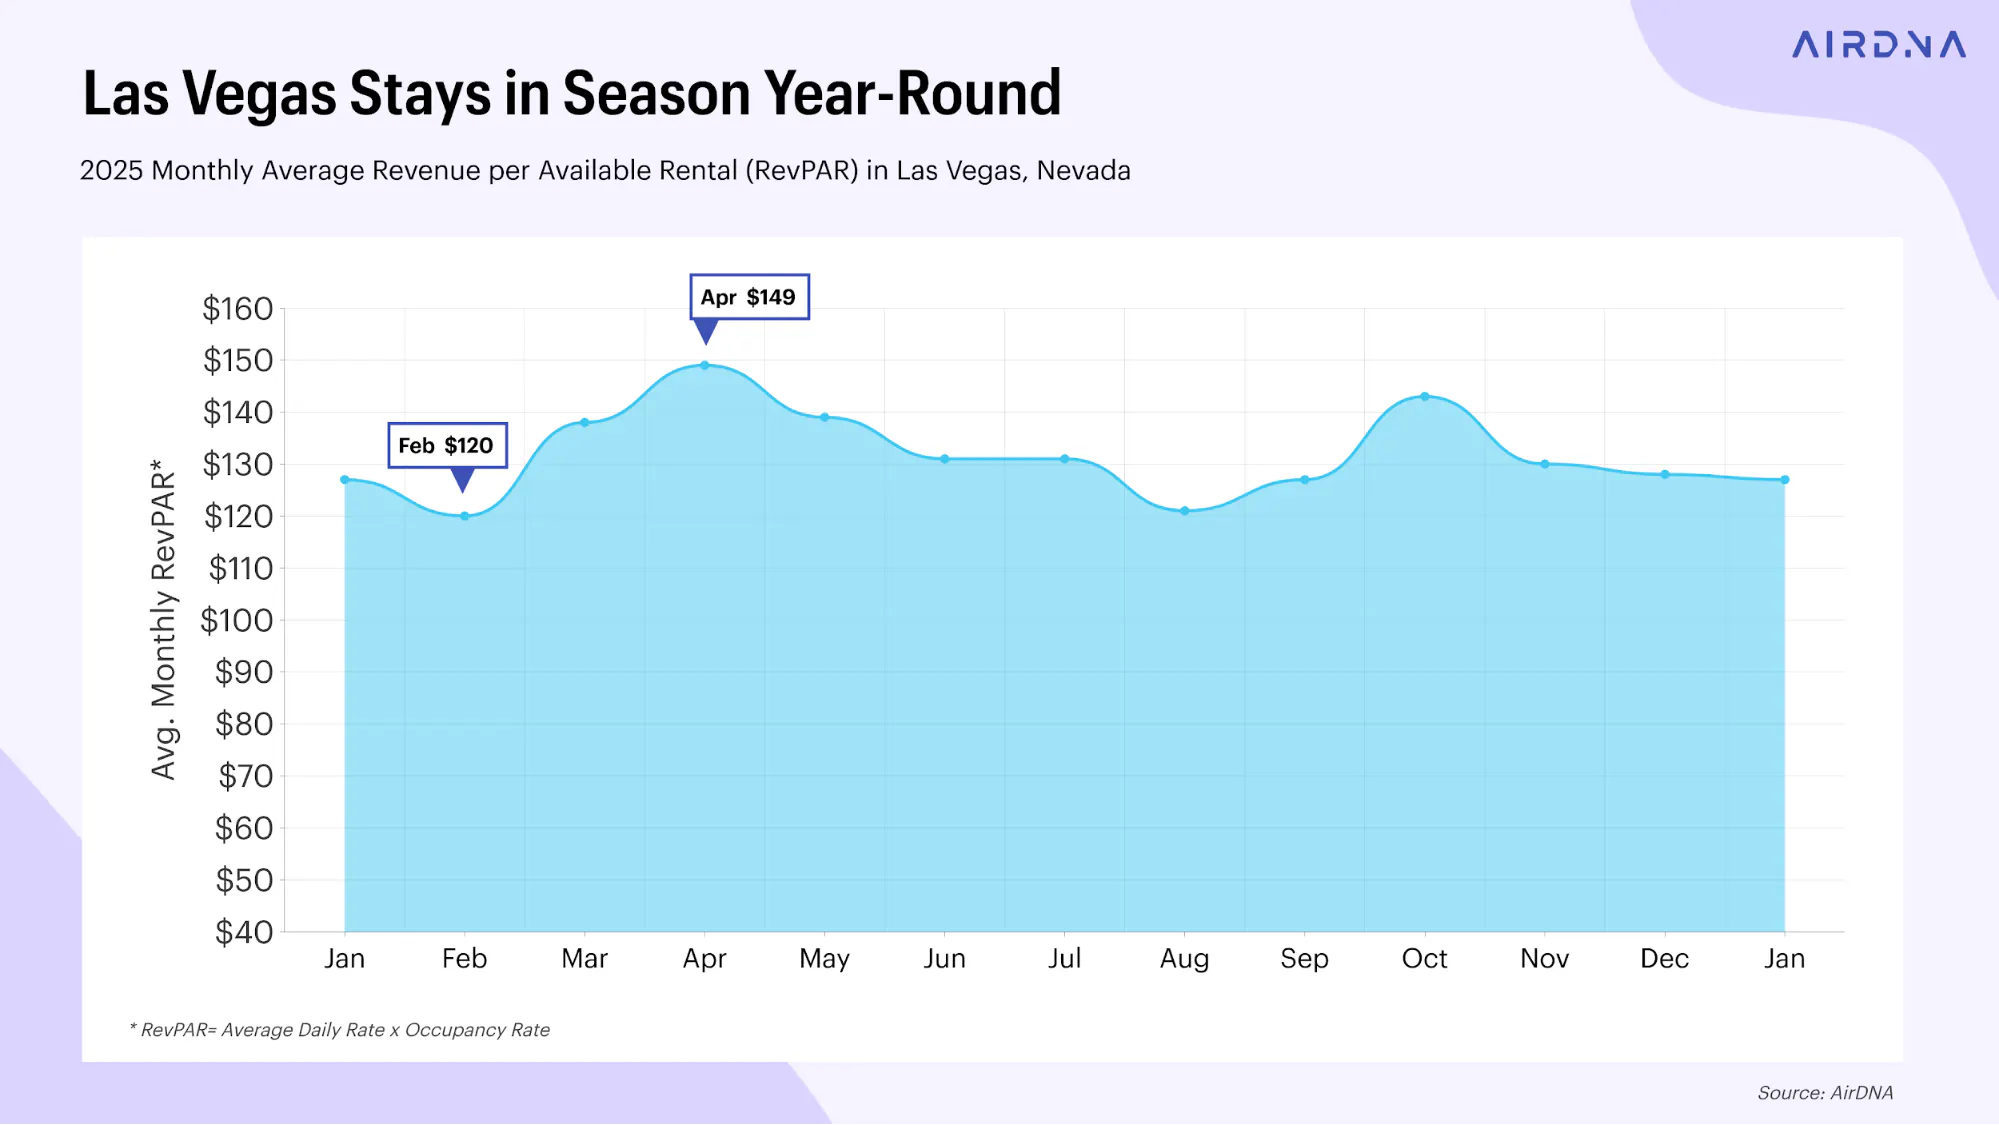
Ultimately, the choice between a highly seasonal or more stable market depends on your investment goals, risk tolerance, and management style. Both can be profitable with the right strategy and understanding of market dynamics.
Tips for an Airbnb Seasonal Strategy
Fine-tuning your Airbnb pricing strategy to reflect seasonal fluctuations can boost your revenue and keep your property competitive. Each season presents unique challenges and opportunities, from capitalizing on peak demand during the high season to attracting guests during slower periods. Here’s how you can optimize your pricing strategy year-round, using data-driven insights and targeted approaches for each season.
High Season Strategies
Maximize your rates
During peak times, demand is at its highest, and travelers are often willing to pay a premium. Utilize AirDNA's Pacing Data, accessible through your Host Tools in the AirDNA dashboard, to predict demand spikes and adjust your pricing accordingly. Pacing is a category of analytics that looks at projected performance.
With this feature, you can look ahead to any specific date to analyze your competition’s median booked rate, see how many listings are booked, and check occupancy rates. This helps you to confidently set the right price and maximize your revenue.
Don’t forget to regularly monitor booking trends and competitor rates to stay competitive without undervaluing your property. Highly seasonal destinations often have long booking lead times, meaning that vacationers secure their accommodations well in advance. With this in mind, it’s important to set your prices well in advance.
Implement minimum stays
This strategy helps to reduce turnover costs and maximize revenue by ensuring longer bookings. For instance, during holiday weekends or local events, a three-night minimum stay can prevent short, less profitable reservations from blocking your calendar.
Highlight unique features
Emphasize what sets your property apart to justify higher rates. Whether it’s a stunning view, luxurious amenities, or a prime location, make sure these features are prominently displayed in your listing. High-quality photos and detailed descriptions can help potential guests see the value and uniqueness of your property, making them more likely to book at a higher price.
Low Season Strategies
Research before slashing rates
Instead of slashing prices to rock-bottom levels during the off-peak months, conduct thorough market research. Use AirDNA's tools to analyze local demand and competitor pricing. Take a look at the average booking lead time, which can be found in Pacing Data under Host Tools in your AirDNA account. If most guests are booking their accommodation close to the date of their stay, it may be wise to resist the temptation to lower your rates. Short booking lead times suggest that guests are willing to pay high prices for last-minute reservations.
In addition to analyzing demand and booking trends, consider offering strategic discounts for extended stays to attract longer bookings without devaluing your property. This approach appeals to guests seeking longer-term accommodations, such as remote workers or retirees. It also helps you to maintain a reasonable nightly rate and ensure a consistent income stream.
Target different guest segments
Shift your marketing focus to attract guests who are less influenced by traditional vacation seasons. Business travelers, digital nomads, and people relocating temporarily might find your property appealing during low seasons. Tailor your amenities and listing description to highlight features that cater to these groups, such as fast Wi-Fi, a comfortable workspace, and proximity to business districts.
Add value
Make your listing stand out by providing additional amenities or experiences. Guided tours, local attraction passes, or meal packages can make your listing more attractive. Partner with local businesses to offer exclusive deals or experiences that guests can’t find elsewhere.
Promote events
Identify local events, festivals, and attractions that occur during the low or shoulder season. Adjust your pricing around these events to attract more guests. Creating event-specific promotions or packages can draw in attendees and make your property the go-to choice for event attendees.
What to Remember No Matter the Season
- Know your market’s seasonality score: Use AirDNA to identify your location's peak, shoulder, and off-seasons. Analyze occupancy and average daily rate (ADR) patterns to build a strong pricing strategy foundation.
- Set your base price wisely: Calculate your break-even point, including all fixed costs. Research comparable properties to ensure your price is competitive, and factor in unique features to justify a premium. Use this base price for seasonal adjustments.
- Factor in local events: Create a calendar of local events that drive demand. Adjust pricing for event days and the surrounding period using AirDNA’s Pacing Data to anticipate booking trends.
- Conduct regular reviews: Set quarterly reminders to review your pricing strategy. Analyze booking patterns, revenue, and guest feedback. Stay updated on market changes and trends.
- Monitor competition: Use AirDNA's Comp Set feature to track similar listings. Analyze their pricing, amenities, and reviews. Adjust your rates to remain competitive and use competitor insights as a starting point for making targeted improvements to your property.
How AirDNA Can Help You Measure Airbnb Seasonality
At AirDNA, we've developed a comprehensive approach to measuring Airbnb seasonality in the short-term rental market. Our analysis covers an extensive dataset of over 15 million properties across both Airbnb and Vrbo, spanning 80,000 regions worldwide. This breadth of data allows us to paint a detailed picture of market trends and fluctuations.
As part of our in-depth market analysis, we assign each market a market score. A key component of the market score is the seasonality score. The seasonality score represents the percentage difference between the minimum and maximum monthly RevPAR (Revenue per Available Rental) over the past year. Markets with minimal fluctuation in demand throughout the year receive a higher seasonality score on a scale of 1-100, indicating more consistent booking patterns.
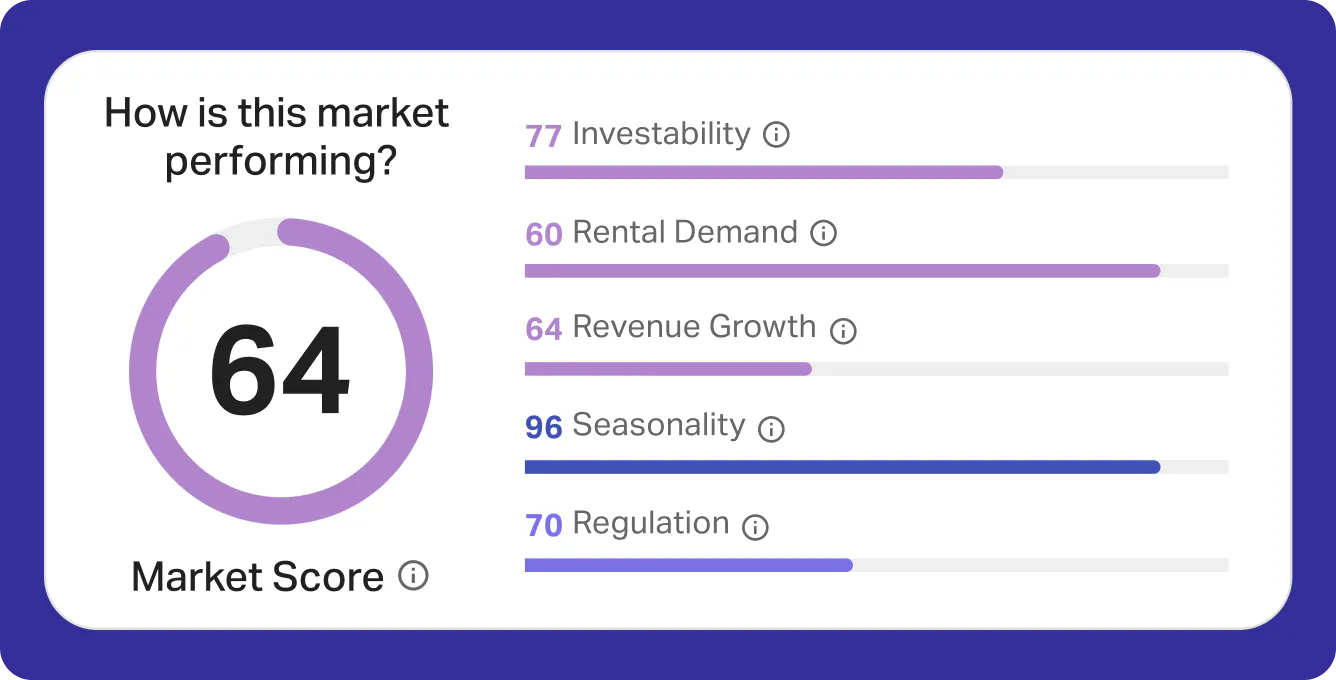
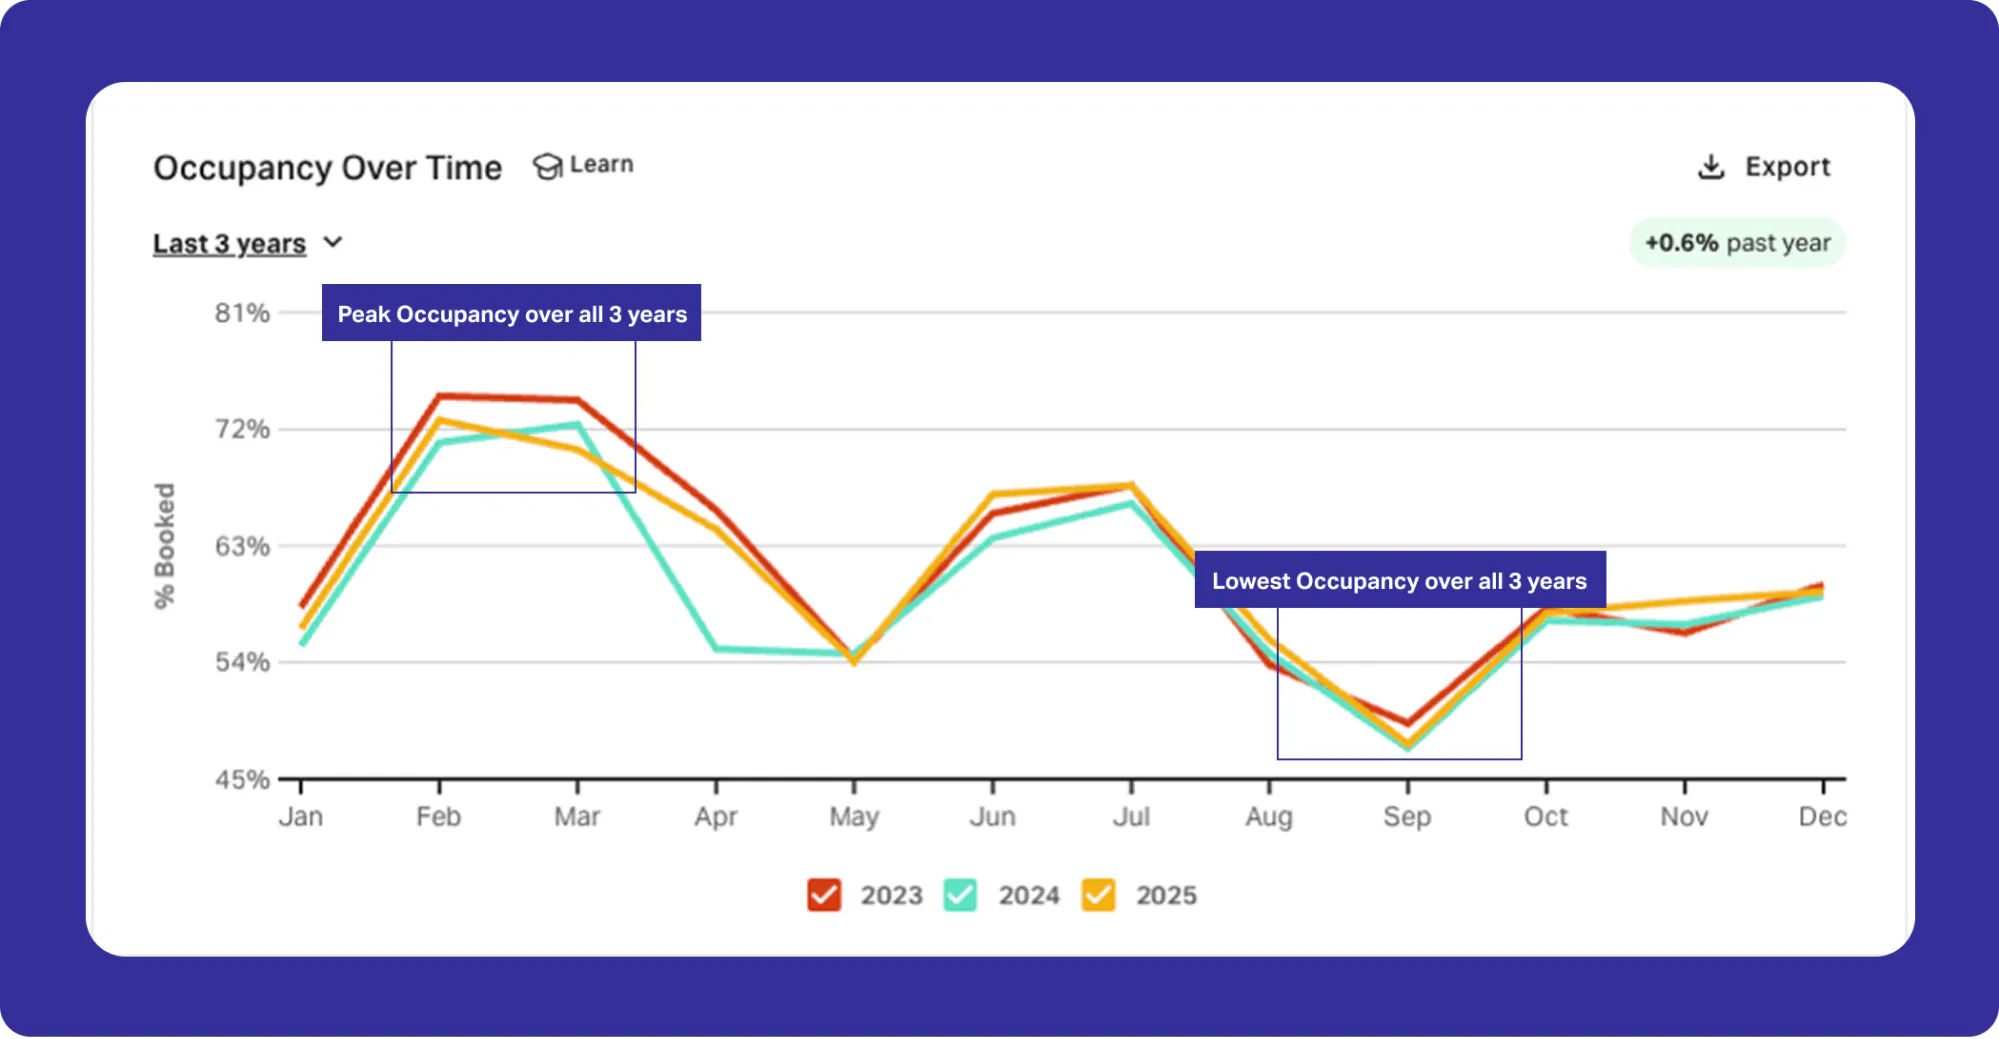
Beyond the Seasonality Score, our historical occupancy and RevPAR data let you turn seasonality insight into a real pricing strategy. Monthly occupancy data helps you map your market's rhythm—the peak months, shoulder stretches, and predictable dips when demand quiets down.
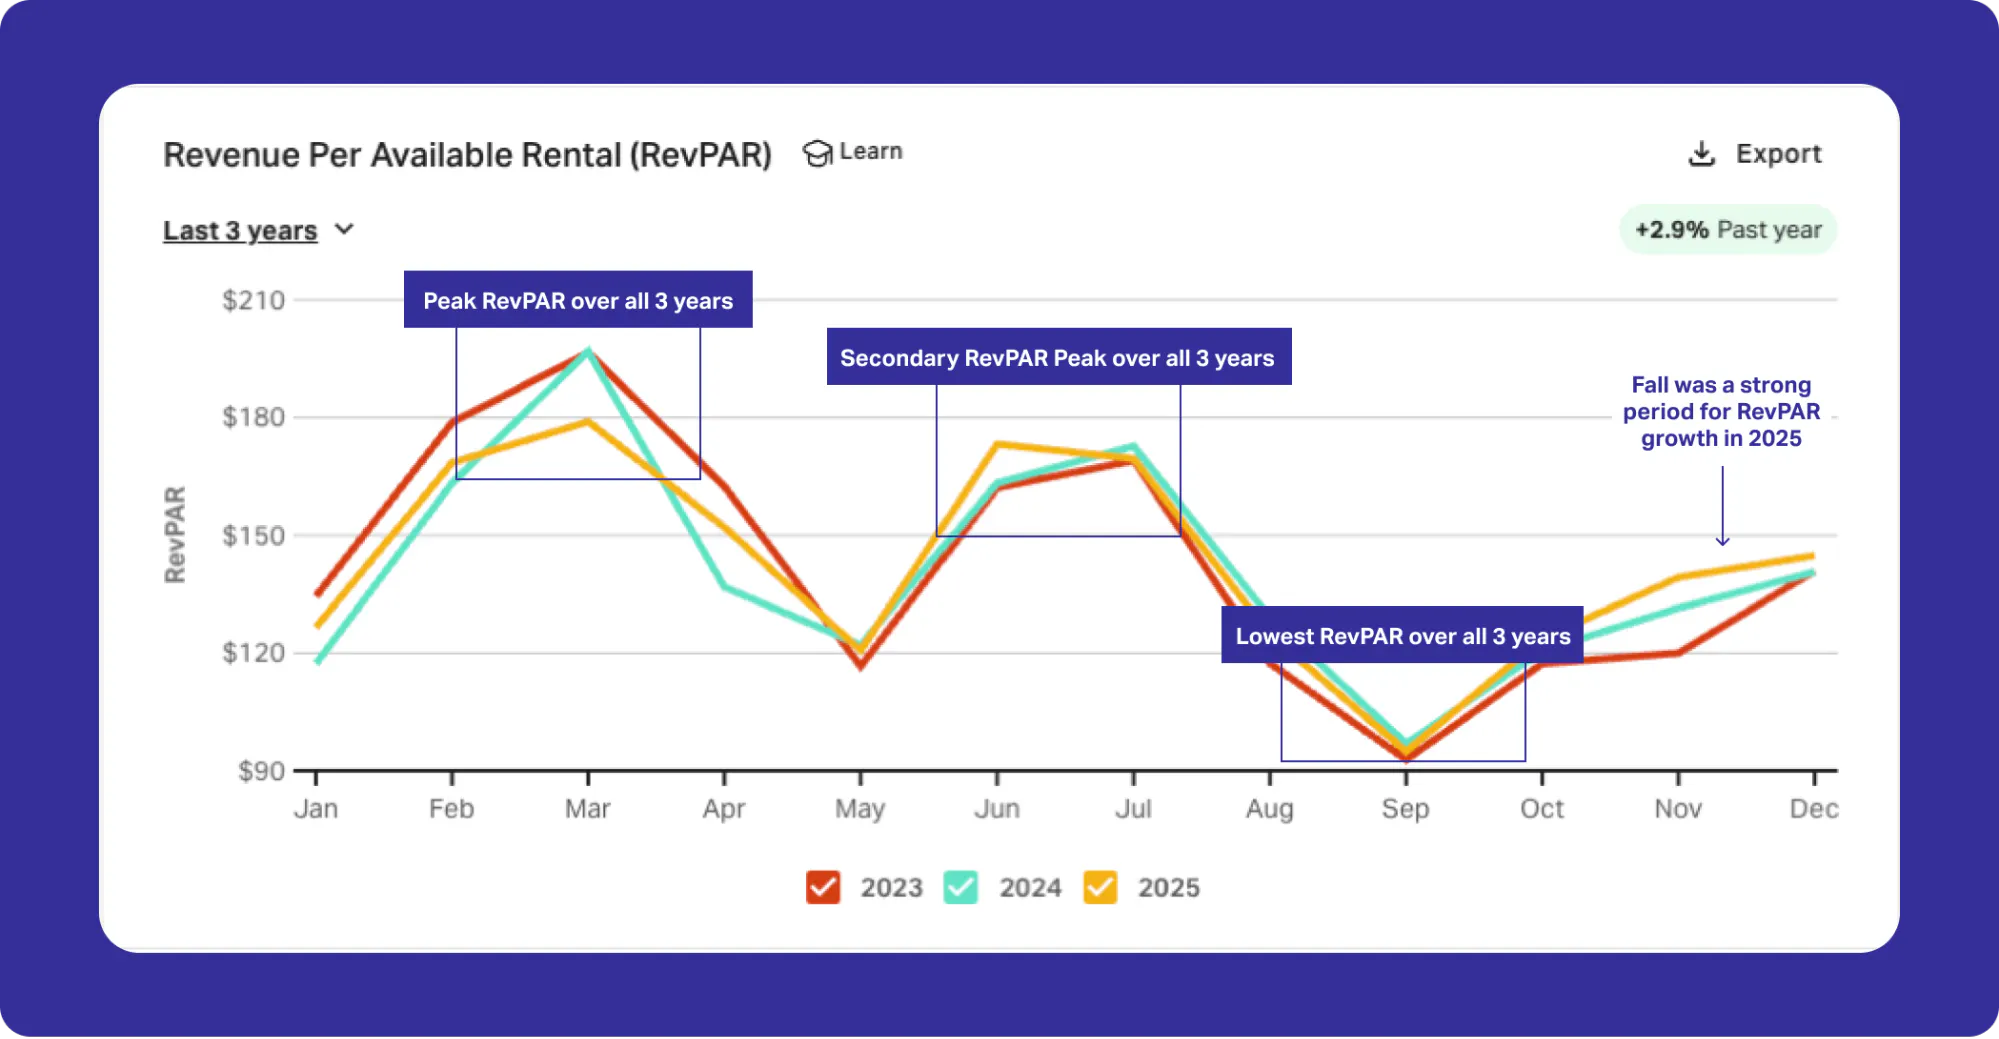
From there, historical RevPAR performance brings the rates hosts are charging into the picture alongside how often they're booked, giving you a clear idea of when hosts are earning the most revenue for each available night they offer.
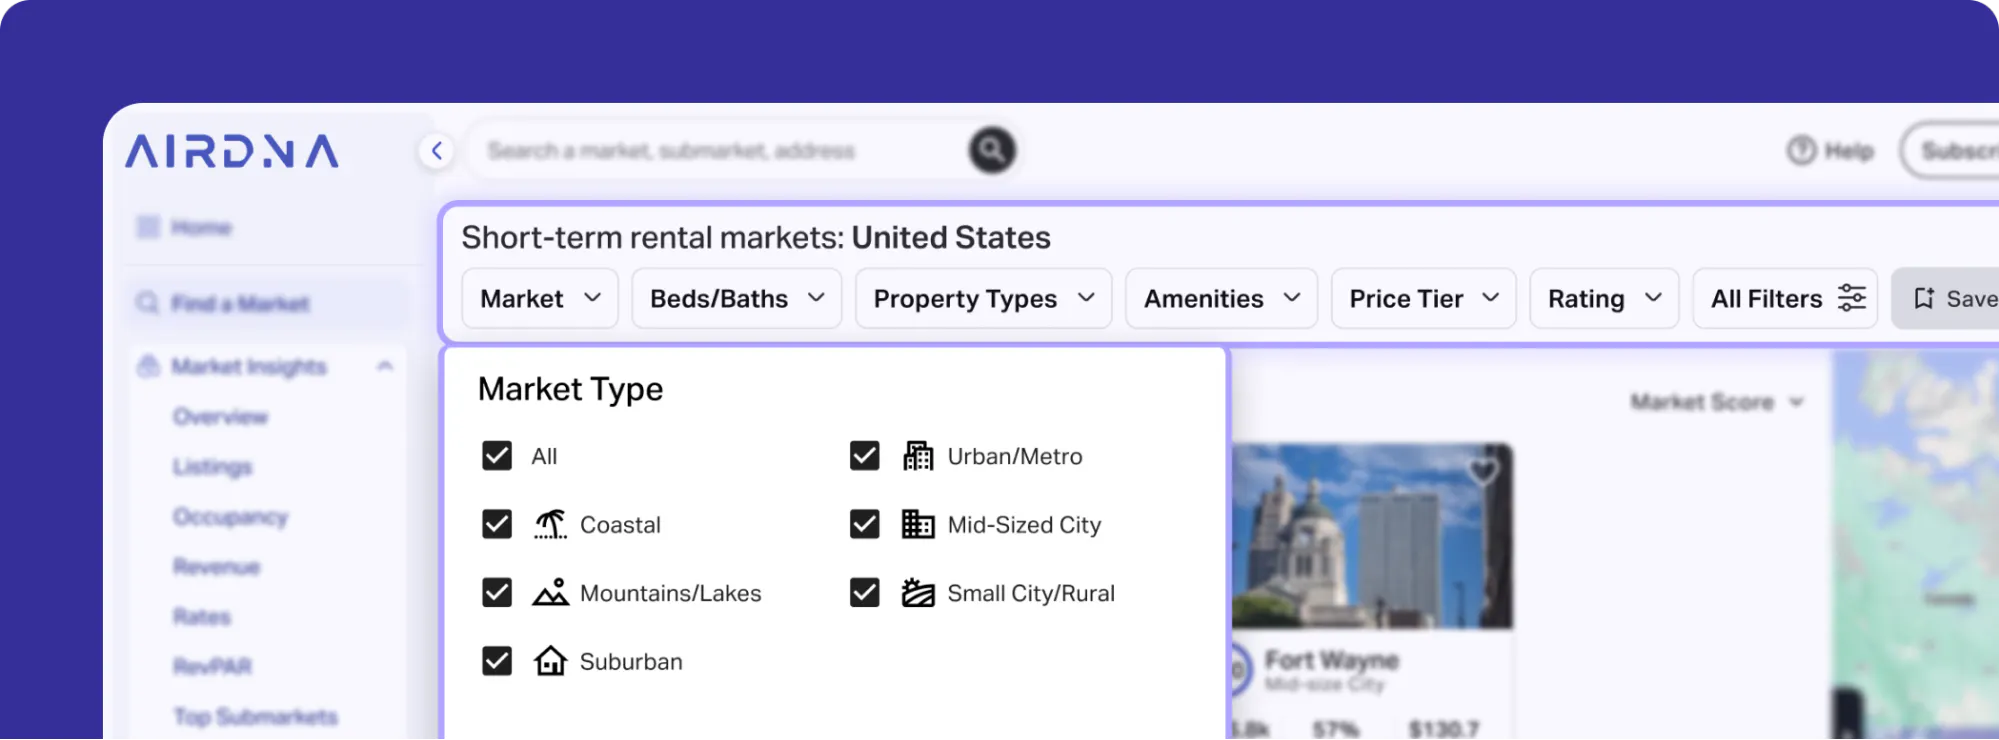
Applying listing filters can help you narrow the view to properties like yours, and comparing multiple years of performance can help you separate lasting trends from one-off anomalies. The result is a clear read on where to push rates, where to protect occupancy, and where the real revenue lives in every season.
ARTICLE SUMMARY
Maximize your Airbnb profits by understanding seasonality's impact on your rental market. We explore seasonal patterns in various markets and provide strategies for leveraging peak, shoulder, and off-seasons.
Bram Gallagher
AirDNA Director of Economics and Forecasting
Bram Gallagher is an Economist at AirDNA, specializing in uncovering insights that drive smarter short-term rental decisions. He put his Ph.D. in Economics from the University of Georgia to work researching and forecasting hotel data with CBRE prior to joining AirDNA, as well as teaching economics at a number of universities. In his spare time, Bram enjoys making wooden furniture with hand tools.
