


U.S. AirDNA Index November 2019: The Calm Before the Holiday Storm
Published: November 27, 2019
Last updated: November 13, 2026

Scott Sage
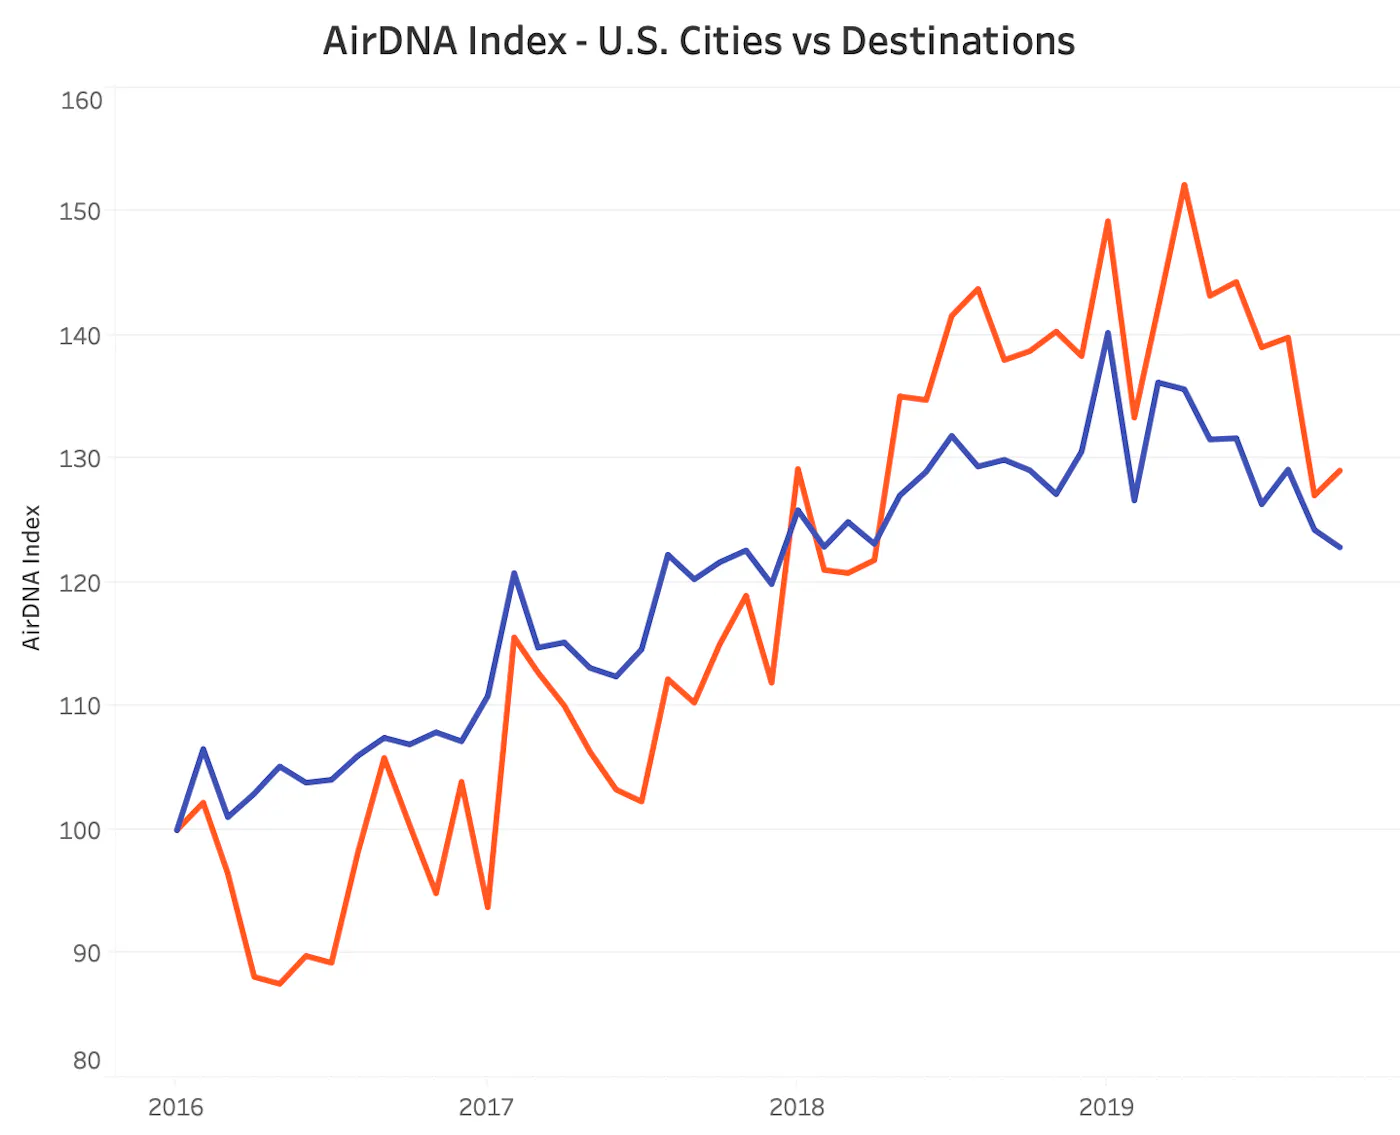
The United States AirDNA IndexAs the vacation rental market settles into its offseason, data from this month’s AirDNA Index echoes a familiar theme: fall months mean either stagnant or falling revenues. Historically speaking, the transition from September to October never sees earthshattering shake-ups -- and 2019 is no different. This month’s AirDNA index is down a marginal 1.71 points. With respect to historical comparisons, October of 2019 was 3.43 points lower than October of 2018. The latter half of this year hasn’t fared particularly well to the same portion in 2018. In fact, we haven’t seen a positive year-on-year index adjustment since June. That being said, the two-year comparison still provides promising data. The AirDNA Index isn’t quite reaching the same growth rate of 2018 (when it averaged 34.2% more growth than two years prior), but October of 2019 was still up a positive 7.2 points from October of 2017. The potential reasons for this market-wide slouch are not entirely clear. Many point to declining consumer confidence, while others reference slipping GDP, looming trade wars, and the fact that the federal funds rate was lowered three times in just three months. What’s likely in the context of short-term rentals is overall market saturation. As seen by hosts in Mexico, many eager property managers are seeing significantly less growth in destinations that have otherwise been quite dependable. Although the overall short-term rental market was down this month, many cities and destinations continue to perform extremely well. Here’s the updated snapshot of the AirDNA Index for November of 2019.
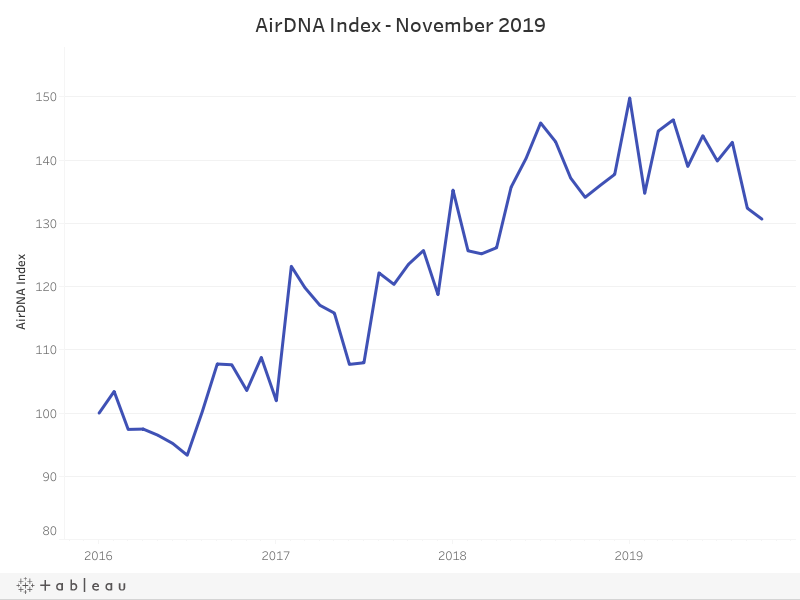
var divElement = document.getElementById('viz1574798833311'); var vizElement = divElement.getElementsByTagName('object'); vizElement.style.width='100%';vizElement.style.height=(divElement.offsetWidth*0.75)+'px'; var scriptElement = document.createElement('script'); scriptElement.src = 'https://public.tableau.com/javascripts/api/viz_v1.js'; vizElement.parentNode.insertBefore(scriptElement, vizElement);
Metropolitan vs Destination MarketsIn last month’s report we saw traditional vacation rental destinations take a significant 12.7-point hit as they slid into the offseason. We hinted at the reemergence of urban destinations, and a potential flip-flop where revenue growth was to be driven largely by big-city destinations (as it was in the years prior to 2018). This month, the market fell back to its familiar theme. Destination markets like those in Hawaii, Alabama, and South Carolina witnessed positive returns, while urban markets in California, the Midwest, and the Northeast saw sizeable drop-offs. Destination markets were up 2.01 points while urban markets fell by 1.41 points. Neither adjustment is substantial enough to make lofty claims, so it’s fair to consider this month’s AirDNA Index just about on-par with last month’s. We’ll be tracking how both urban and destination markets fare as we start gearing up for the holiday season stretch. The chart below shows the current standoff between the two segments.
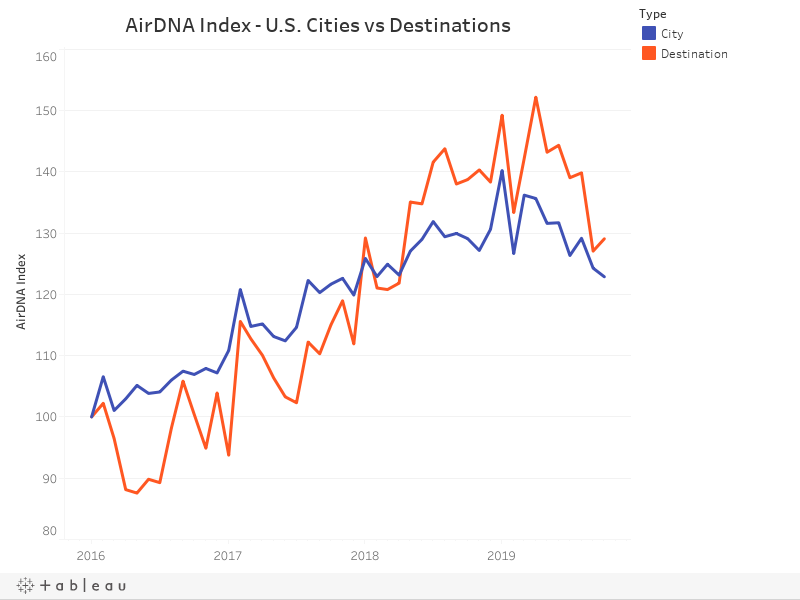
var divElement = document.getElementById('viz1574798768342'); var vizElement = divElement.getElementsByTagName('object'); vizElement.style.width='100%';vizElement.style.height=(divElement.offsetWidth*0.75)+'px'; var scriptElement = document.createElement('script'); scriptElement.src = 'https://public.tableau.com/javascripts/api/viz_v1.js'; vizElement.parentNode.insertBefore(scriptElement, vizElement);
Urban Short-Term Rental MarketsAlthough U.S. urban vacation rental markets experienced a bit of a slip, there is a handful of cities that continue to outshine the competition. Here is the market-level breakdown of which cities are performing and which are continuing to struggle.
Increasing Revenue
Denver, CO - Colorado’s high-altitude capital topped the list this month with a 16.6% year-on-year revenue jolt. For a market that is traditionally somewhat seasonal, hosts in Denver should be pleased to hear that it’s beginning to attract guests year-round.
Texas - Last month we highlighted five cities in Texas that were experiencing significant year-on-year growth. This month’s Index ushers in the same theme: Dallas (6.1%), Houston (2.9%), and Austin (0.5%) all reported positive revenue numbers.
Pheonix, AZ - Unsurprisingly, Phoenix is another location that thrives during the shoulder months. October and November are when many travelers consider a Southwestern getaway, and hosts in Phoenix are beginning to reap the benefits. Last month the city was up 6.6%, and this month it’s up 3.9%.
Decreasing Revenue
Charlotte, NC - When it comes to seasonality, Charlotte usually stands out from the pack. With a score of 95 on MarketMinder’s seasonality metric, it’s a part of the country where tourism doesn’t fluctuate much. This hasn’t been the case for the past two months. Hosts in Charlotte saw 9.7% more revenue in last month’s index and 16% less revenue in this month’s.
Columbus, OH - The Columbus vacation rental market is truly having a rough fall season. After coming in last place last month with -15.5% YOY revenue, this time it’s not much better (-13.8%). Curiously enough, demand is up 23.2% from October of 2018, but the average host is making significantly less money.
San Jose, CA - despite being the home of the country’s booming tech scene, San Jose’s vacation rental market is showing some signs of stagnation. San Jose saw 13.4% less year-on-year revenue.
Traditional Vacation Rental DestinationsUnlike the big-city urban destinations, the United States’ vacation rental destinations saw positive year-on-year returns for the first time since August. The 2.01-point bump didn’t break any records, but it represents the resilience of resort-based markets even in the offseason.
Increasing Revenue
Hawaii - As arguably the country’s most consistent resort-based destination, Hawaii continues to impress. This month saw three locations (Lahaina, Kihei, and Honolulu) all reach positive revenues for back-to-back months. Not bad for locations that don’t tend to pick up until the holidays.
Alabama - Separated by just 7.5 miles of idyllic coastline, Gulf Shores and Orange Beach constitute the ultimate 1-2 punch of vacation rental markets. These markets (that have dominated since the 1970s) saw revenues grow 11.3% and 5.4%, respectively.
North Myrtle Beach - Whereas Myrtle Beach and Hilton Head Island didn’t do too well this month, South Carolina’s North Myrtle Beach stood out from the pack. 6.6% revenue growth has this vacation rental hotspot full of momentum heading into the holiday months.
Decreasing Revenue
Florida - Similar to last month, seven of the eight worst-performing destinations were all located in Florida. Santa Rosa Beach (-6.1%), Panama City Beach (-6.9%), Miramar Beach (-9.2%), Miami (-9.2%), (-10.2%), Davenport (-13.4%), and Kissimmee (-19.9%) all performed worse than in 2018
Las Vegas - Las Vegas’ monthly numbers were down, but don’t let that take away from its overall performance. With an “A” grade on MarketMinder and a 100/100 score for seasonality, it’s a domestic market that has little downside.
Scott Sage
Senior Vice President, Marketing & Customer Experience
Scott is an Airbnb Superhost and industry pro, having founded Home Base BnBs—a short term rental management company that scaled to 200+ units. Scott combines his experience and passion for hosting to empower AirDNA customers' success. When he's not thinking about STRs, he is hiking, playing basketball, or playing pickleball.
Get started with AirDNA today.
Powerful, easy-to-use tools that help hosts and investors succeed in the short-term rental market.
Try for free