U.S. Market Review: April Demand Slows As Easter Shift Bill Comes Due
Published: May 17, 2024
Last updated: September 26, 2024

Scott Sage
The strong short-term rental (STR) market performance seen in March came with a catch: some of the demand was due strictly to the calendar shift that moved Easter, and many spring break vacations along with it, from April to March.
This meant that March had the second-highest demand growth seen in the last year (after February) and that 2024’s April had fewer spring breaks scheduled than last year. As a result, demand growth swerved from a strong 10.5% in March to just 0.4% in April.
A similar pattern emerged at the beginning of the year when a cold snap and poor snow-pack conditions in January led many to put off ski trips and winter vacations until February.
So far, 2024 has seen a highly volatile pattern of demand growth. However, when you average the first four months of 2024 against the first four months of 2023, we see an upward trajectory.
Employment and Inflation
Economic news in April brought another round of stalling on the part of the Federal Reserve.
According to the Bureau of Labor Statistics (BLS), 175,000 new jobs were added to the U.S. economy in April. While still a relatively solid number of jobs, it represented a notable decline from the 315,000 jobs added in the previous month. It’s low enough to increase the unemployment rate slightly to 3.9%, up from 3.8% in March.
At the same time, inflation, as measured by the year-over-year (YOY) change in the consumer price index, came in at 3.4%. That’s down from 3.5% in March but still too high to signal that rates can be cut immediately without risking further price increases. This rate is particularly important to the STR industry because it is considered to influence mortgage lending rates.
According to an analysis of mortgage data from Recursion Co, mortgage loans fell to the lowest level of the current century in 2023. This is due in part to central bank rates reaching their highest in 23 years. The stagnant inflation figure has given economists some confidence that the rates could see cuts later in the year.
At a Glance: Key U.S. STR Performance Metrics for April 2024
- RevPAR decreased 6.1% year-over-year (YOY) to $153.25
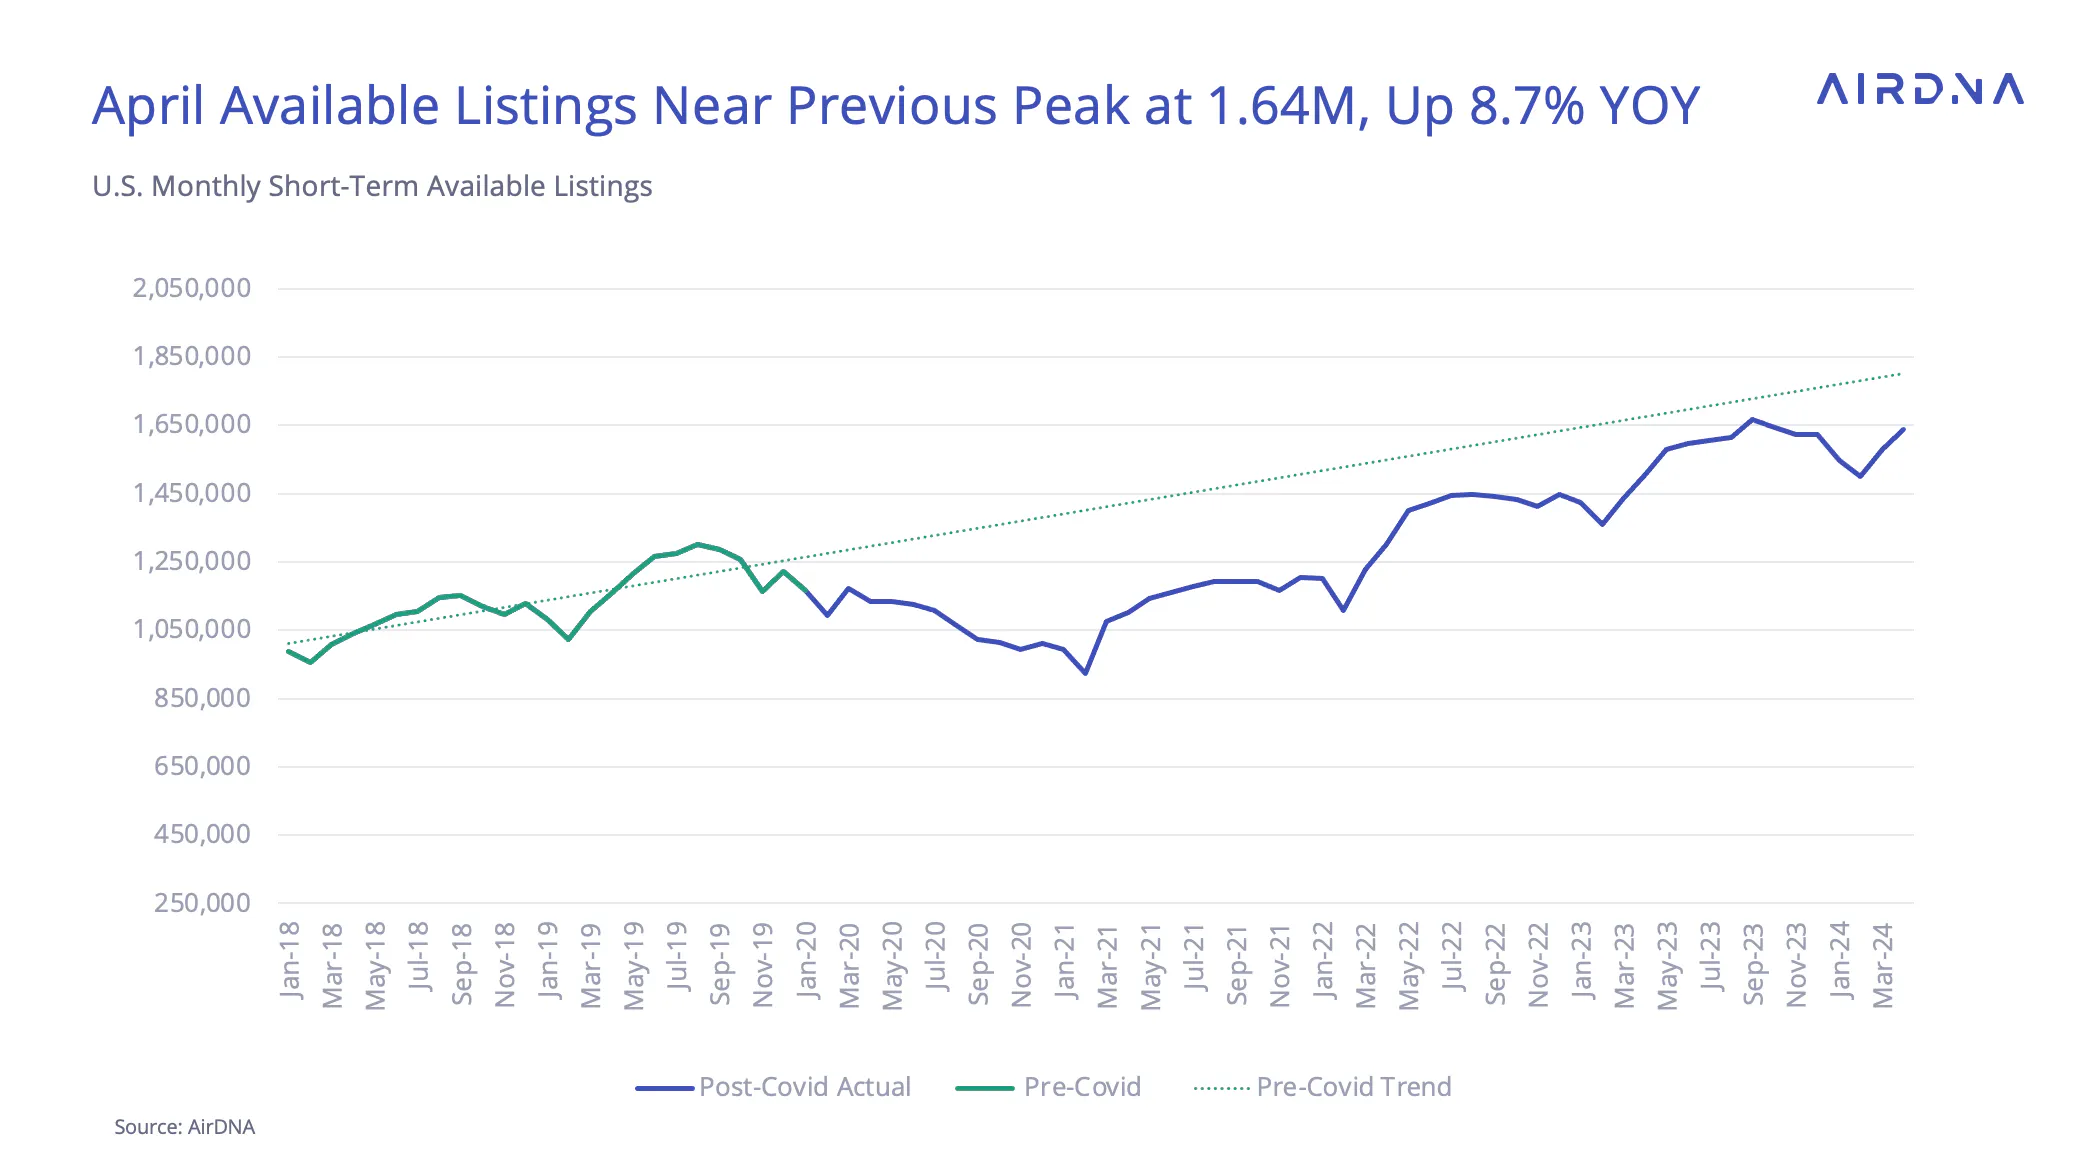
- Available listings were 1.64 million, up 8.7% YOY
- Total demand (nights) rose 0.4% YOY
- Occupancy was 8.4% lower YOY at 50.0%
- ADRs increased 2.4% YOY to $306.39
- RRI increased by 6.5% YOY
- Nights booked increased by 7.6% YOY

April Available Listings Rival Previous Highs
Available listing growth is showing signs that the protracted period of high interest rates are having an effect on supply growth.
Although available listings neared the previous peak of 1.67M seen last September, April fell slightly short at 1.64M after an early and deeper than usual seasonal dip.
Supply Growth Slowing, Especially in Urban Areas
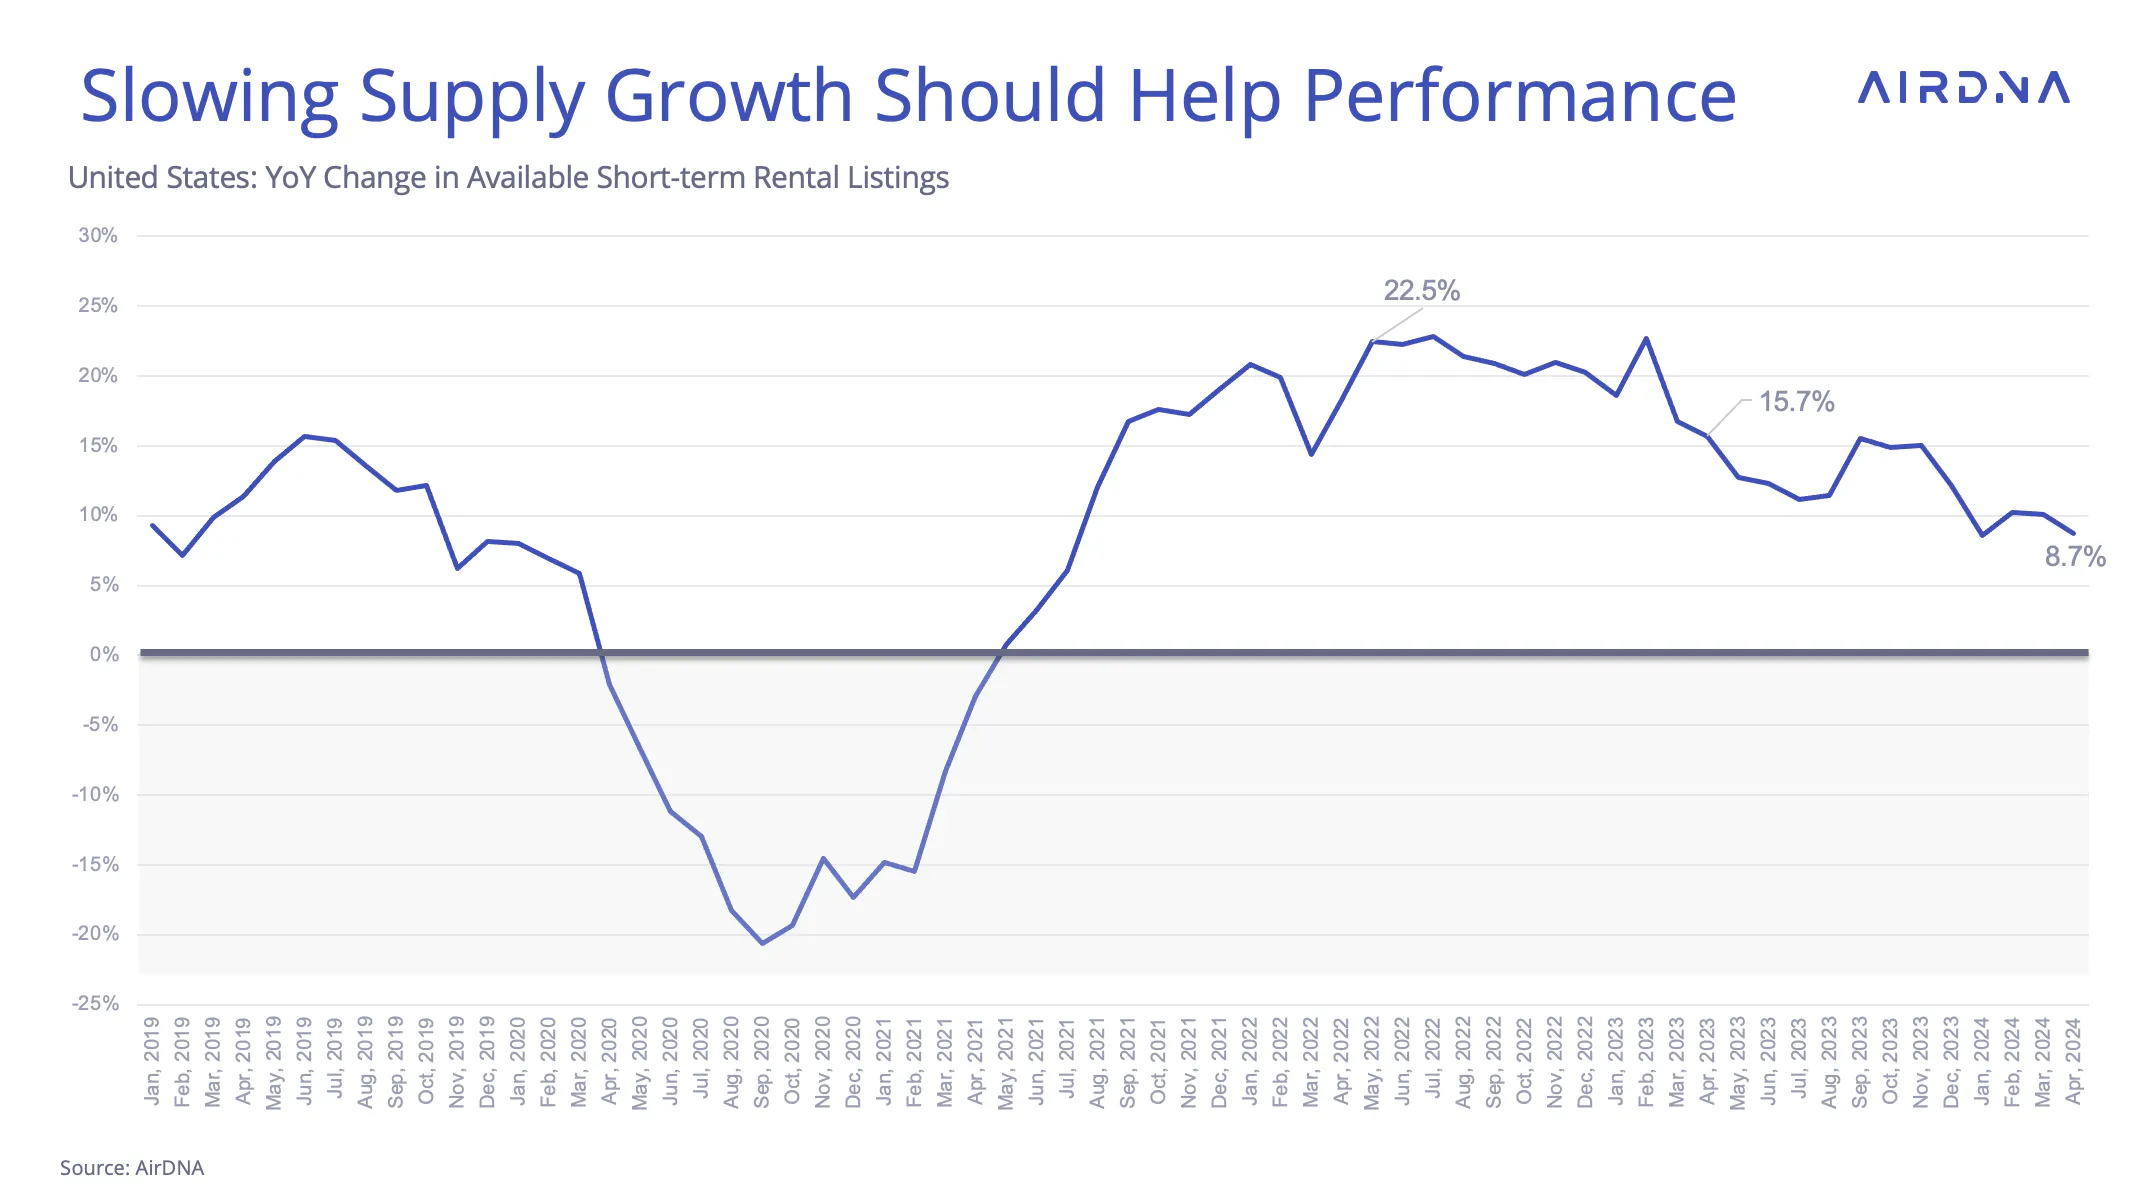
The increase in available listings can be contextualized as part of a longer-term trend of slowing supply growth that began about six-months after the Fed introduced its current regime of rate increases in March 2022.
Available listings in March grew 8.7% YOY, the second-slowest rate since the pandemic (the slowest was seen in January, at 8.6%). This should be welcome news to operators of current vacation rentals. Less competition should help unit-level performance in the coming months.
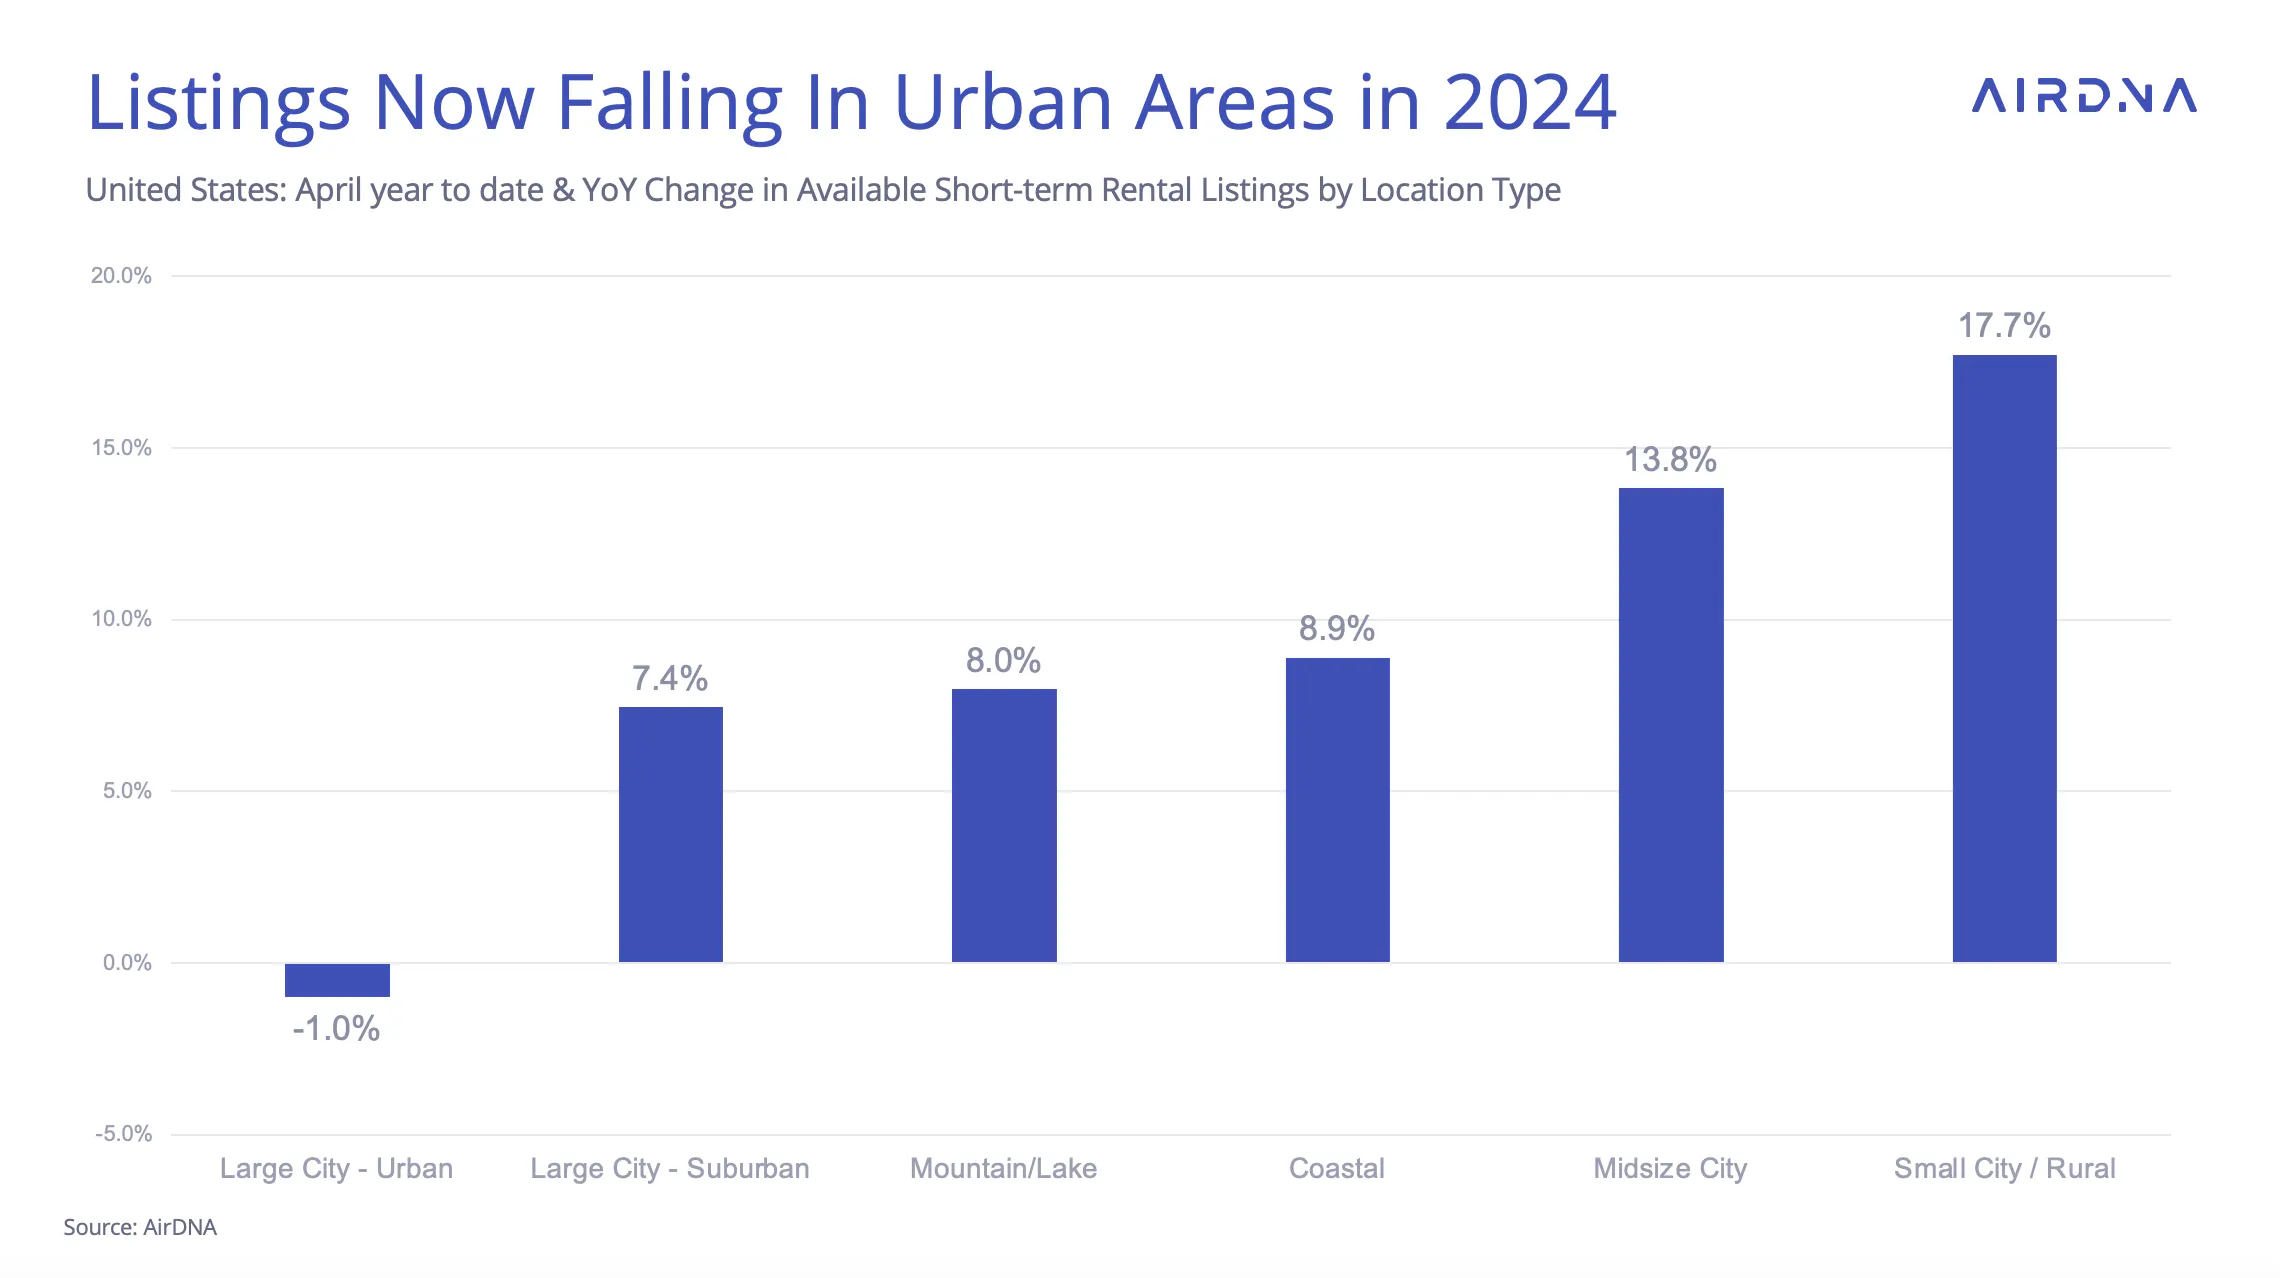
Interest rates aren’t the only driver of supply declines. When examining location types, Large City Urban locations have a dramatically different trajectory than other location types for STRs.
Urban areas are creating and enforcing restrictive regulations, which has slowed investment and STR growth in affected markets. New York is the most prominent example.
Resort locations (Mountain/Lake and Coastal), which prove difficult for investors to develop in because of their isolated geography, have moderate growth. Large City Suburban locations are experiencing similar modest growth. Small City/Rural and Midsize City markets have the quickest growth. This pattern has been the case generally for the past few years.
Ups and Downs Mask Demand Trends
While the trend in supply has been a consistent decline, demand growth has had a chaotic 2024.
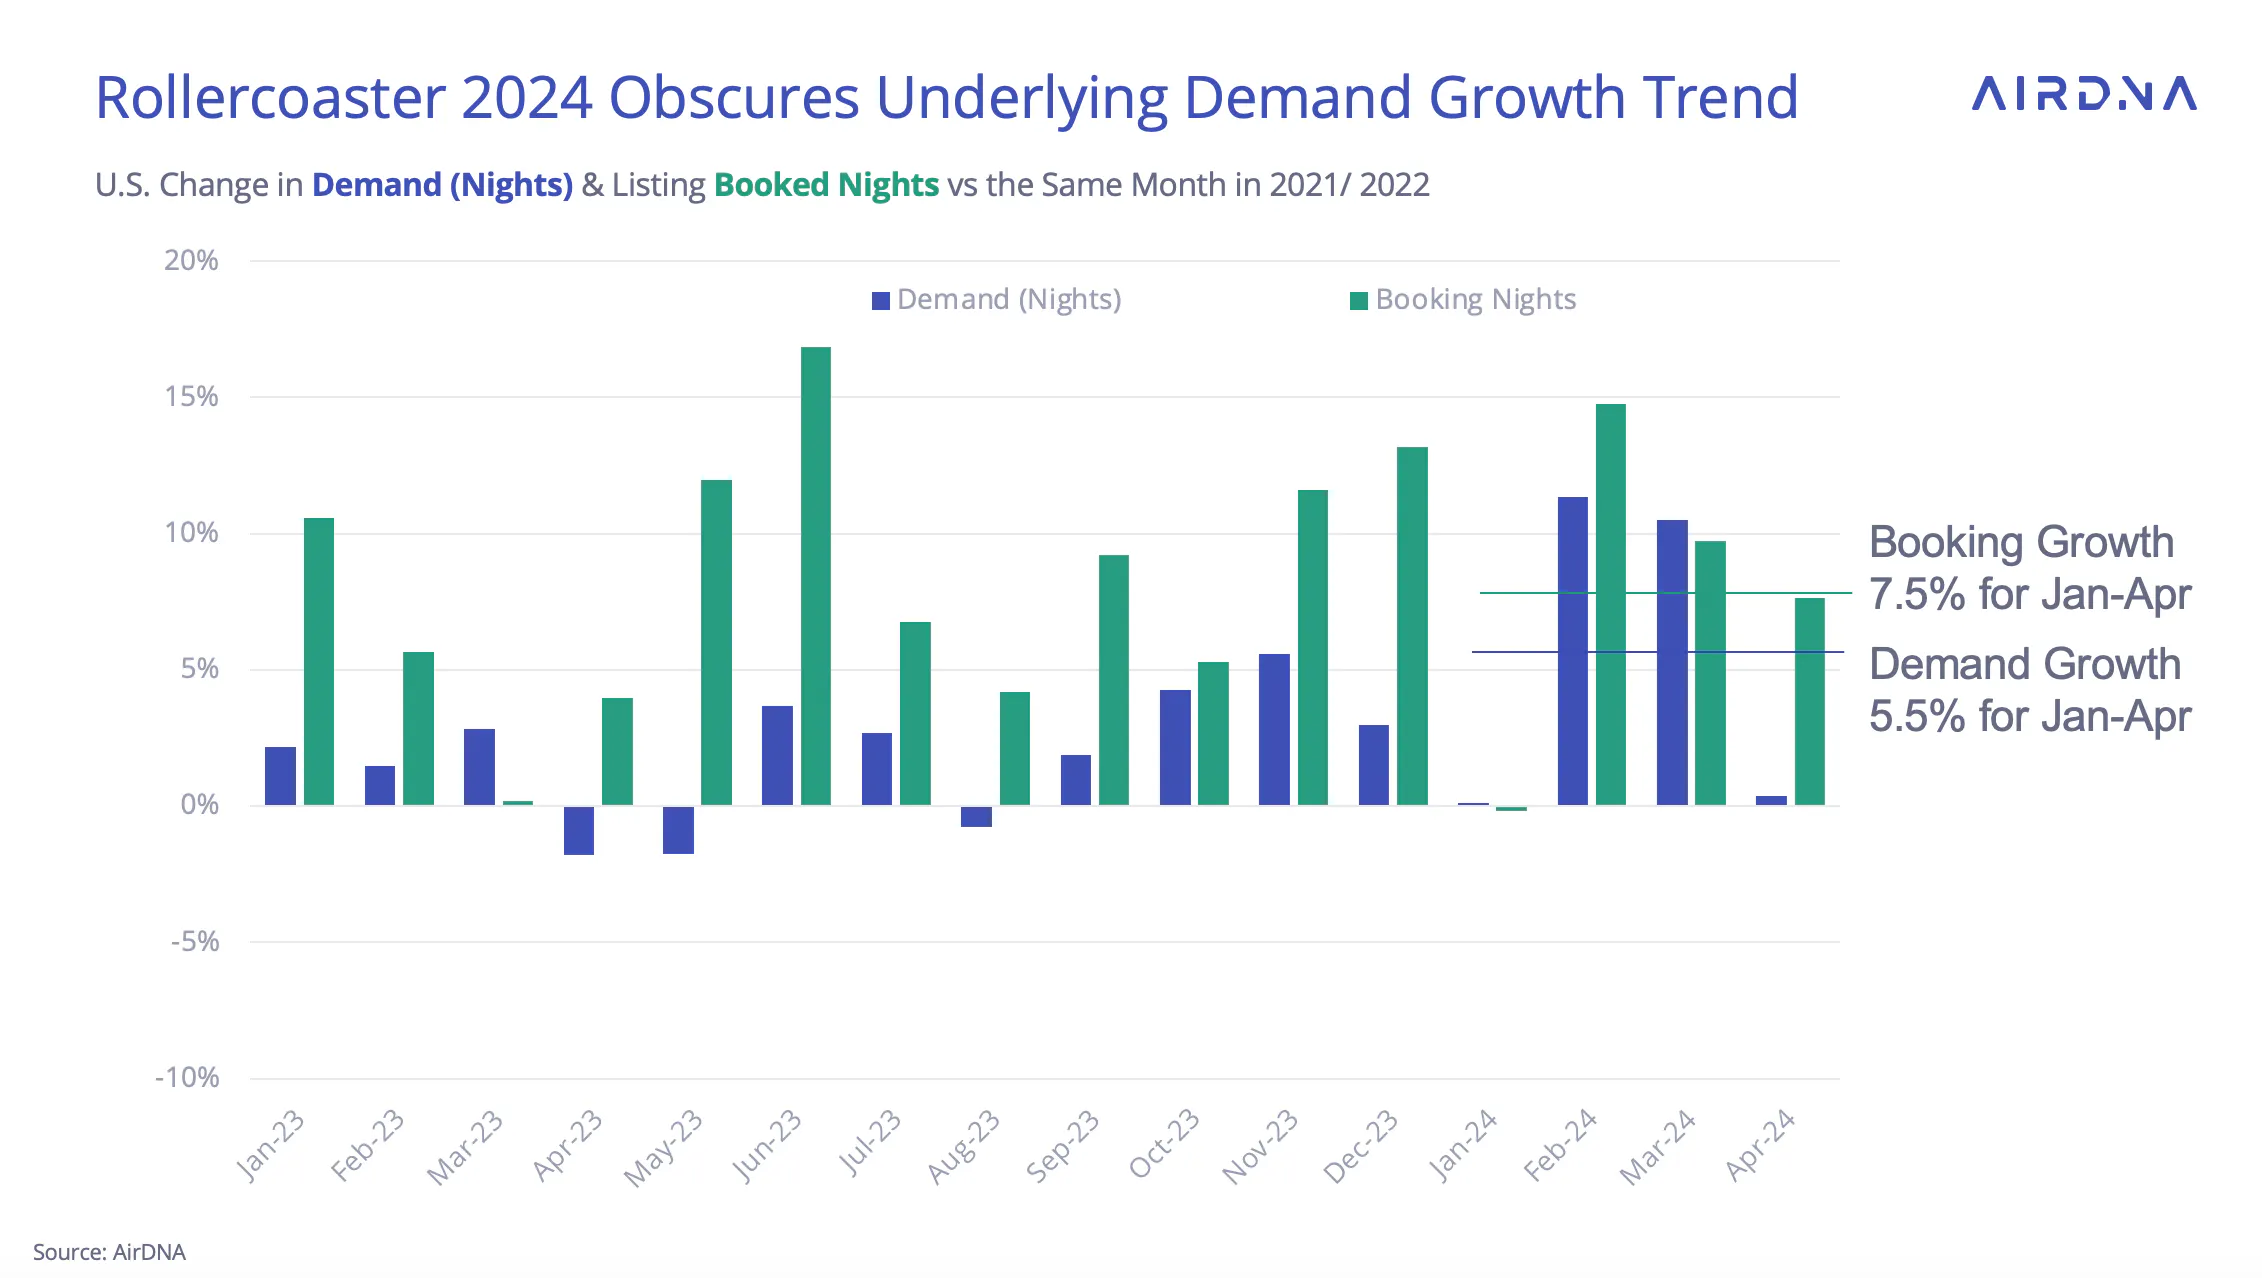
The year started out with a cold snap across the northern States and low snow-pack, leading many winter sport enthusiasts to postpone their ski trips and winter vacations. This left both demand and booking growth near-zero in January. Demand growth bounced back in February, though, with a high of 11.3% that hasn’t been seen since July 2022.
Similarly, the Easter shift that moved many spring breaks from April to March produced high demand growth of 10.5%. Without those same trips in April, however, growth plummeted to a scant 0.4%.
While expected, the sudden drop in demand growth makes identifying trends difficult. When we average the previous four months of demand growth in an effort to even out the performance, we see a demand growth of 5.5%. This rate indicates an upward trajectory compared with 2023. Booked nights, a leading indicator for demand, grew at 7.6% in April. That’s in line with the four-month booking growth average of 7.5%.
Resort Locations See Biggest Easter Effect
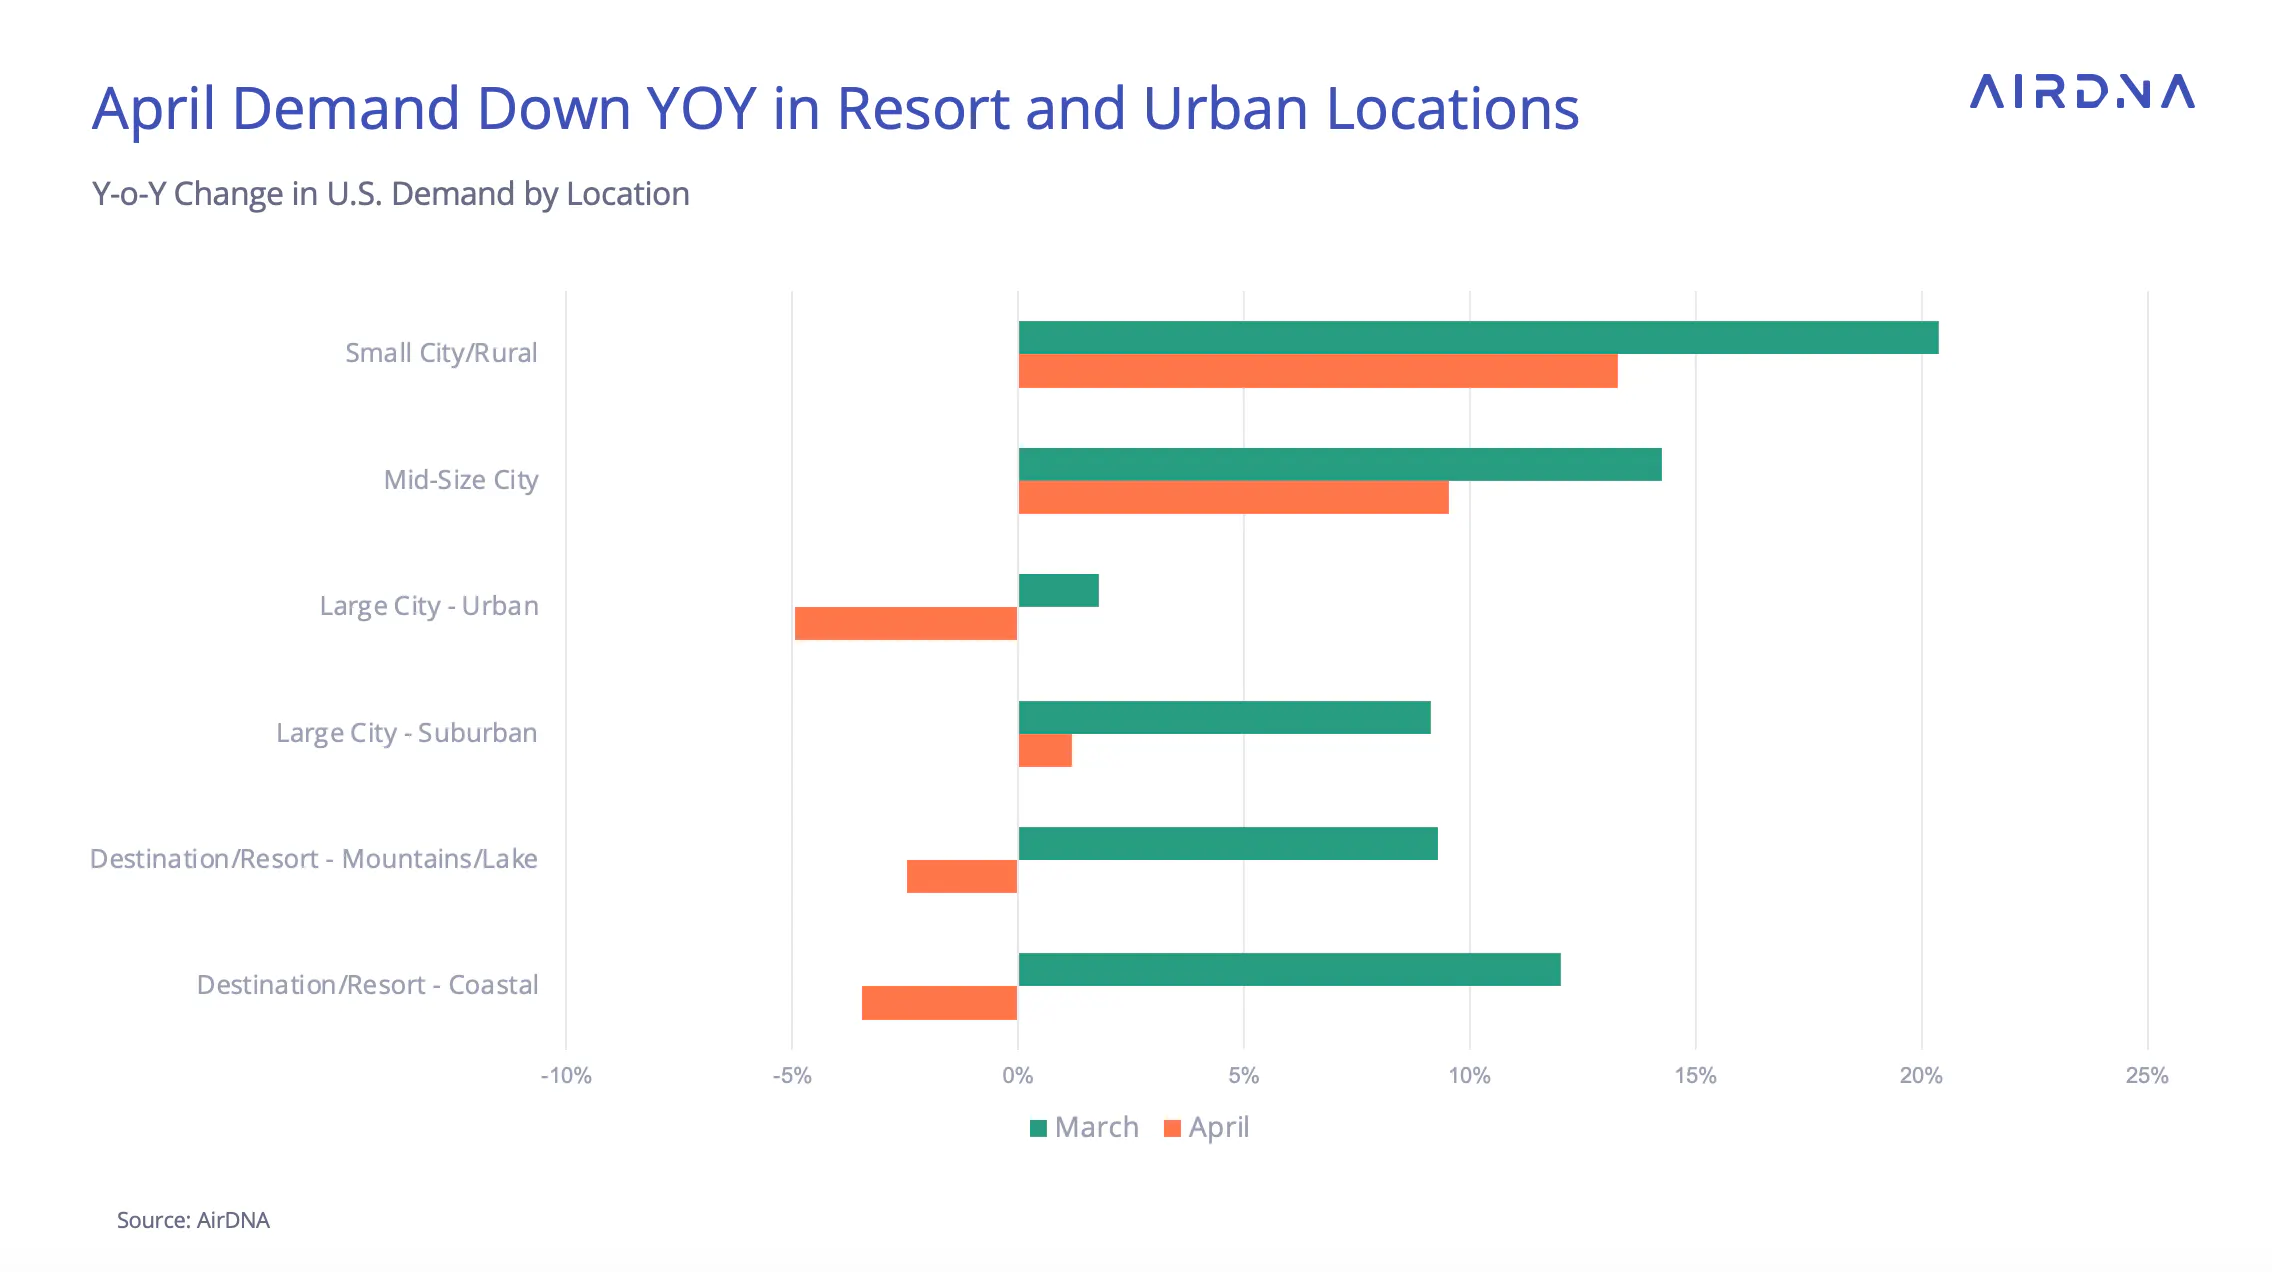
Although all location types had lower demand growth in April compared to March, the effect of the Easter shift can be most clearly observed in the resort locations where many chose to enjoy their spring break. Strong demand growth in March gave way to demand declines in these locations in April.
Occupancy Has Yet to Stabilize
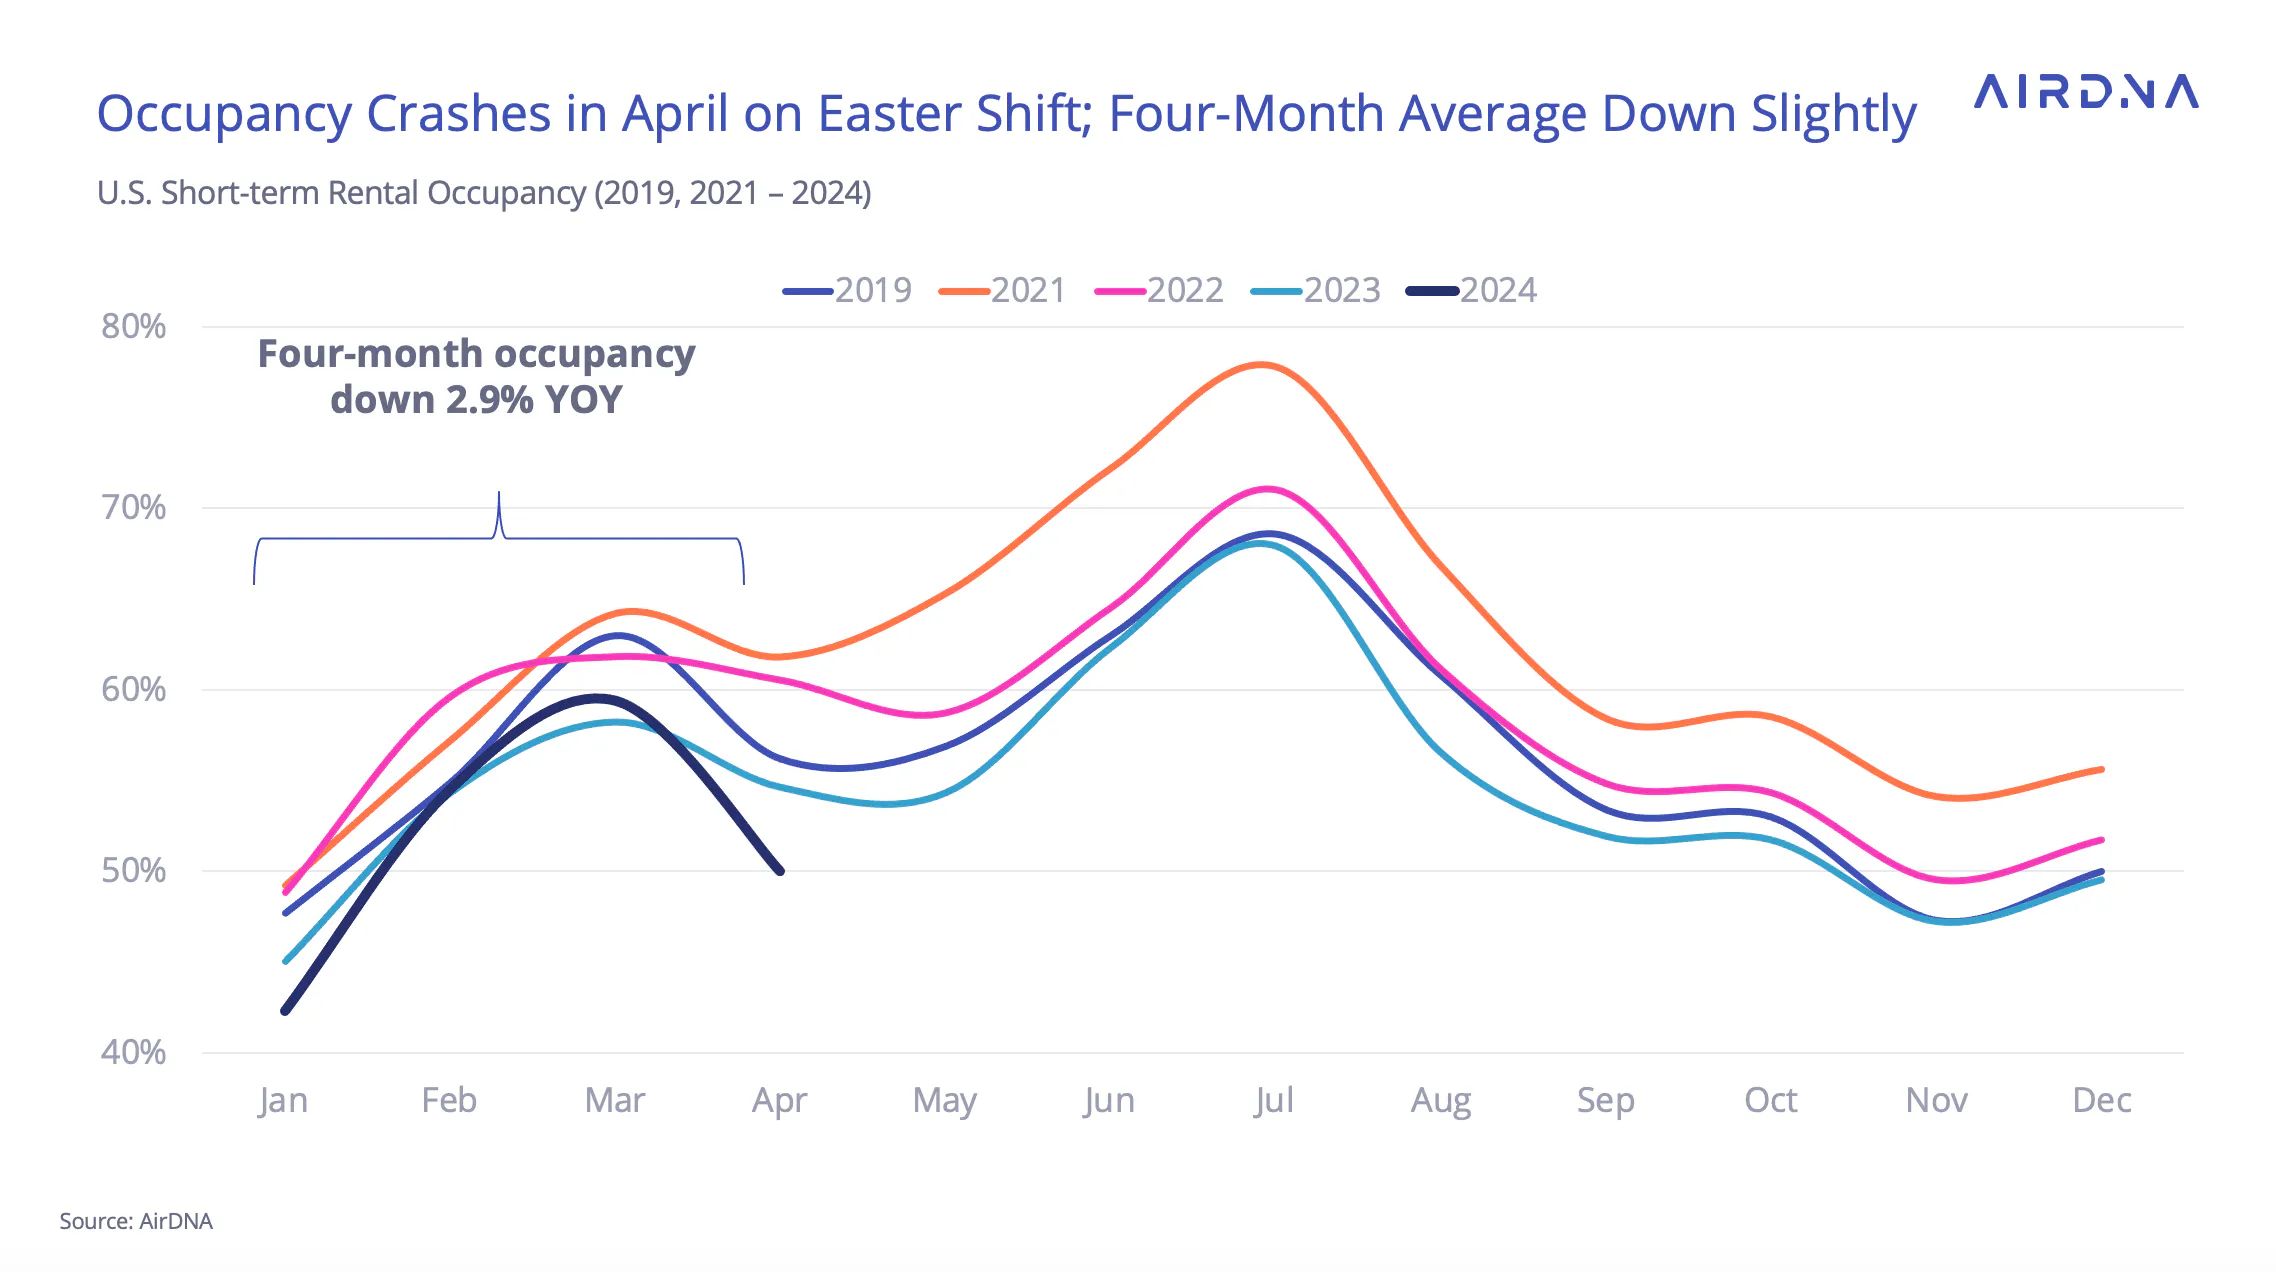
Even though supply growth is slowing and demand is growing so far in 2024, occupancy rates haven’t quite stabilized yet.
Occupancy fell 8.4% due to the weaker demand growth in April. Unlike demand, occupancy is falling year-over-year (YOY) by 2.9%, even when averaging the first four months. That being said, the decline we’re seeing so far in 2024 is less than half of the average occupancy decline of 6% in 2023.
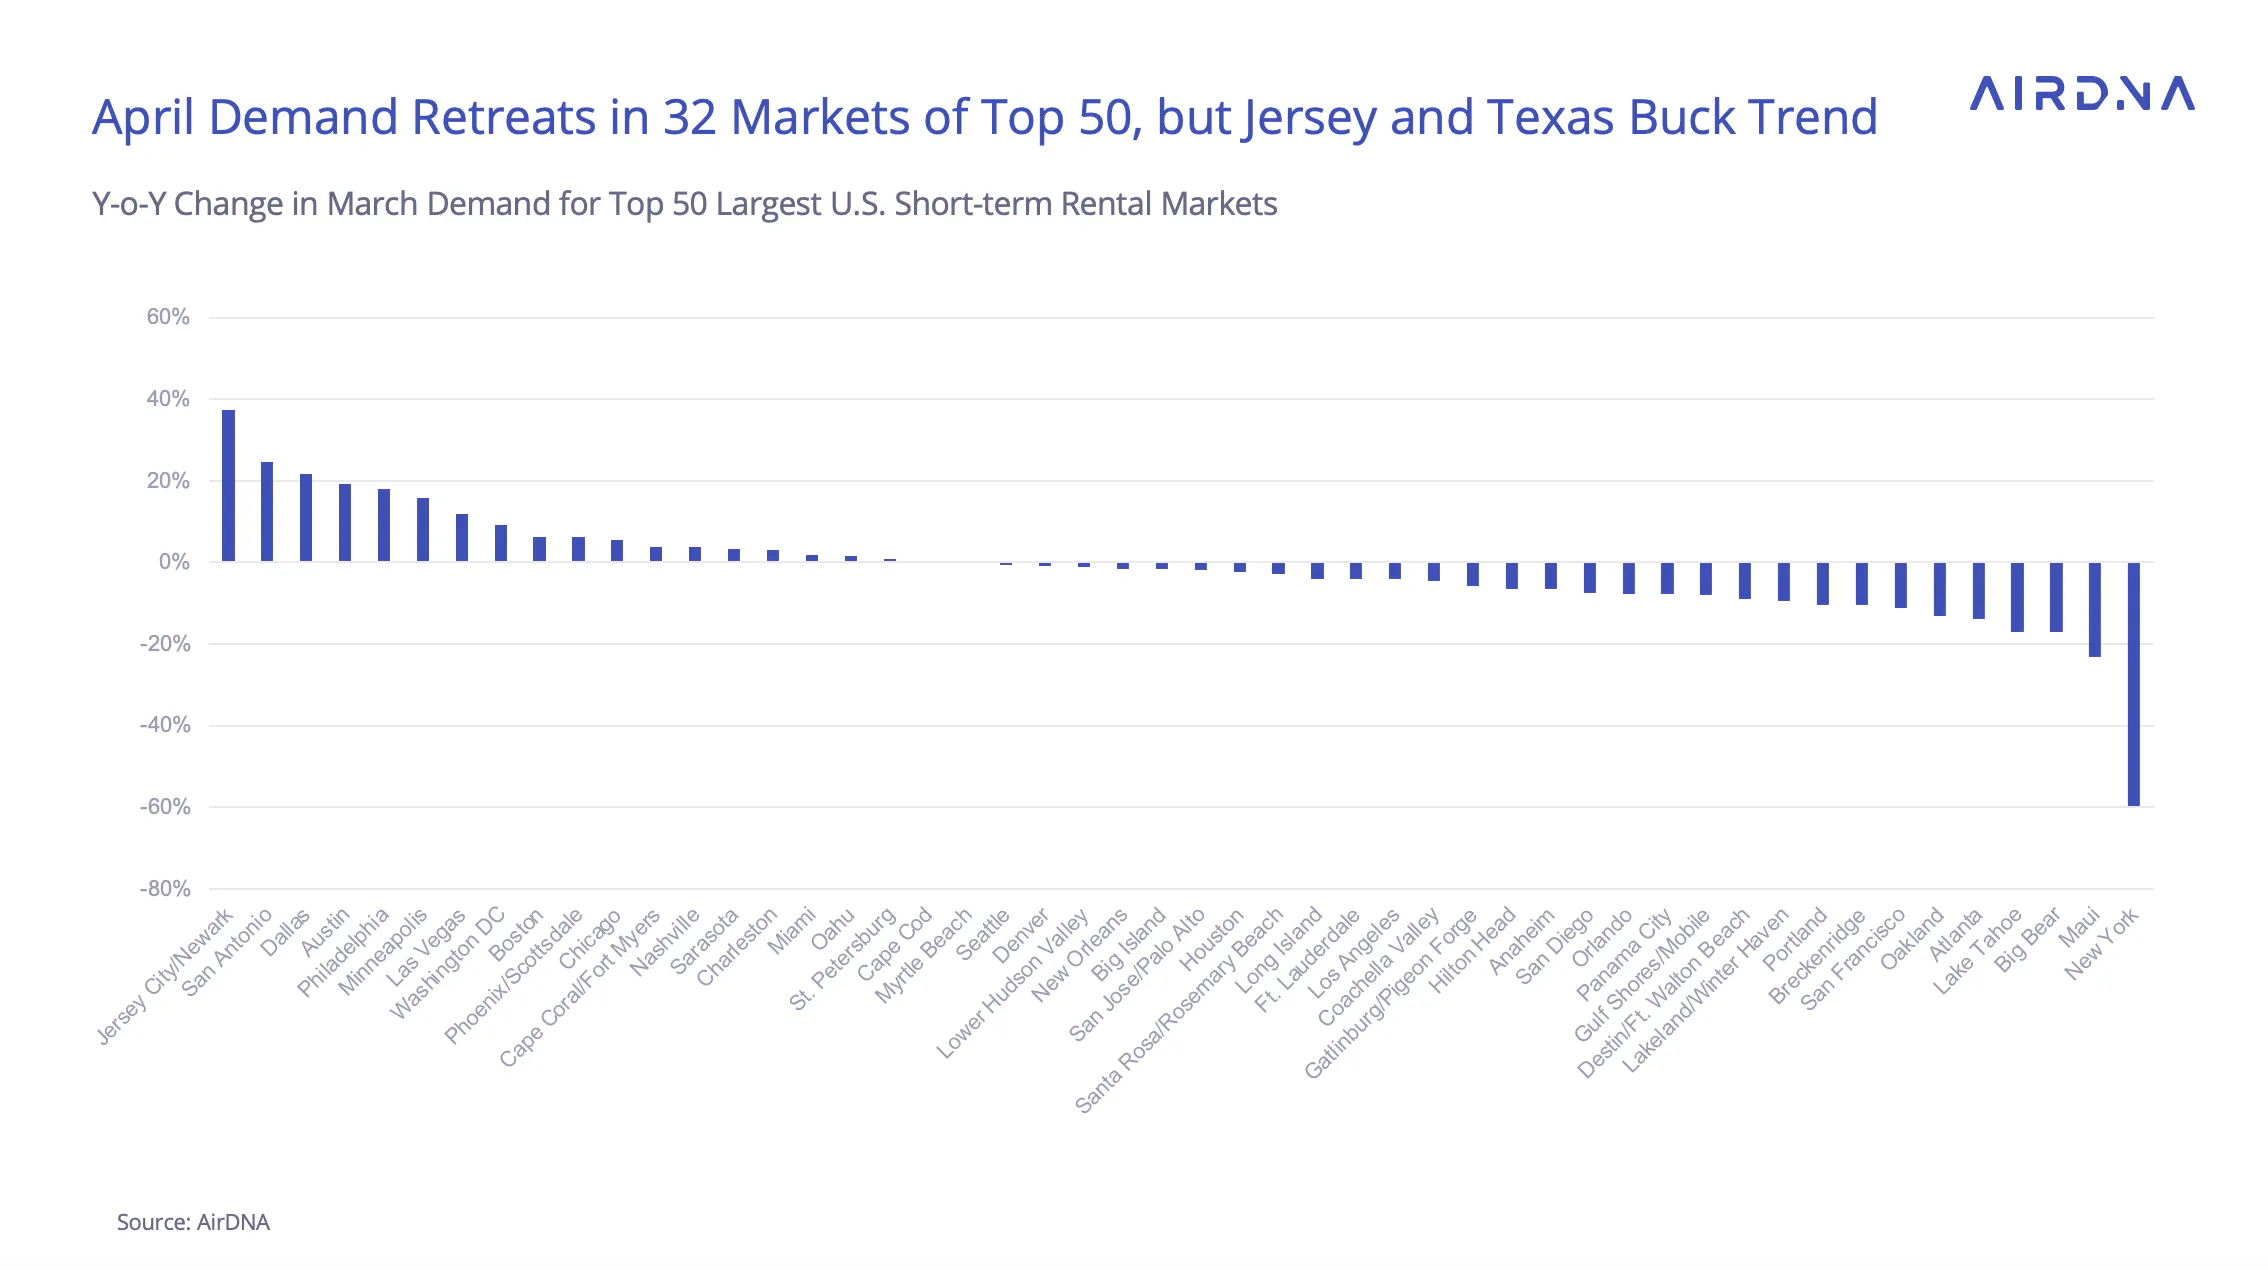
Turning to the markets, hosts across the nation struggled to maintain occupancy. Only 20 out of the total 317 U.S. markets (6.3%) experienced occupancy growth. Three markets experienced YOY demand growth exceeding 20%:
- Jersey City/Newark, New Jersey
- San Antonio, Texas
- Dallas, Texas
ADR Growth is Positive Amidst Uncertainty
Demand and supply trends show signs of improvement for the upcoming travel season, but prices are one area where an unambiguously positive turn has already happened.
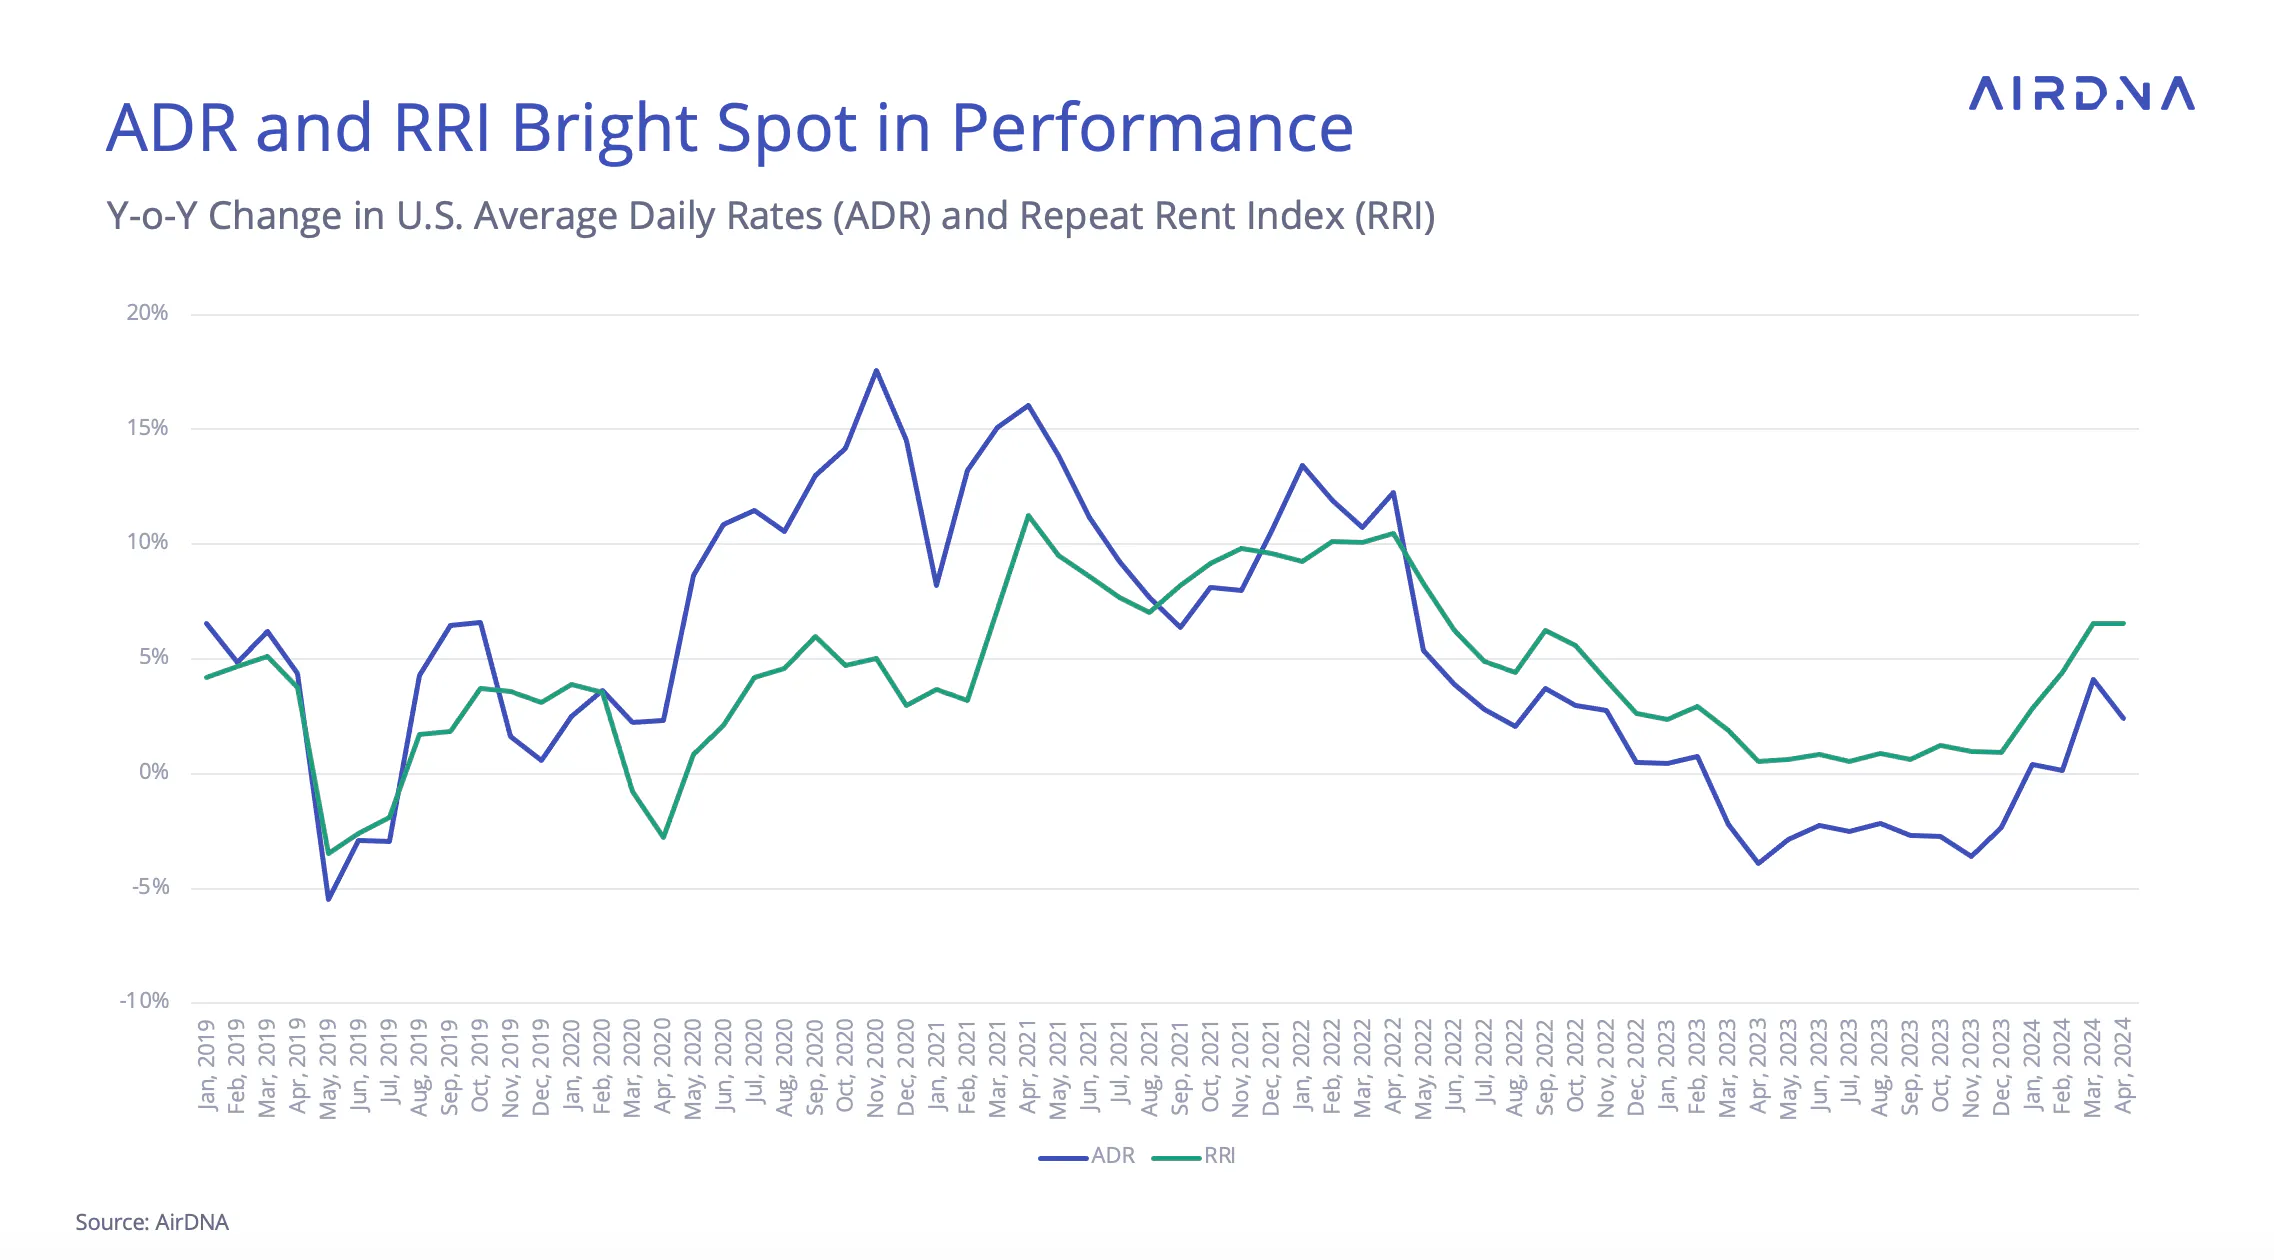
After ten months of YOY declines in average daily rates (ADR), every month in 2024 has had ADR growth with a visible upward trajectory. The Easter shift seems to have lowered April ADR growth (+2.4% in April versus 4.0% in March). However, the AirDNA Repeat Rent Index (RRI) indicates that this decline was due to a mix shift. Mix shift means that lower ADRs are due to newly listed properties offering lower rates, rather than existing operators lowering their prices.
Pacing Data Suggests a Strong Summer
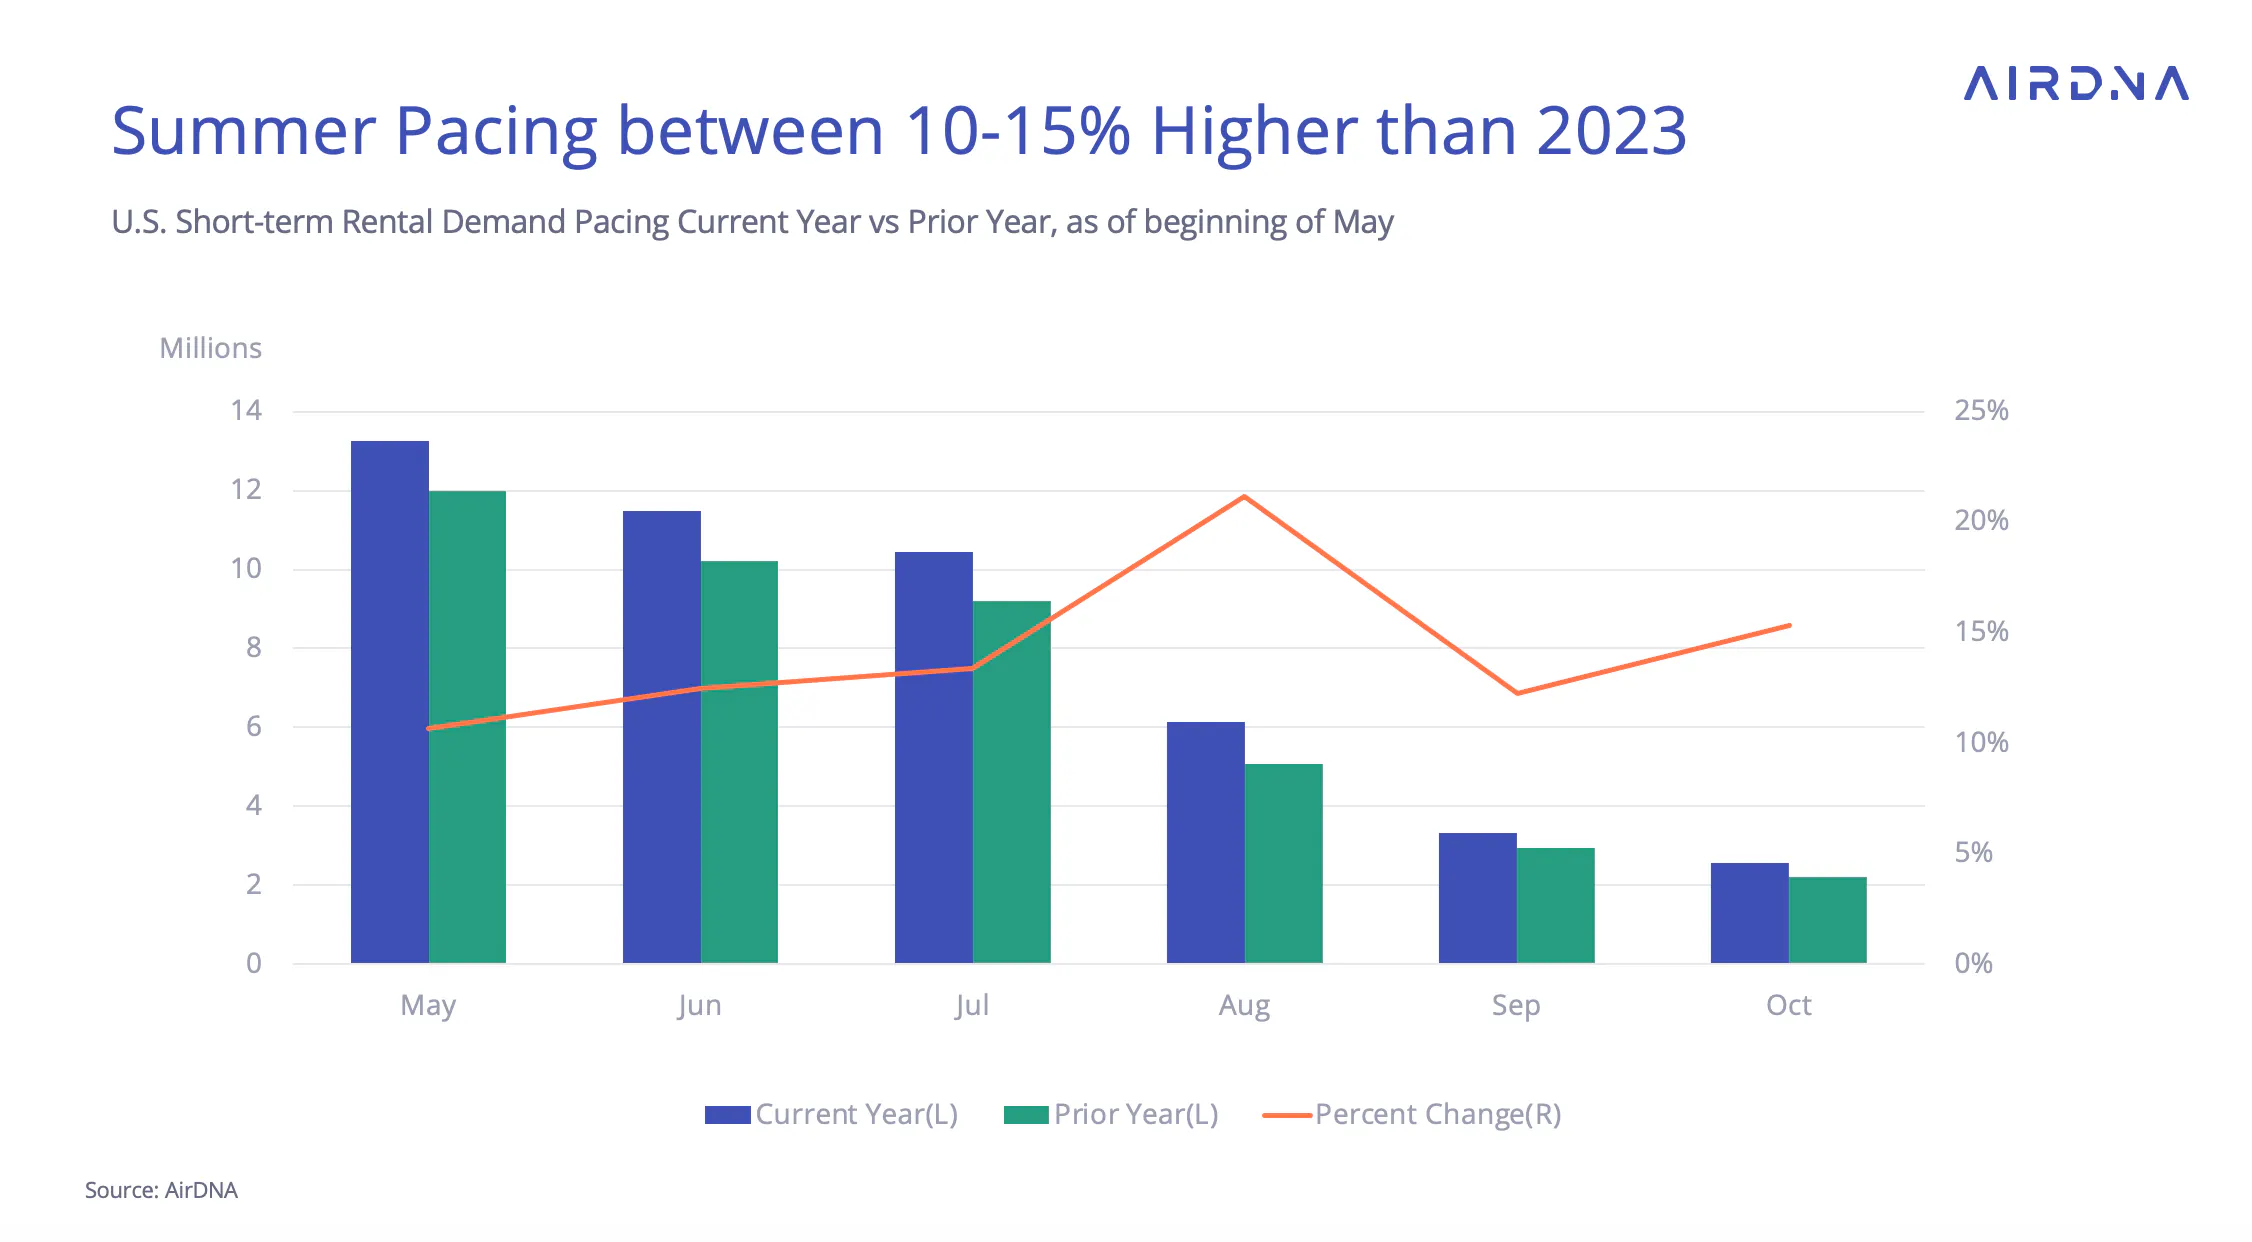
According to pacing data, we may be stepping off the demand growth rollercoaster. The next six months have strong, consistent growth between 10-15% YOY. August is pacing 21.2% higher than last year, which had a relatively weak performance in 2023.
Keep in mind that the actual demand growth numbers may not achieve these 10-15% projections, since renewed economic confidence (relative to the same time in 2023) would tend to lengthen lead times. Nevertheless, the current pattern suggests that demand and supply may find a balance this summer, slowing or halting occupancy losses.
Commencement Brings Demand to College Towns
The month of May, besides kicking off the summer travel season with Memorial Day Weekend, has another source of repeated demand: graduation ceremonies in college towns across the country.
AirDNA performed an analysis of how commencement for all U.S. college towns in 2023 affected the short-term rental market, and now data is in for the top demand growth towns for 2024 as well.
Our original analysis looked at demand during commencement weekend compared to the weeks before and after. Since some ceremonies only occurred last week, we can only compare with the week prior at this time. Methodology caveats aside, Tuscaloosa, home to the University of Alabama, retains its top spot in 2024.
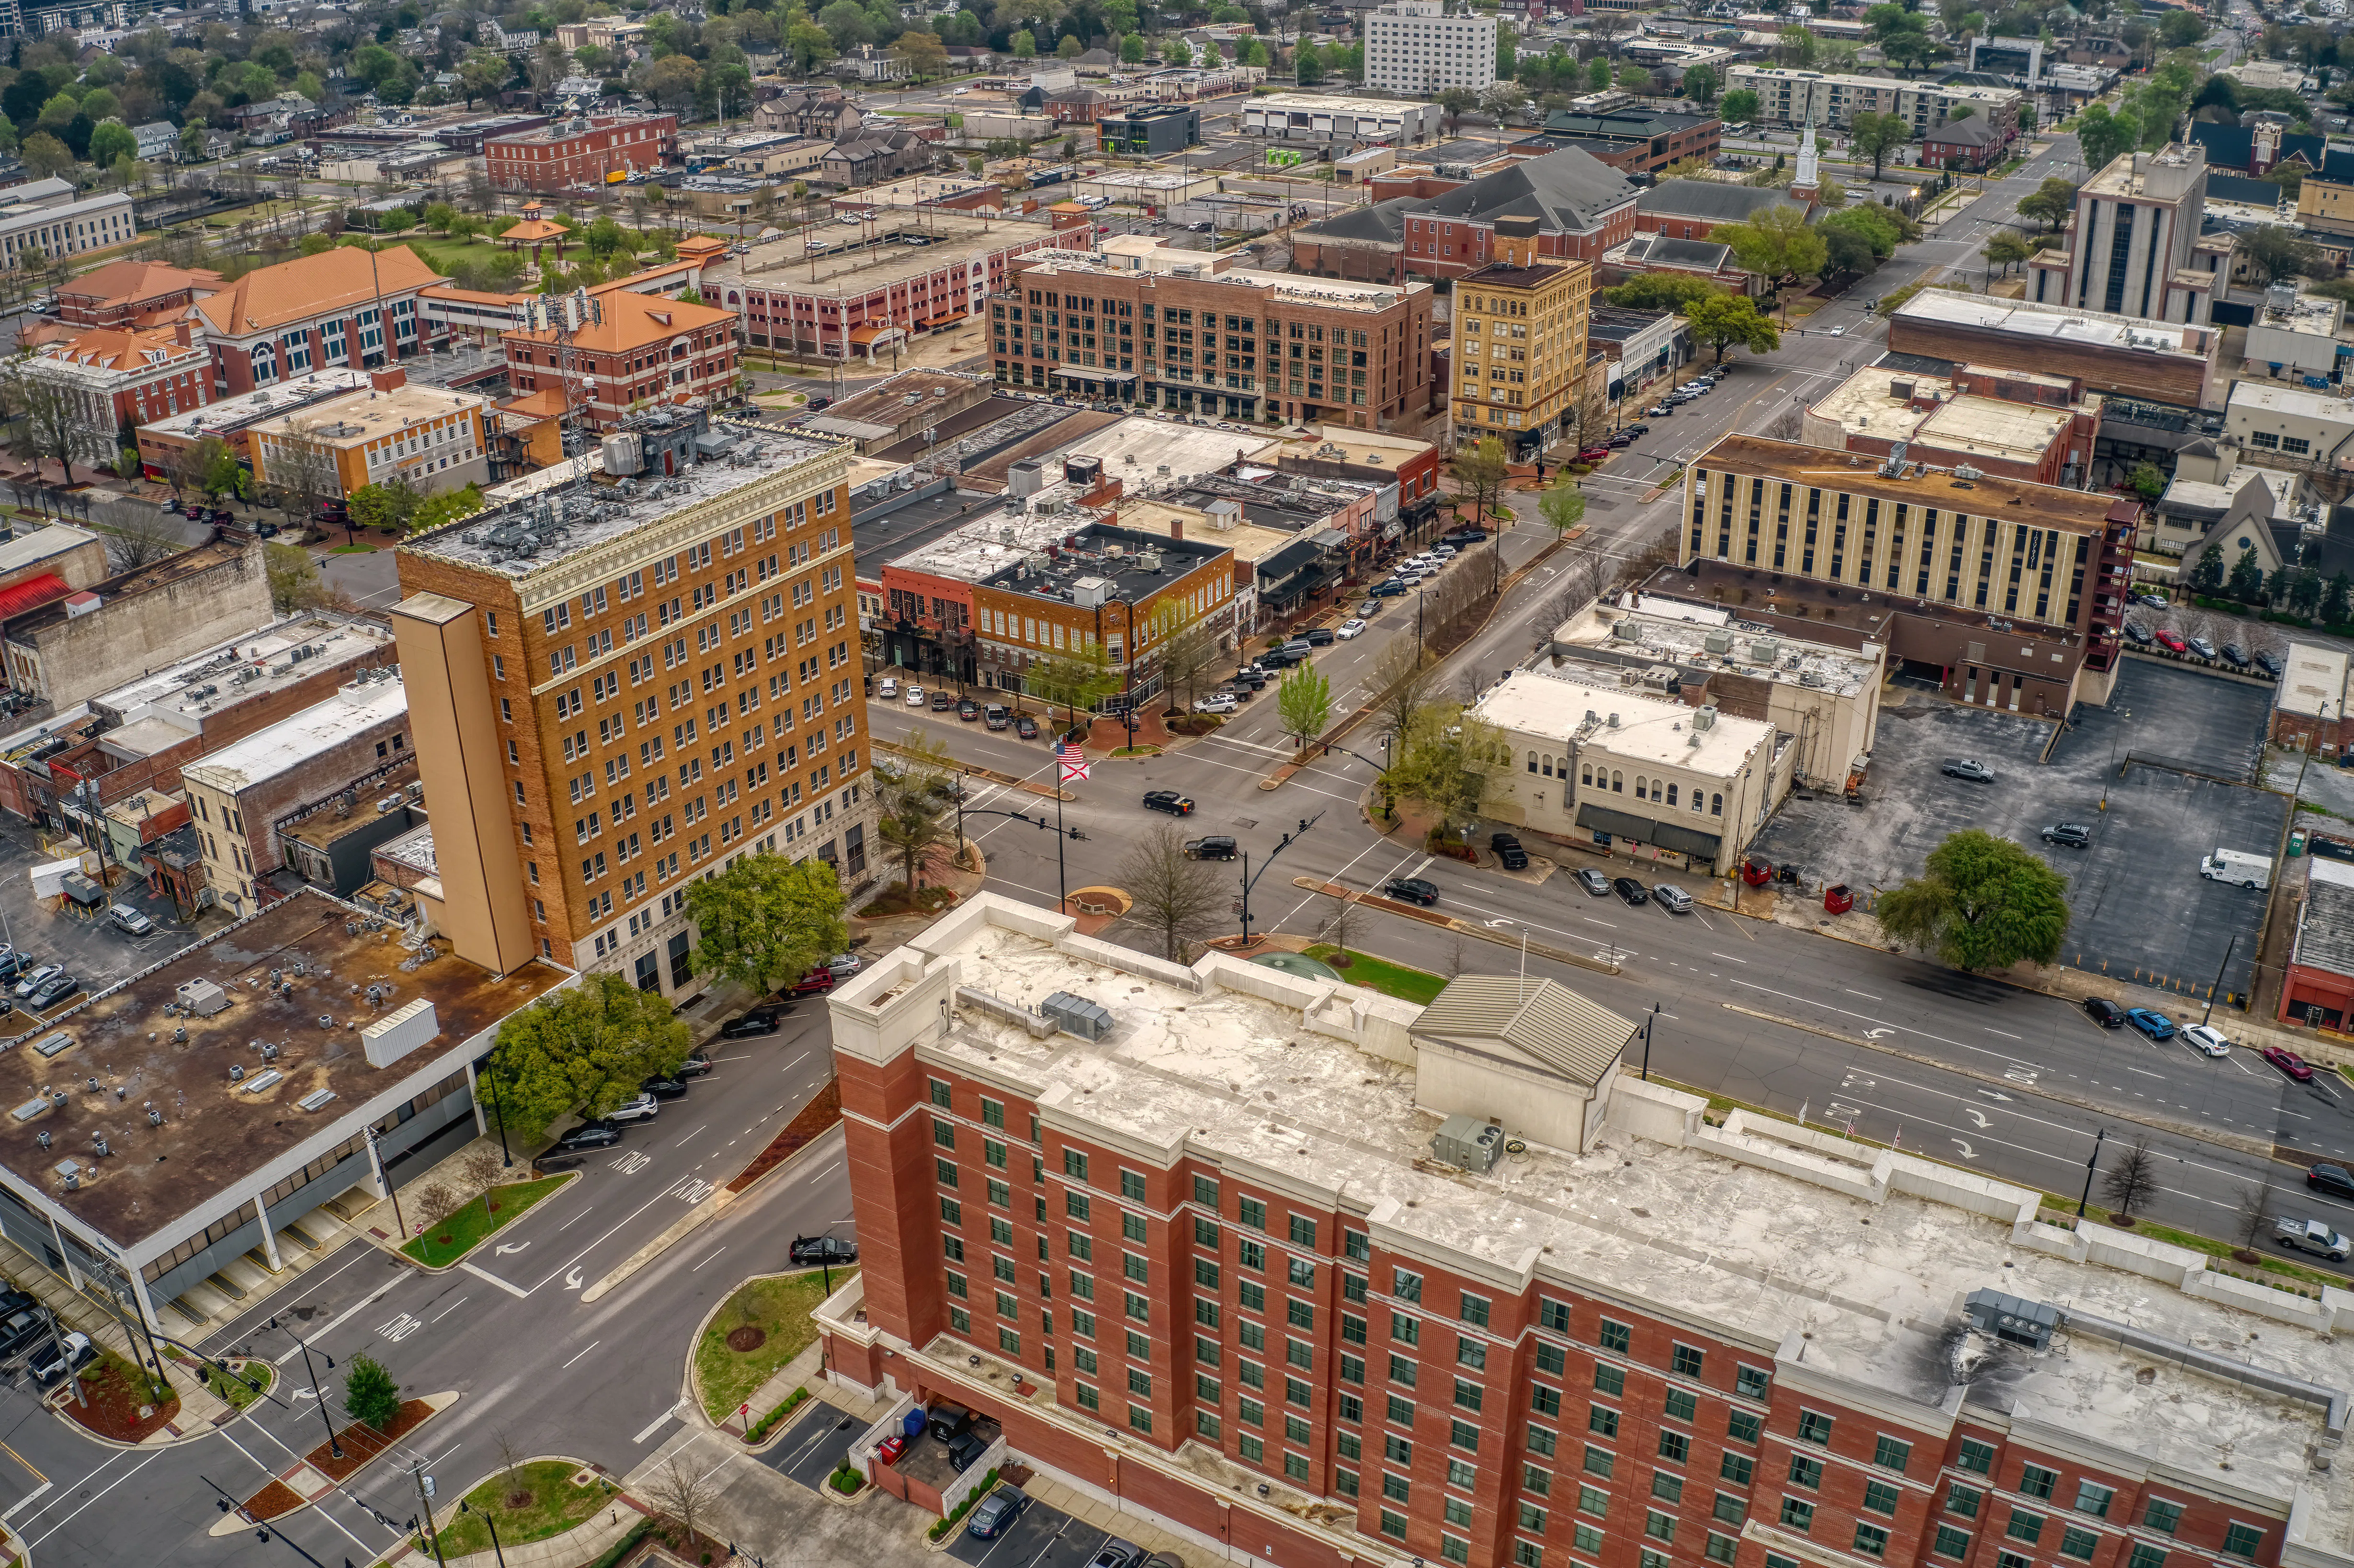
Tuscaloosa’s experienced 358.6% higher demand during commencement compared to the weekend prior. Virginia Tech is a distant second with 184.4% growth.
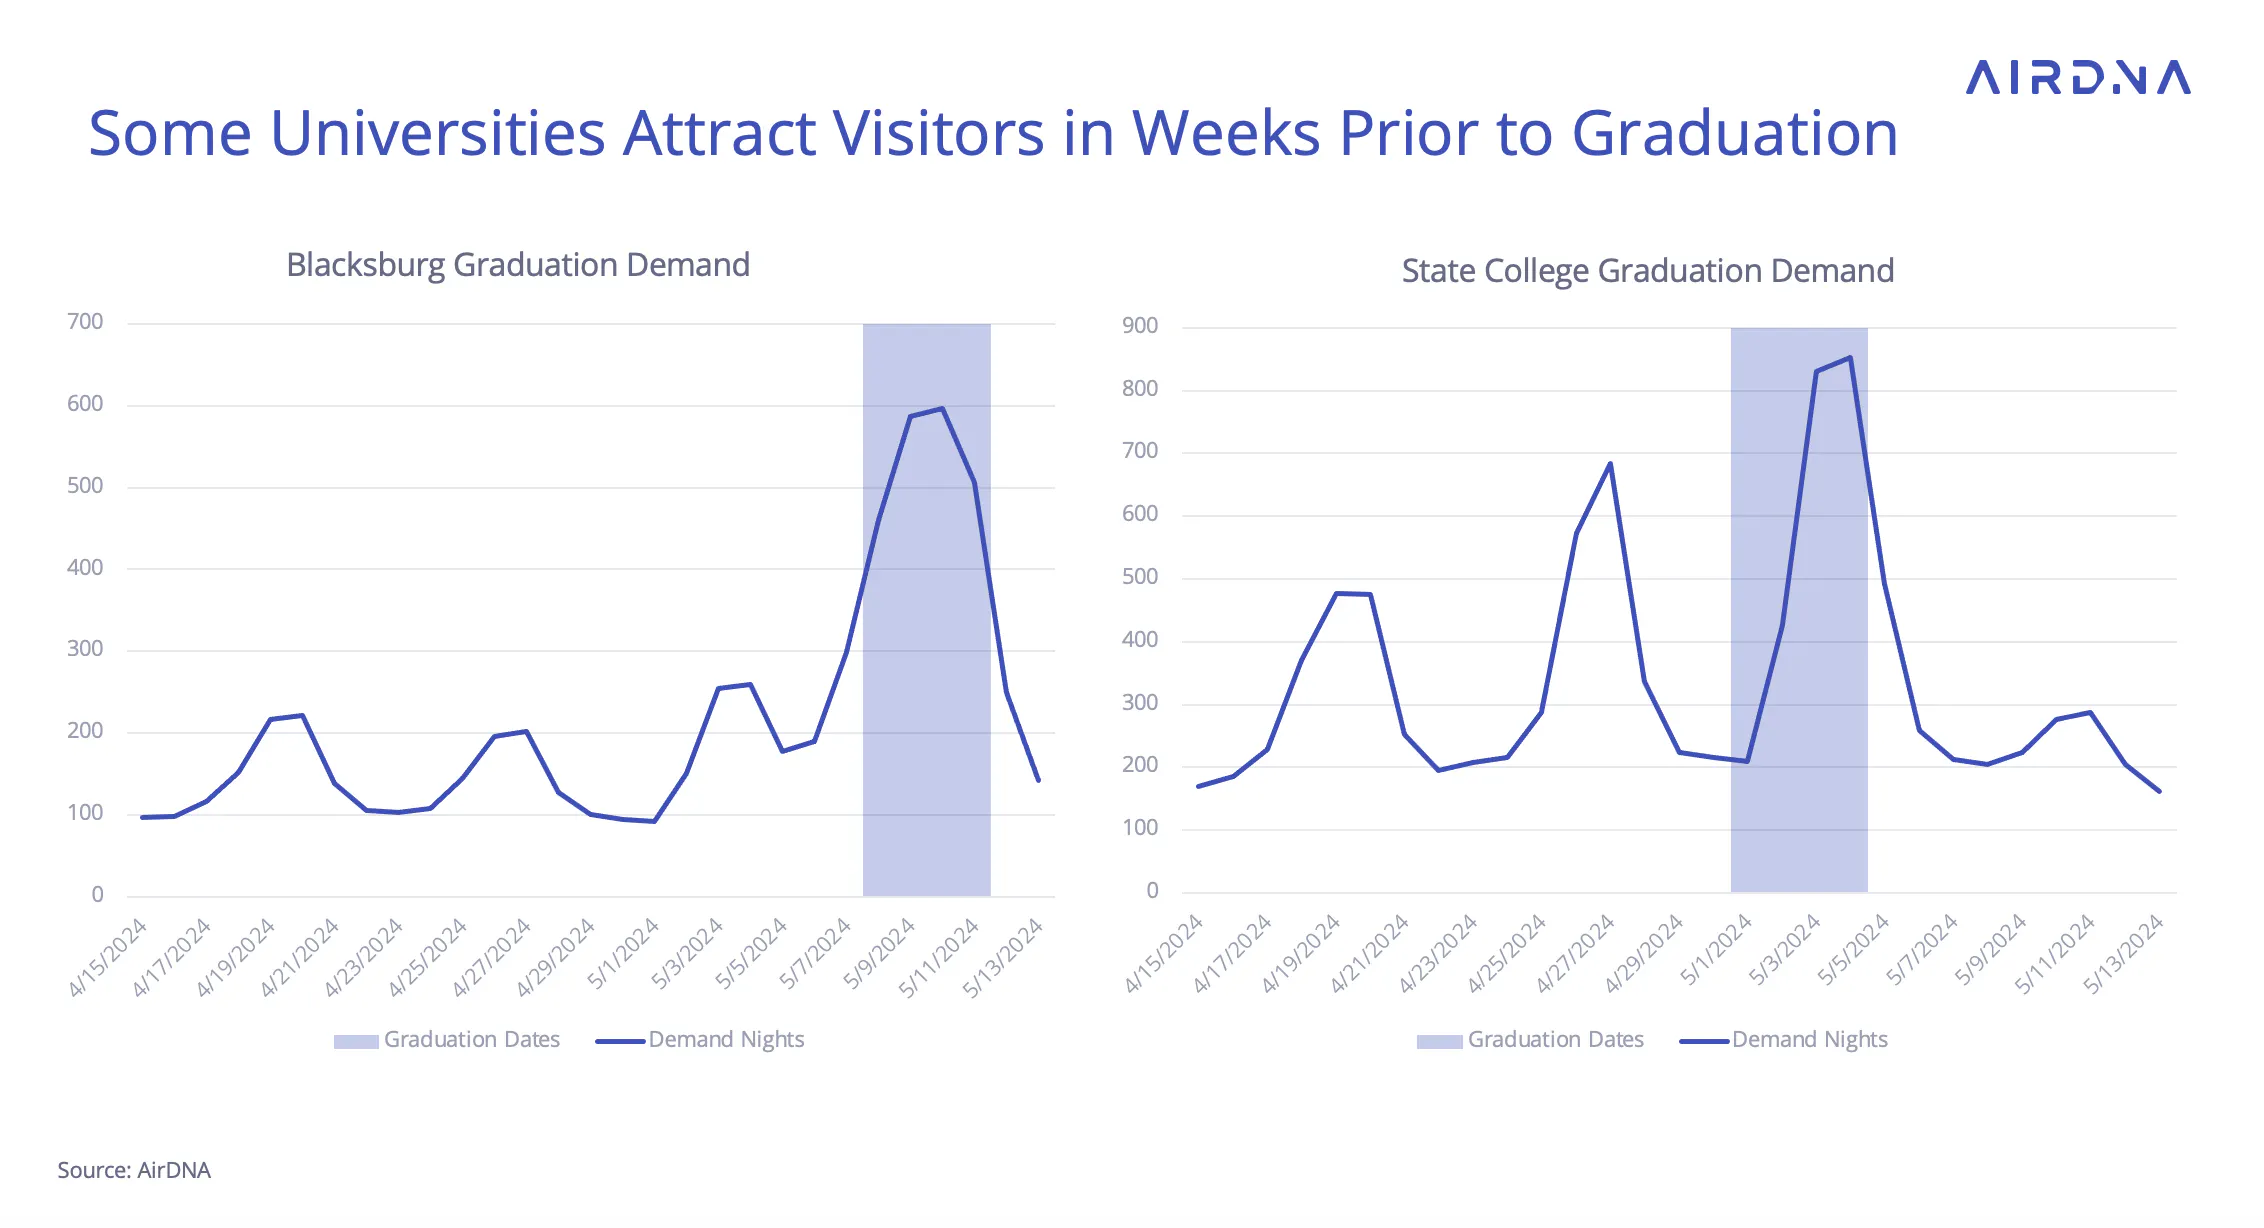
Penn State, the second-place finisher for 2023, drops considerably in the rankings for 2024. This isn’t due to flagging demand, however. If anything, demand during the weeks leading up to commencement seemed to attract additional demand. This resulted in a smaller difference in demand between pre-commencement dates and commencement weekend.
Penn State’s trend is a considerable contrast to Blacksburg, home of Virginia Tech. There, weekend demand picks up only very slightly in the week prior to graduation.
Typically, college towns have very strong demand during commencement and during home football games, but have much lower demand during other times of the year. An additional spring weekend of strong demand leading up to commencement may represent a welcome windfall for operators in State College.
ARTICLE SUMMARY
April's U.S. STR market experienced a demand dip due to Easter moving to March, resulting in minimal growth for the month. However, the first four months of 2024 still show an overall positive trend in demand compared to the same period in 2023.
Scott Sage
Senior Vice President, Marketing & Customer Experience
Scott is an Airbnb Superhost and industry pro, having founded Home Base BnBs—a short term rental management company that scaled to 200+ units. Scott combines his experience and passion for hosting to empower AirDNA customers' success. When he's not thinking about STRs, he is hiking, playing basketball, or playing pickleball.