U.S. Market Review: STR Market Gears Up for Spring With Highest RevPAR Growth Rate in Nearly Two Years
Published: April 17, 2024
Last updated: February 24, 2025

Bram Gallagher
Revenue per available rental (RevPAR) grew 6.1% on a year-over-year (YOY) basis, the highest rate since April 2022. Slowing supply growth and a calendar shift that bumped many Spring Break holidays from April to March lead to a 2.0% YOY spike in occupancy; average daily rates (ADR) also increased for the third month in a row, jumping up 4.0% YOY.
A mix shift, or changes in the ratio of new and existing properties, isn’t the only force at play here, either. The AirDNA Repeat Rent Index (RRI), which isolates the performance of existing properties and removes the effect of new listings, showed an even larger gain of 6.5% YOY.
This positive performance represents a welcome two-month streak of strong demand and booking activity after a dismal January and weak February in comparison to 2023. March’s resurgence was a bright spot for the year and helped reinforce many hosts’ and investors’ hopes for a lively 2024 spring and summer travel season.
Employment and Inflation
The economy performed well in March, but inflation also reached its highest level (3.5% YOY, as measured by the Consumer Price Index, or CPI) since September. The interplay of economic output and inflation reflect The Federal Reserve’s efforts to reduce inflation without throttling the economy with high interest rates. However, March’s higher inflation rate might have been more troubling if it accompanied weakening economic performance.
Fortunately, economic performance was actually quite strong. The March jobs report showed that a strong 303,000 new jobs were added to the economy. This was the strongest month for new jobs since May 2023, helping push the unemployment rate down from 3.9% in February to 3.8% in March. Hourly earnings growth, while still above inflation, declined slightly, from 4.3% YOY in February to 4.1% in March, meaning the uptick in inflation doesn’t appear to be driven by a wage spiral just yet.
The month’s performance seems to indicate both that more needs to be done to address inflation and that the economy isn’t suffering substantially. The Federal Reserve may have delayed its rate cuts, and there is some speculation that there may only be two cuts in 2024, rather than the three many experts hoped for. On the other hand, the changes are small, and the Fed may chalk up the higher inflation in March to statistical noise as more data comes in.
At a Glance: Key U.S. STR Performance Metrics for March 2024
- RevPAR increased 6.1% YOY to $196.15
- Available listings were 1.57 million, up 12.3% YOY
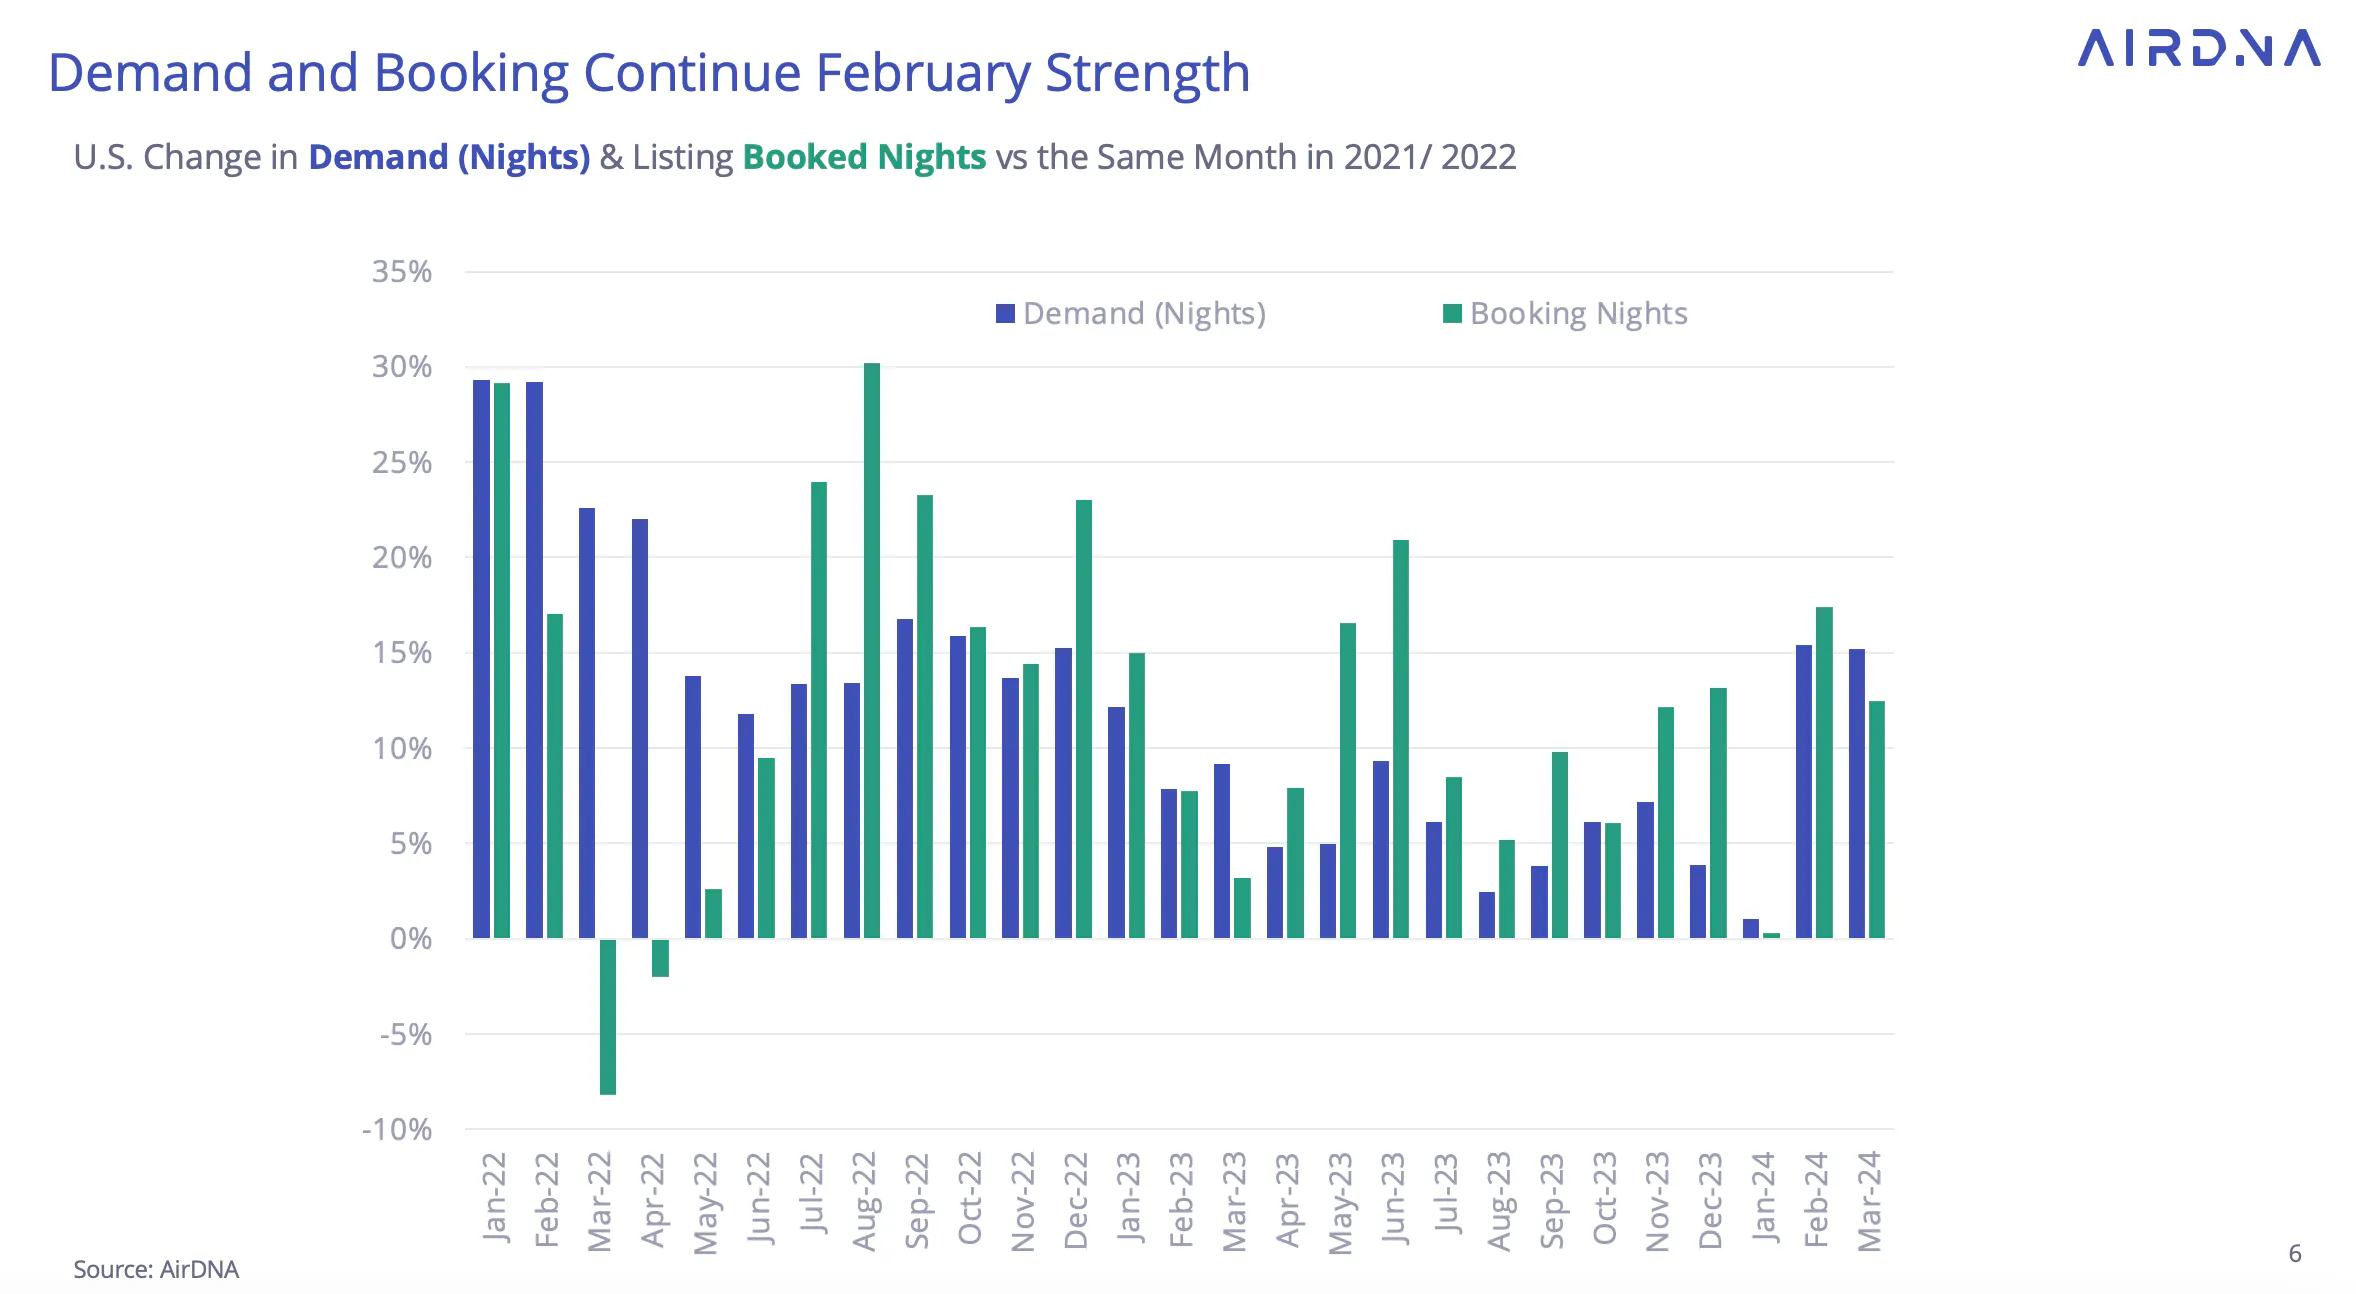
- Total demand (nights) rose 15.2% YOY
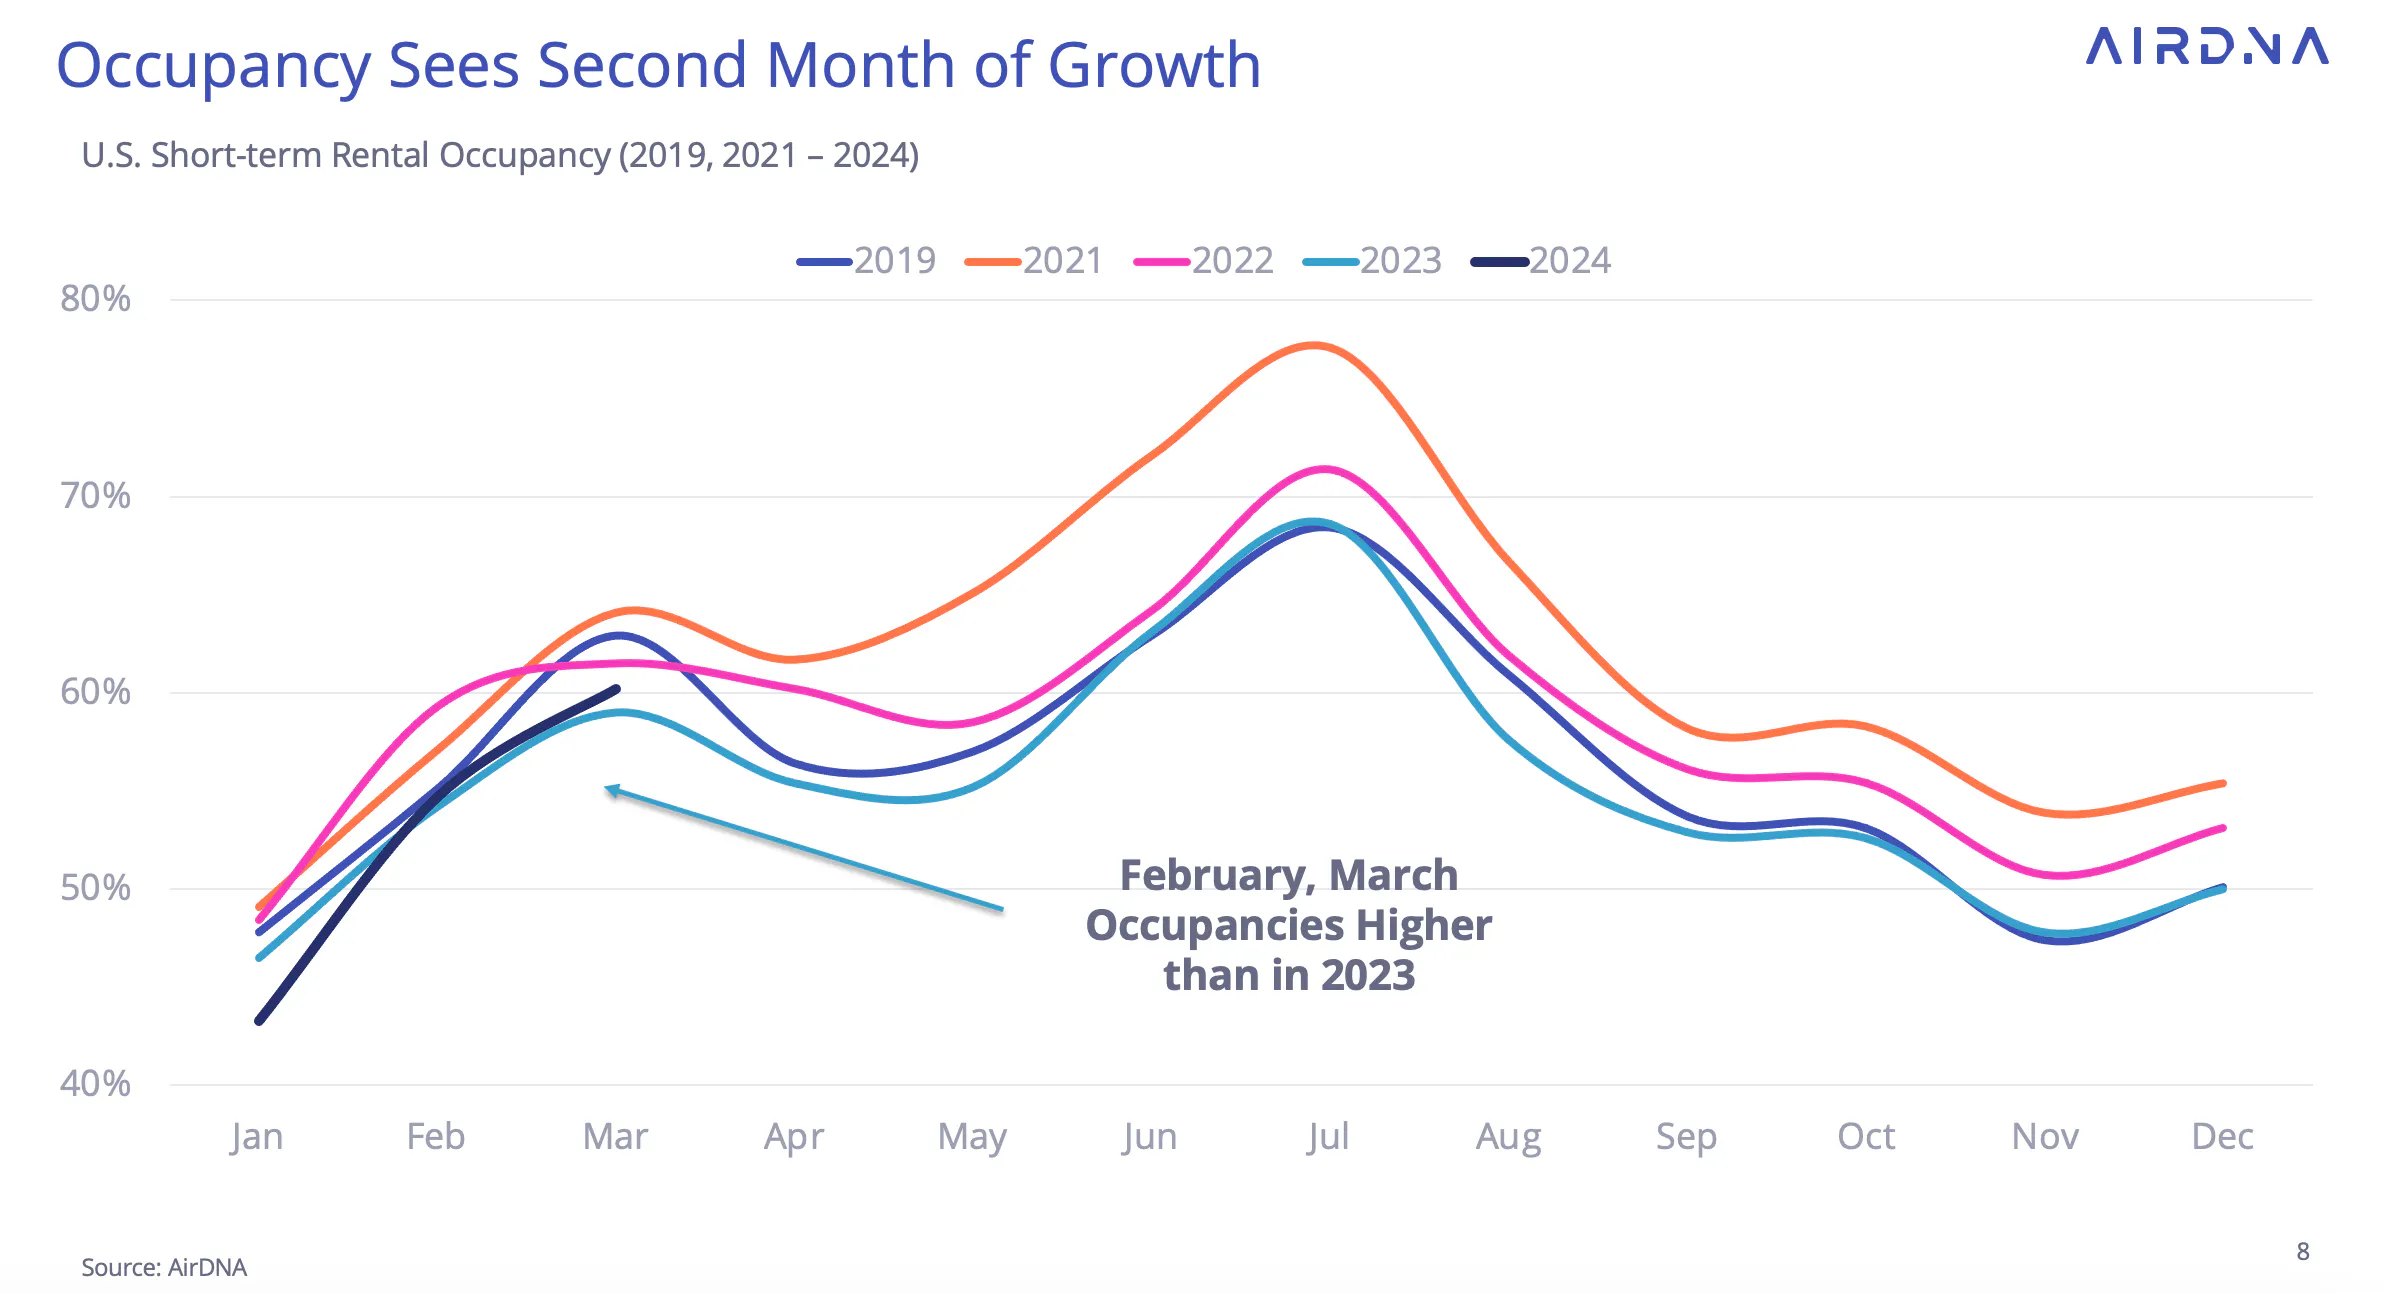
- Occupancy was 2.0% higher YOY at 60.2%
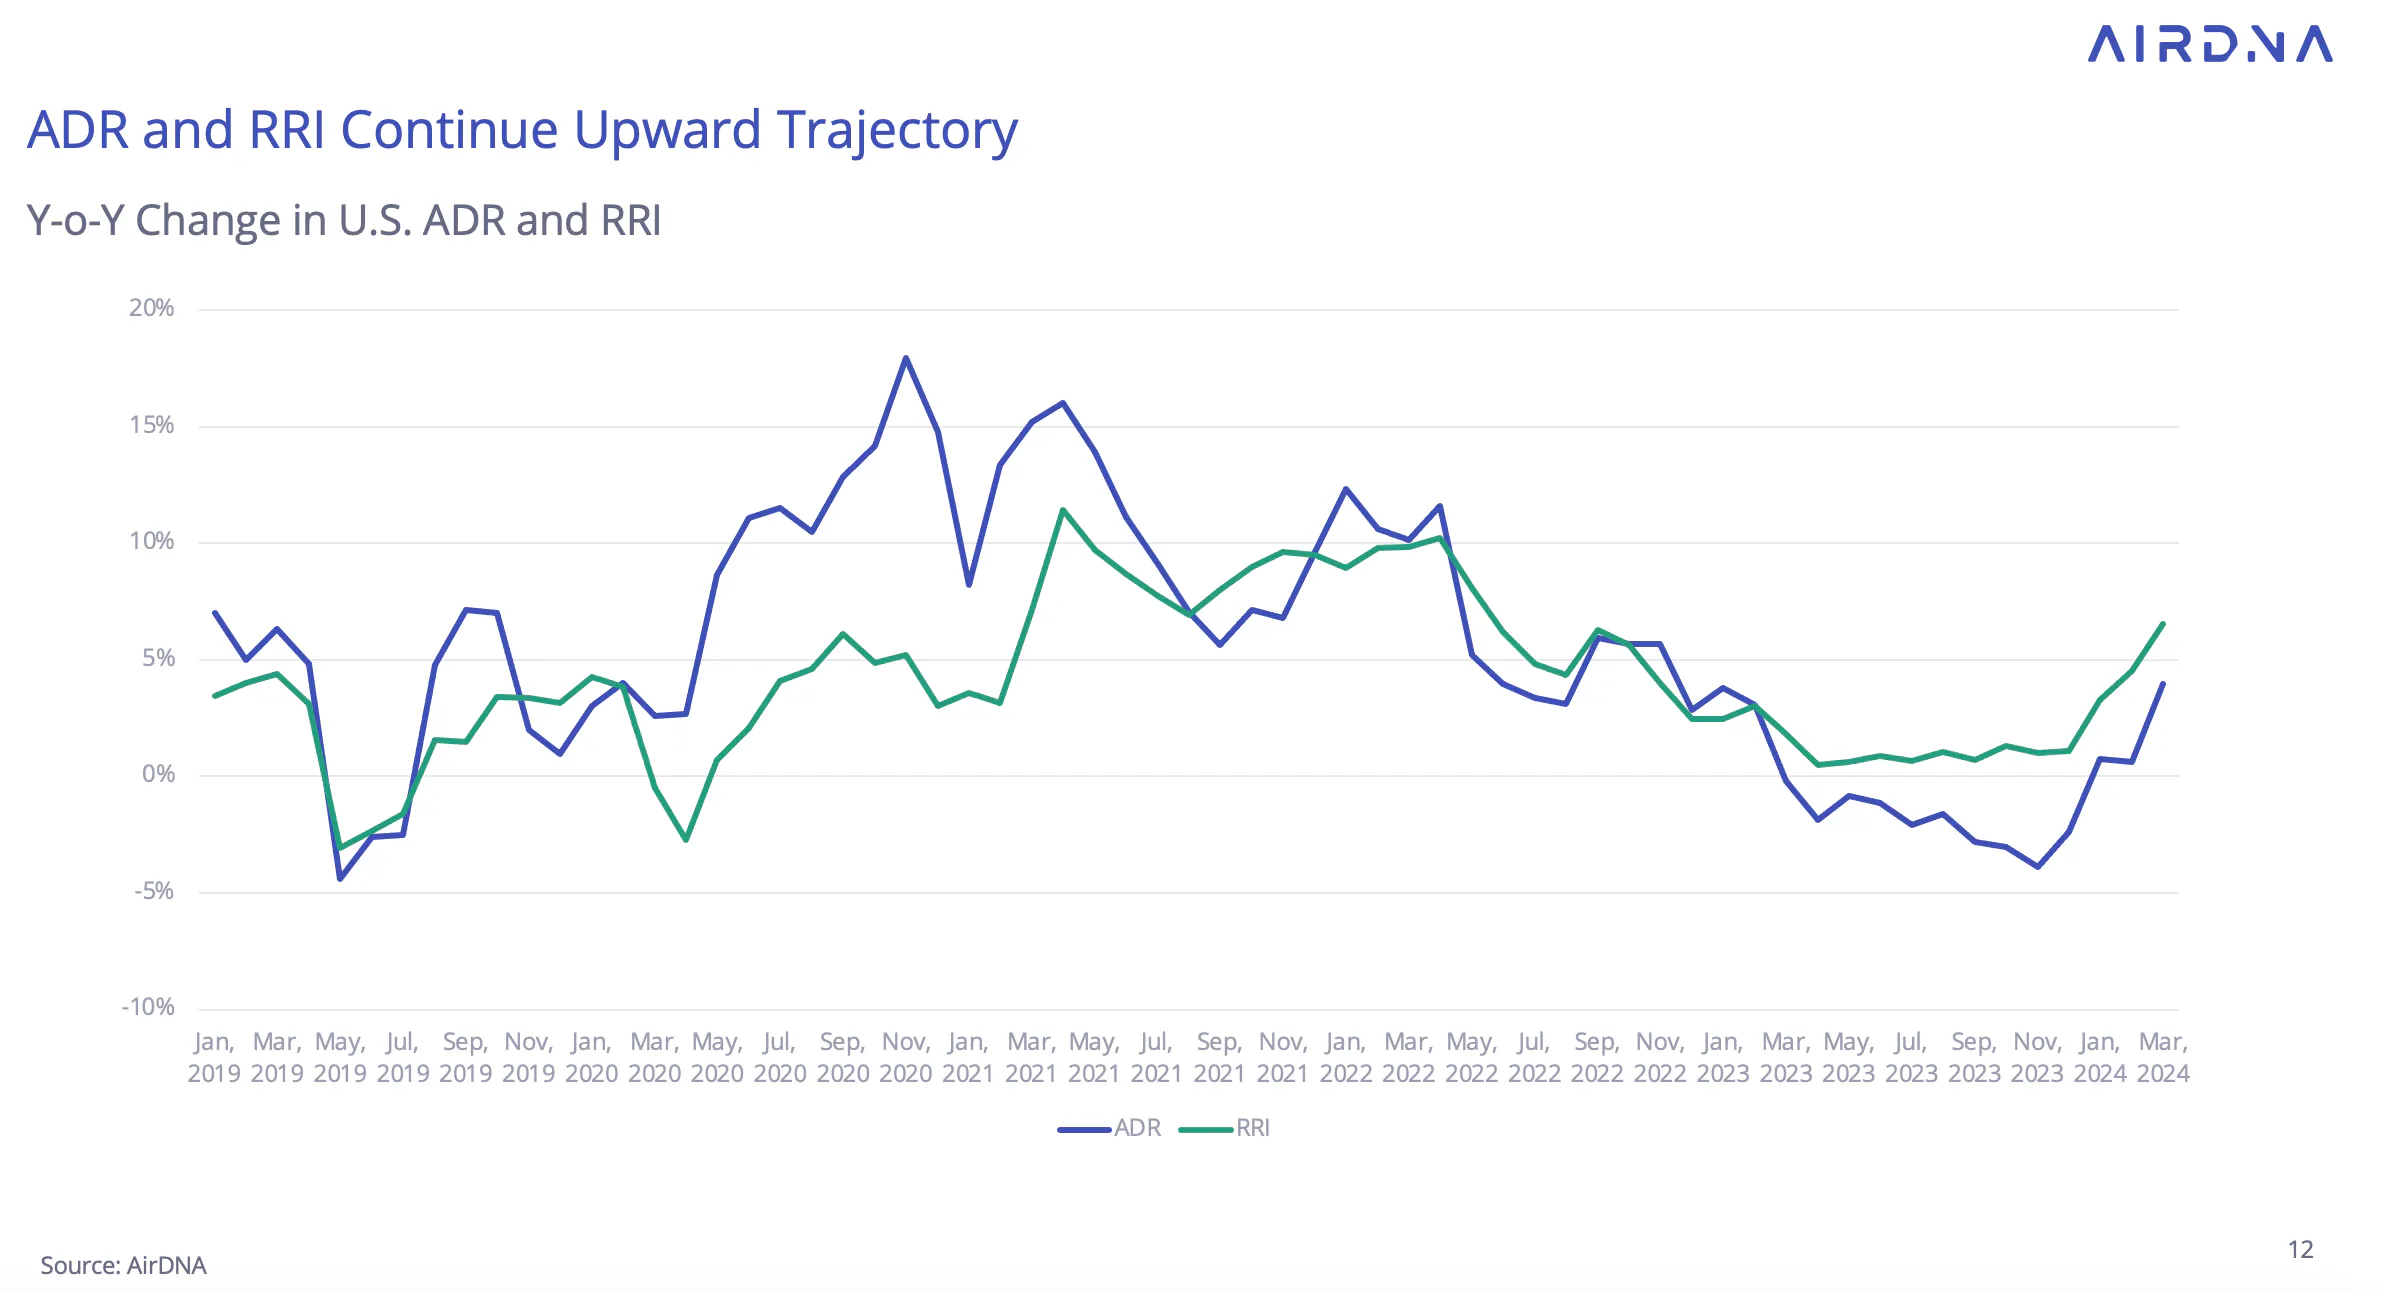
- ADRs increased 4.0% YOY to $326.02
- RRI increased by 6.5% YOY
- Nights booked increased by 12.5% YOY

Available Listings Bounce Back in March
Though listings typically reach a low point in February, listings started dropping significantly in January 2024, perhaps as operators threw in the towel amid underwhelming winter weather.
Listings bounced back in March, landing about 12.3% higher compared to last March and about 30,000 listings shy of December’s total. This marked the second month in a row of accelerating listing growth but was still well below the prevailing supply growth rates of 2022 and 2023.
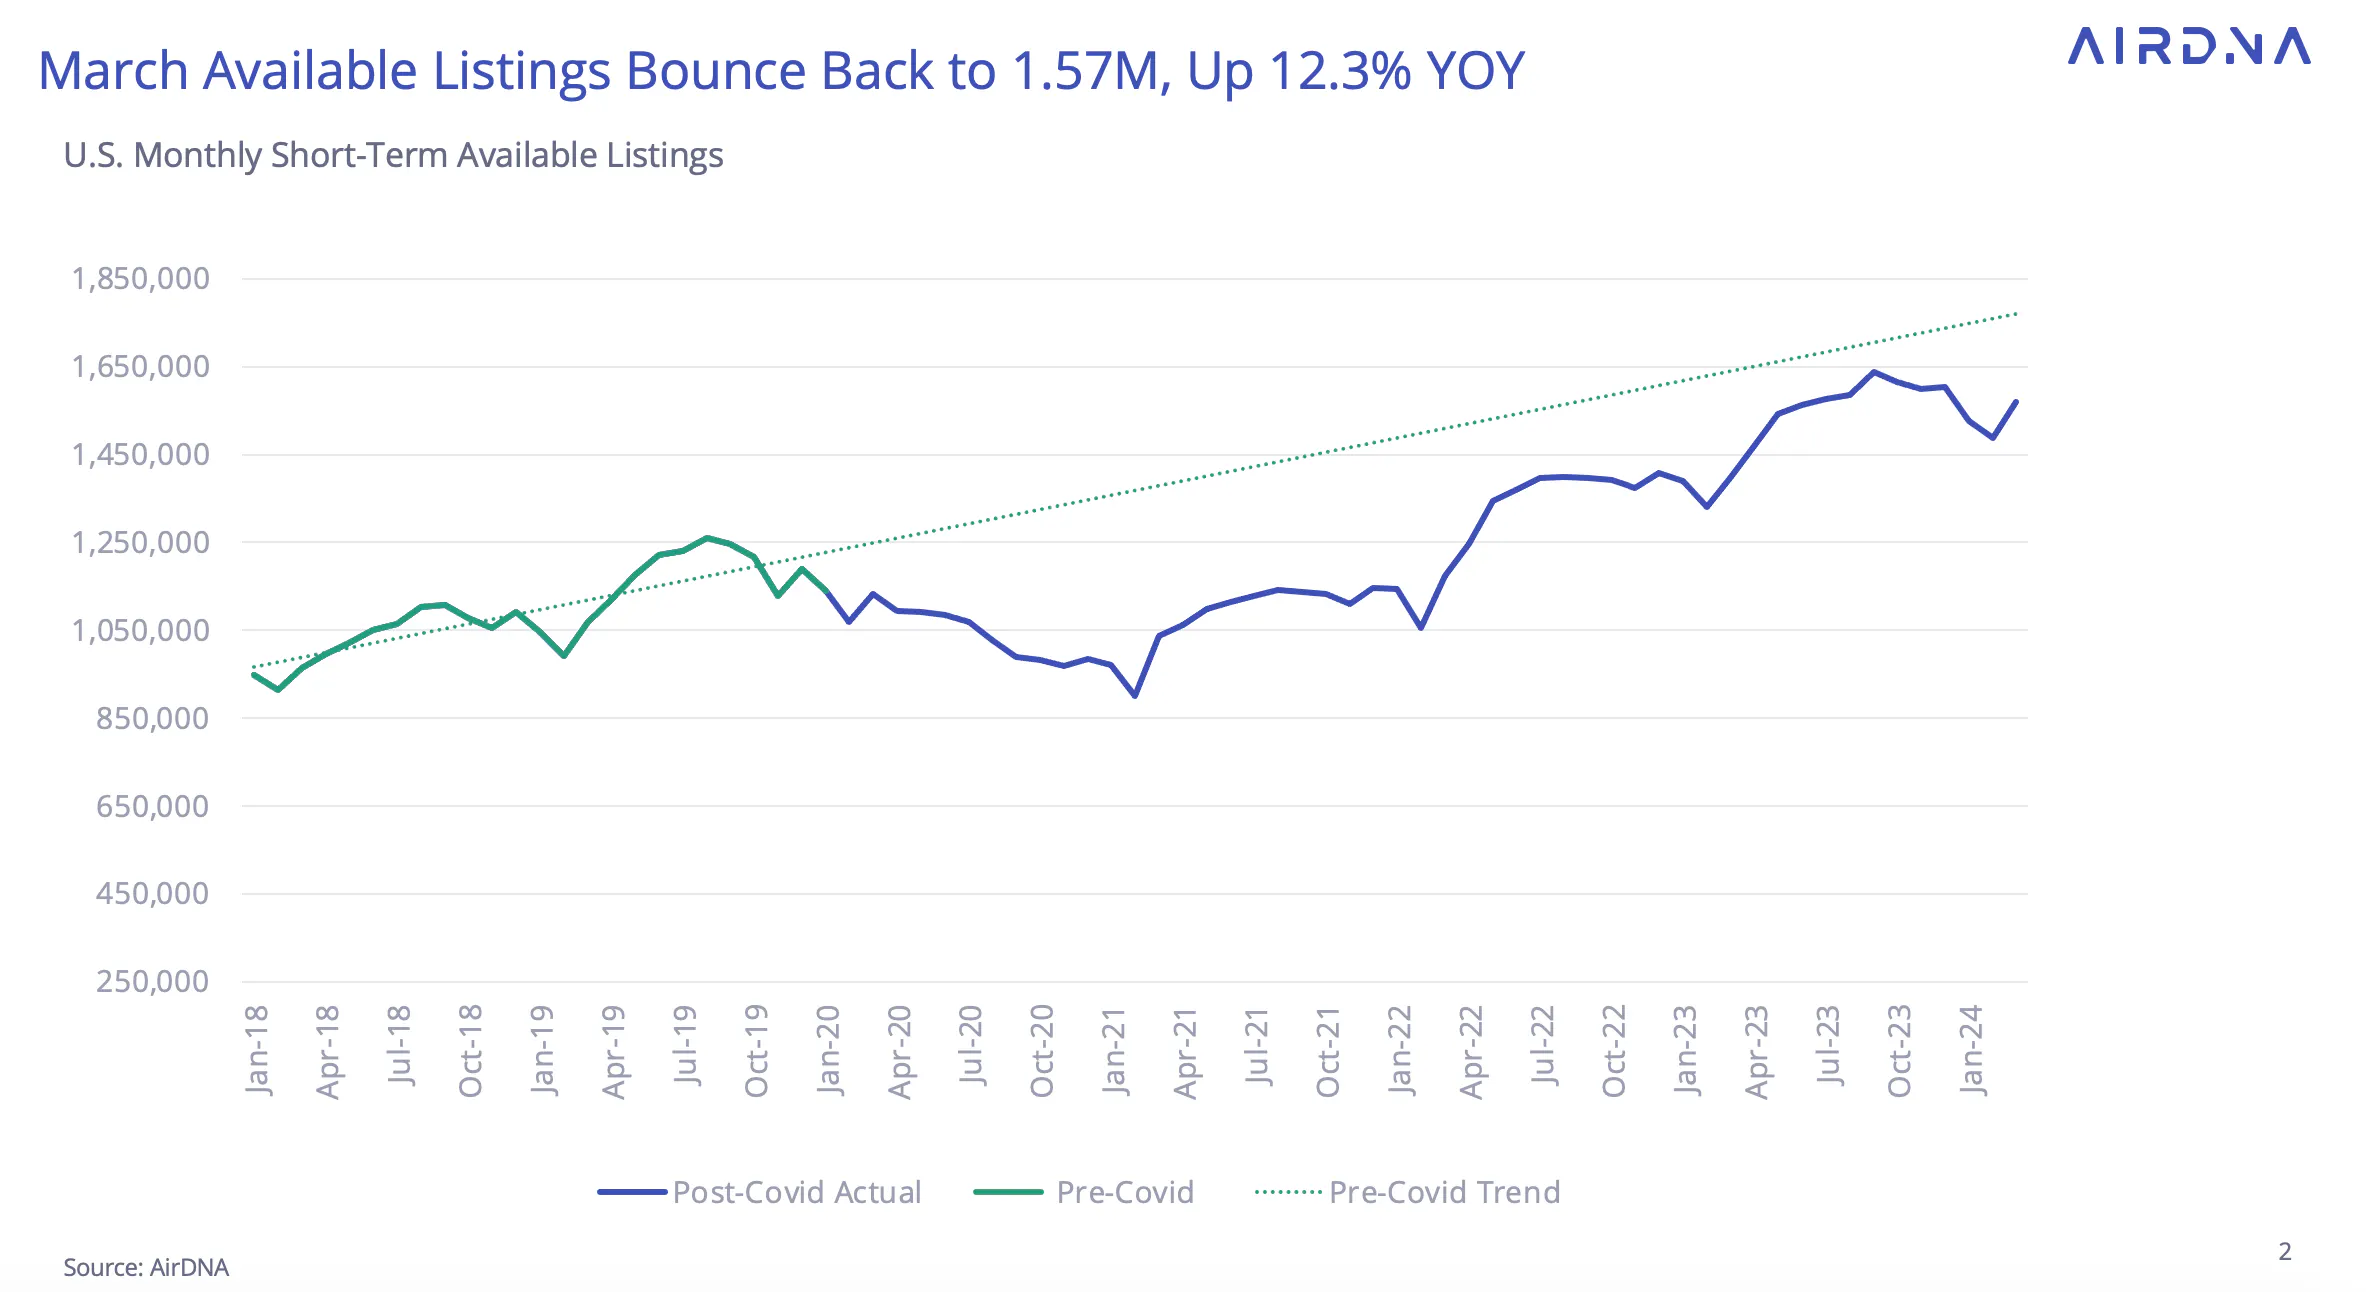
Ballooning mortgage payments following Federal Reserve rate hikes combined with declining unit-level occupancy has noticeably slowed supply growth. The decline is illuminated by monthly changes in new listings, which peaked in May 2022—shortly after rates began increasing in March of the same year—and have generally decreased ever since.
March new listings (45,380) landed slightly ahead of February (44,604). Yet, when considered as a percentage of available listings, March new listings were 2.9% compared to February’s 3.0%, the lowest rate since 2020.
Demand and Booking Activity Remain Strong
Meanwhile, demand growth posted its second notable month this year, with 15.2% more nights in demand YOY, about the same spike as February (15.4%). Booking activity also grew well into the double digits at 12.5%.
Some of the demand can be attributed to the calendar shift, which moved Easter and many Spring Break holidays into March rather than April. This shift means that some of March’s strength may be borrowed from April.
In fact, the first three weeks of the month had demand growth of, on average, 9.2% while the final week grew at 22.9%. However, booking—a leading indicator for demand later in the year—remained strong as well.
Occupancy Highs Due to Easter
The combination of slowing supply and surging demand increased March occupancy. After overcoming January’s weak occupancy, 2024 has so far enjoyed higher occupancies YOY, with February 0.9% higher and March 2.0% higher. These two months of positive YOY occupancy growth come after a 23-month streak of falling YOY occupancies following the remarkable highs of 2021.
On the other hand, the positive occupancy result in March may be owed entirely to the Easter shift, since when examining the individual weeks in March, the first three weeks’ occupancy is, on average, down about 2.2%. The final week of March had an occupancy of 62.9%, up from March 2023, when the last week had an occupancy of 57.9%.

Better Occupancy Leads to Higher ADR and RRI
Arguably, the most dramatic trend from the past few months is the renewed pricing power that arose from the reversal of occupancy declines.
In response, ADR growth has flipped from a YOY decline of 3.9% in November to a gain of 4.0% in March. The RRI never reached negative growth in 2023, implying that while ADR declined on average, this was due to a mix shift; new properties were lower-priced than existing.
Still, weak growth between 0-1% characterized much of the RRI performance of the past year. March’s 6.5% YOY was RRI’s strongest month since early 2022.
Hosts Across the Country Benefit from Demand Growth
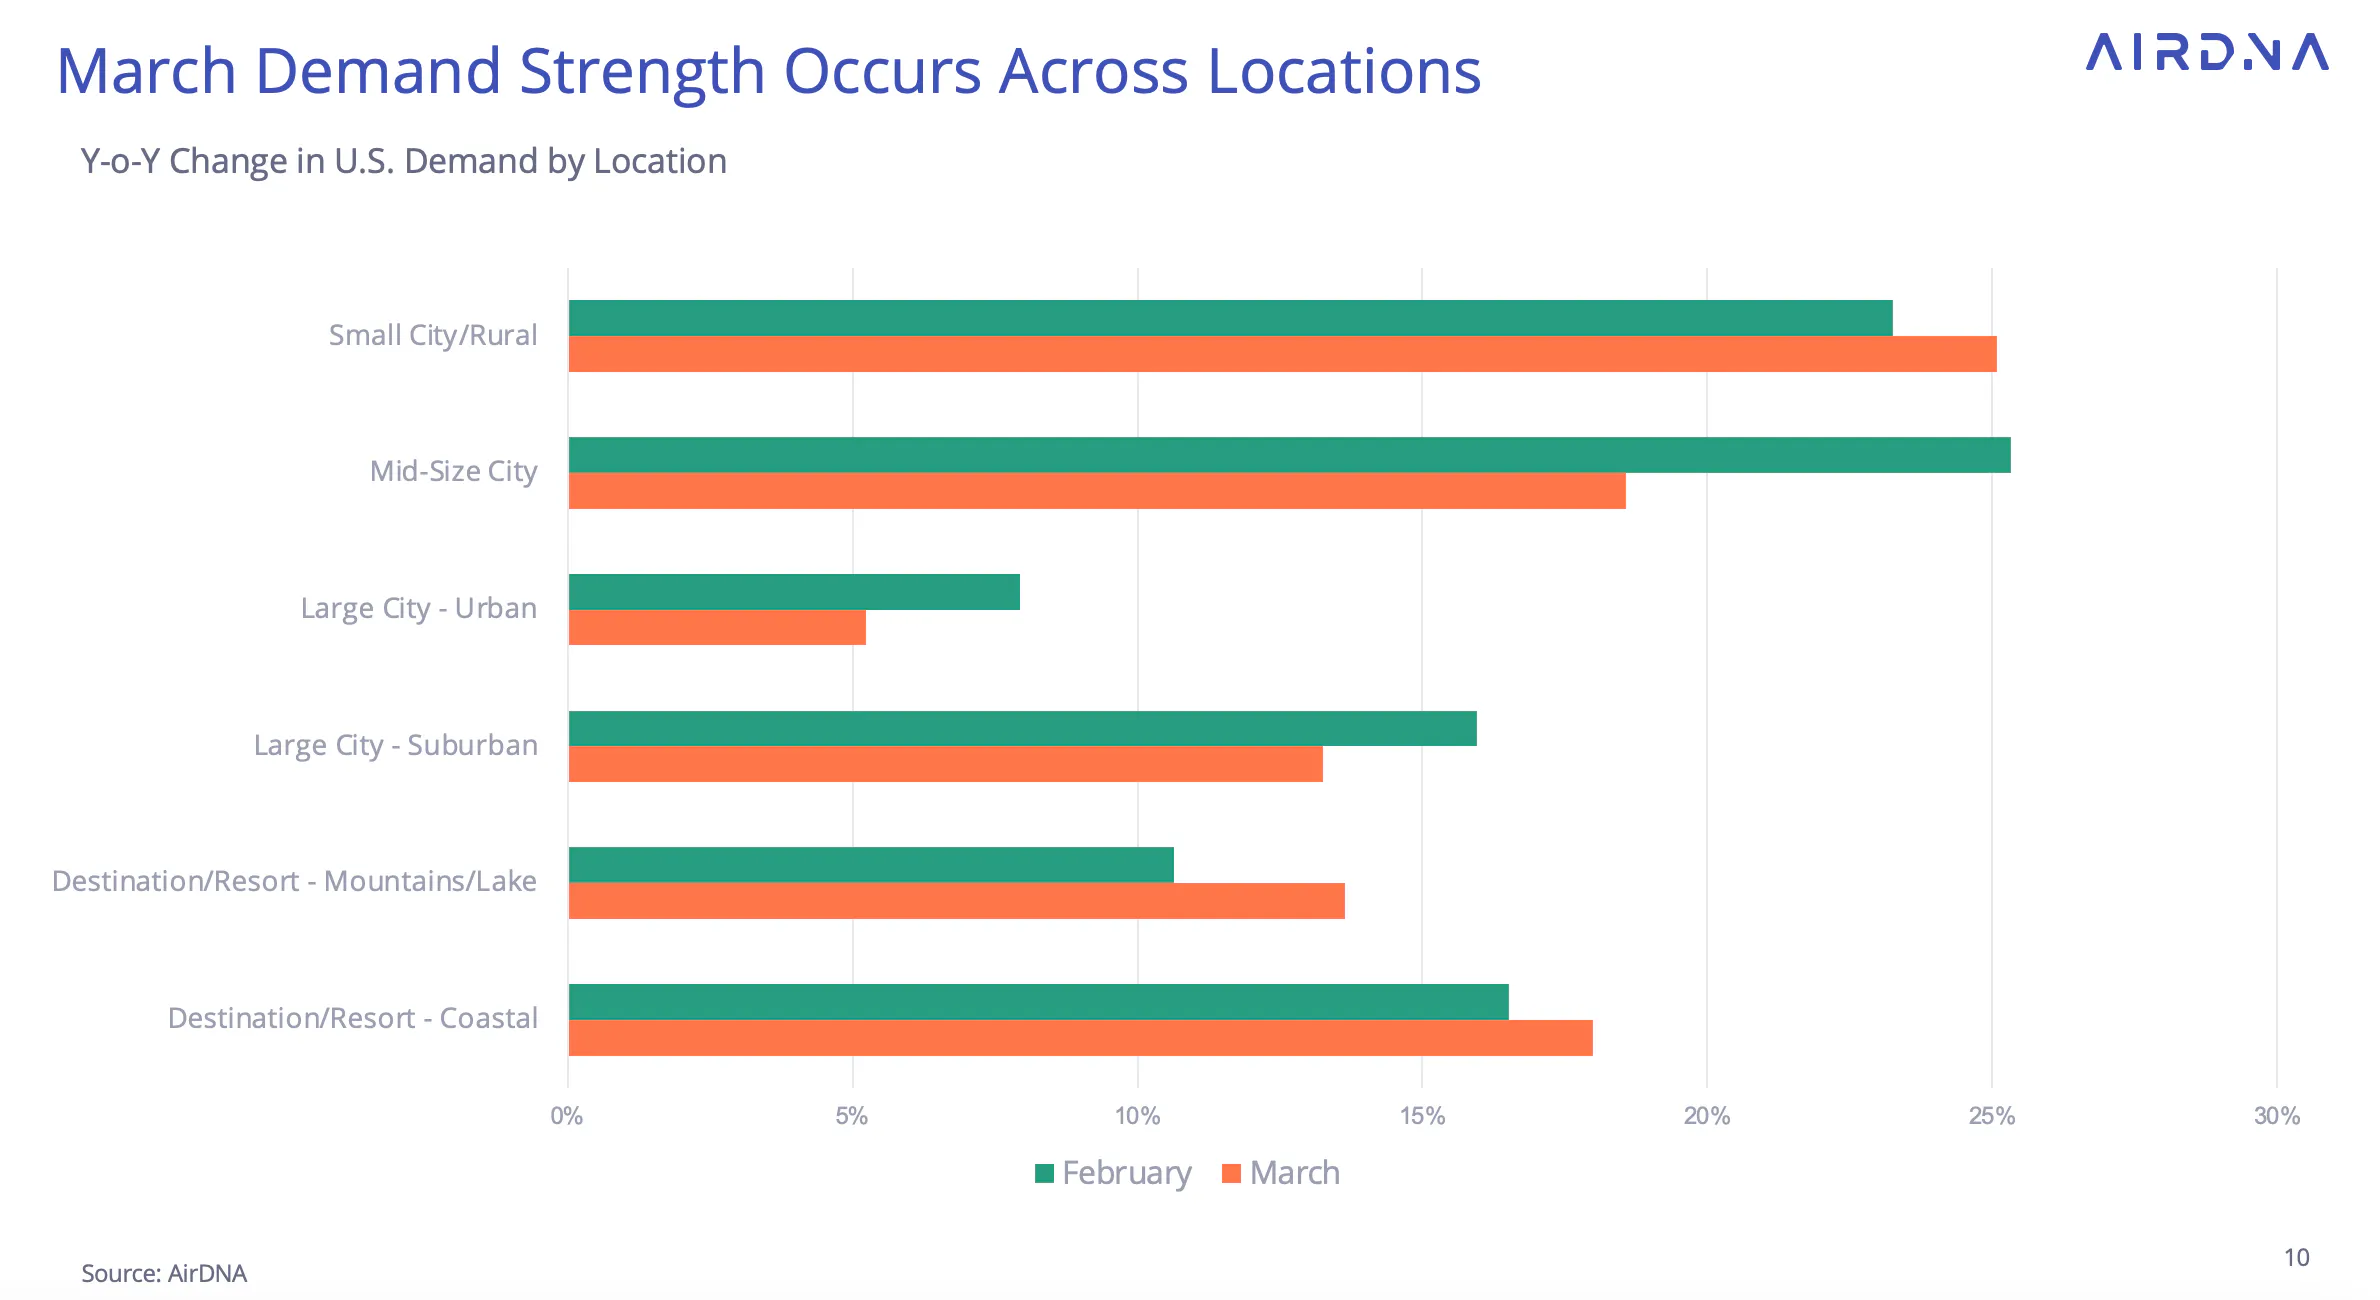
Turning to locations, the demand growth swept across location types—demand grew in excess of 5% for every location type. Demand for Small City/Rural locations grew 25.1% YOY, taking the top spot from Mid-Size Cities (+18.6%).
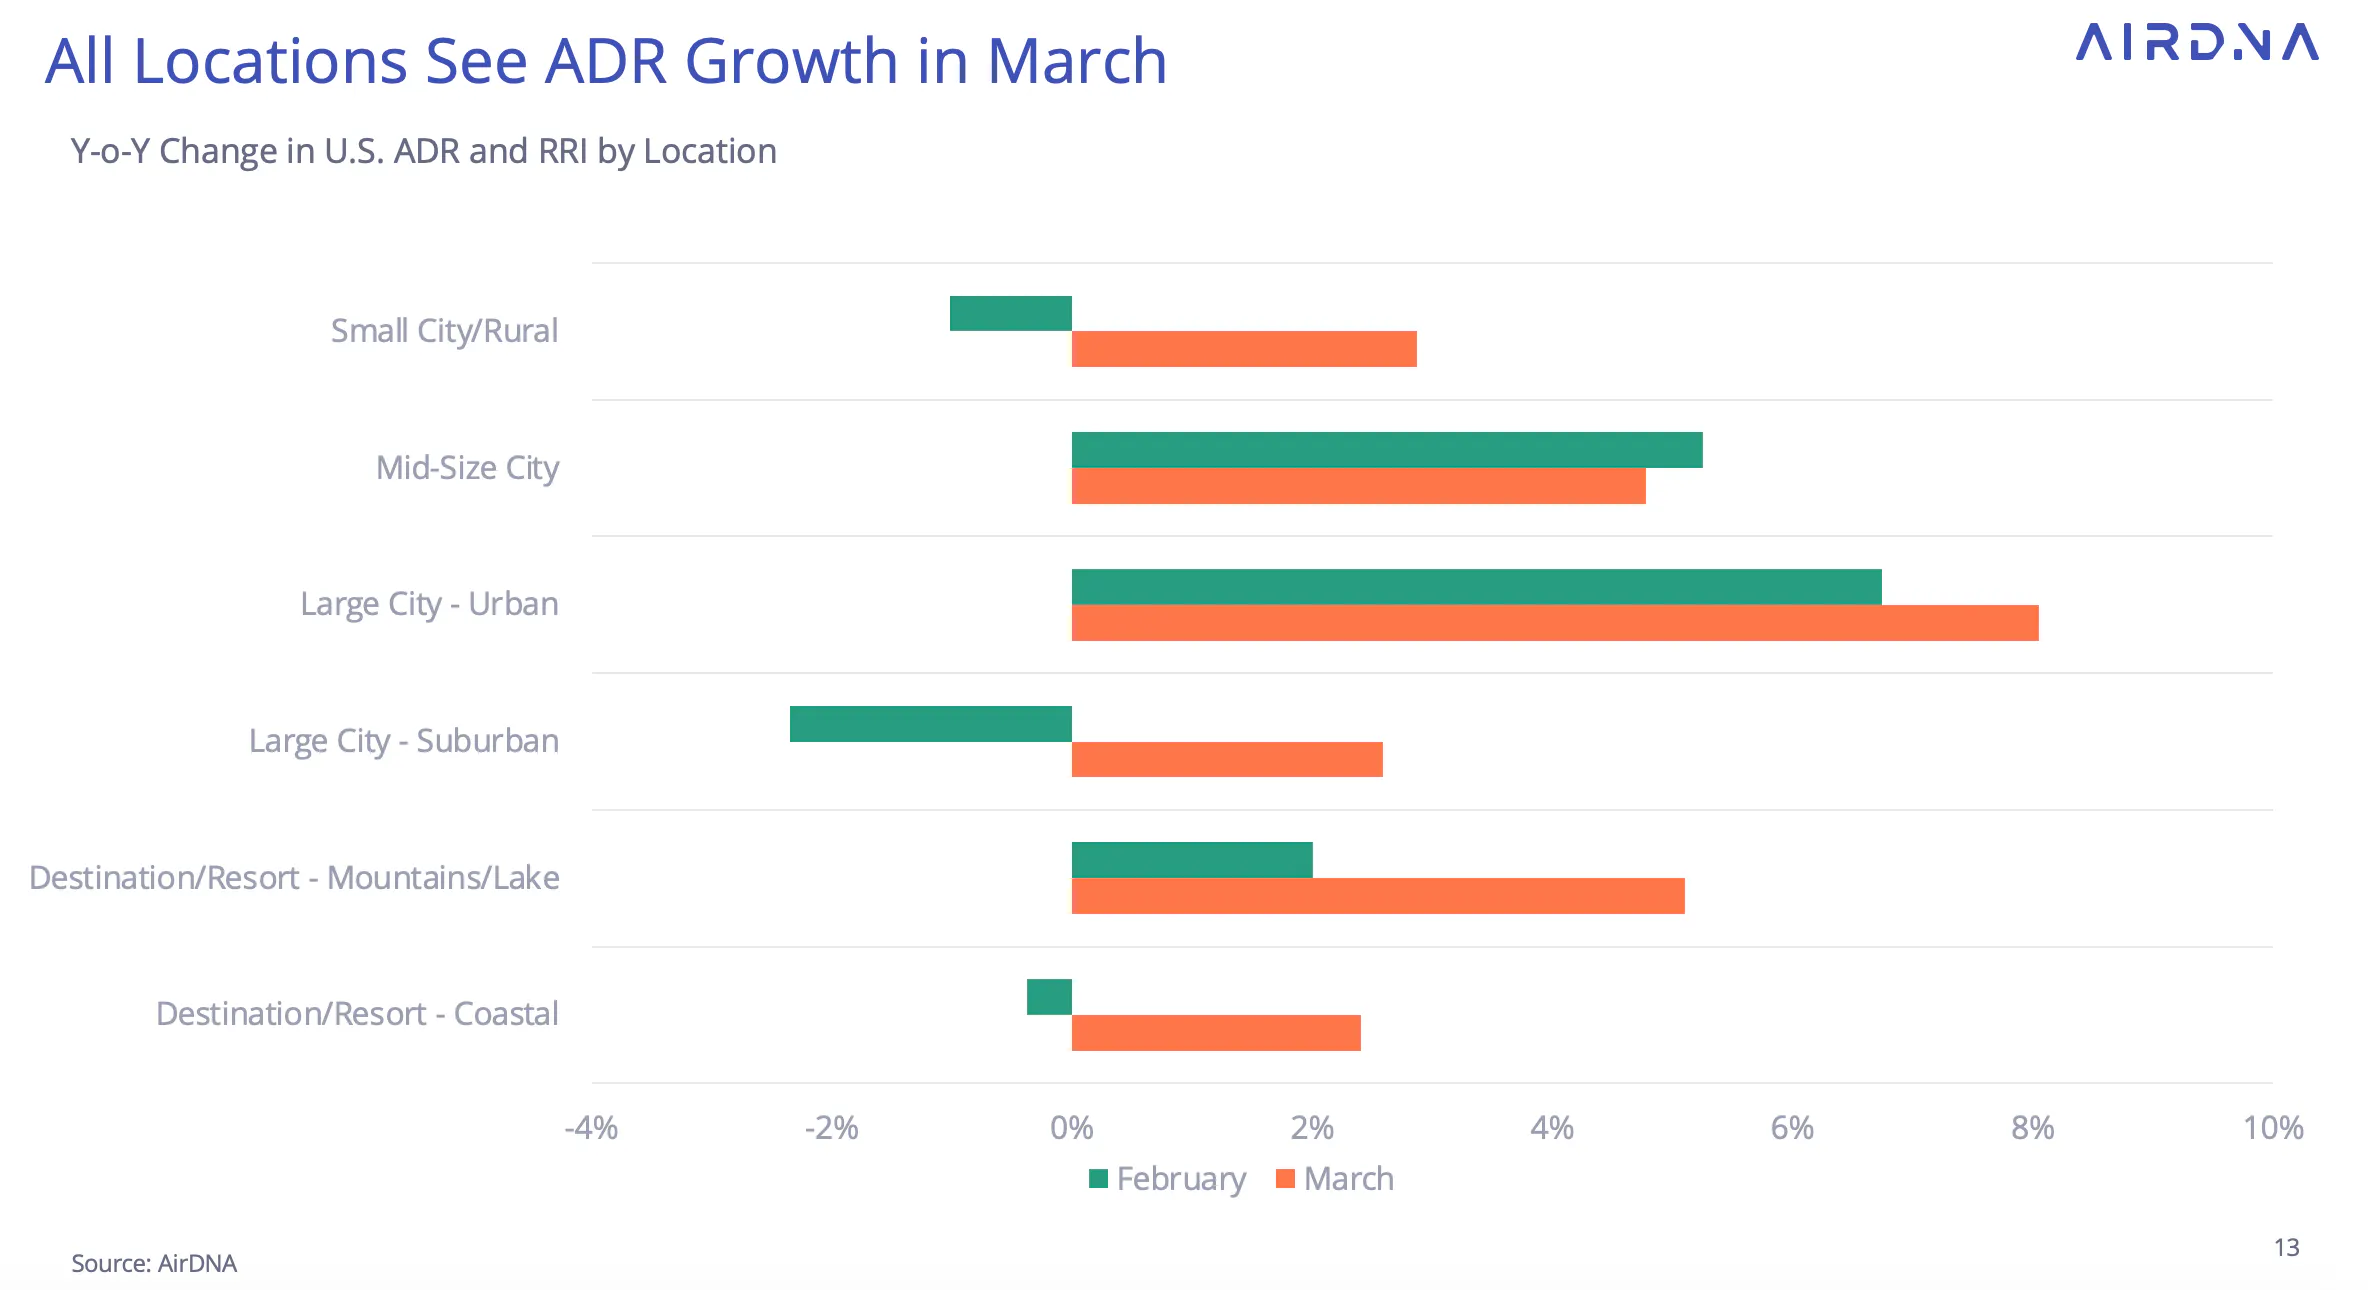
The strong demand was not lost on operators as they made pricing decisions, and ADR grew in every location type on a YOY basis. This includes Suburban locations, which saw ADR growth of 2.6% YOY in March, up from a decline of 2.3% in February.
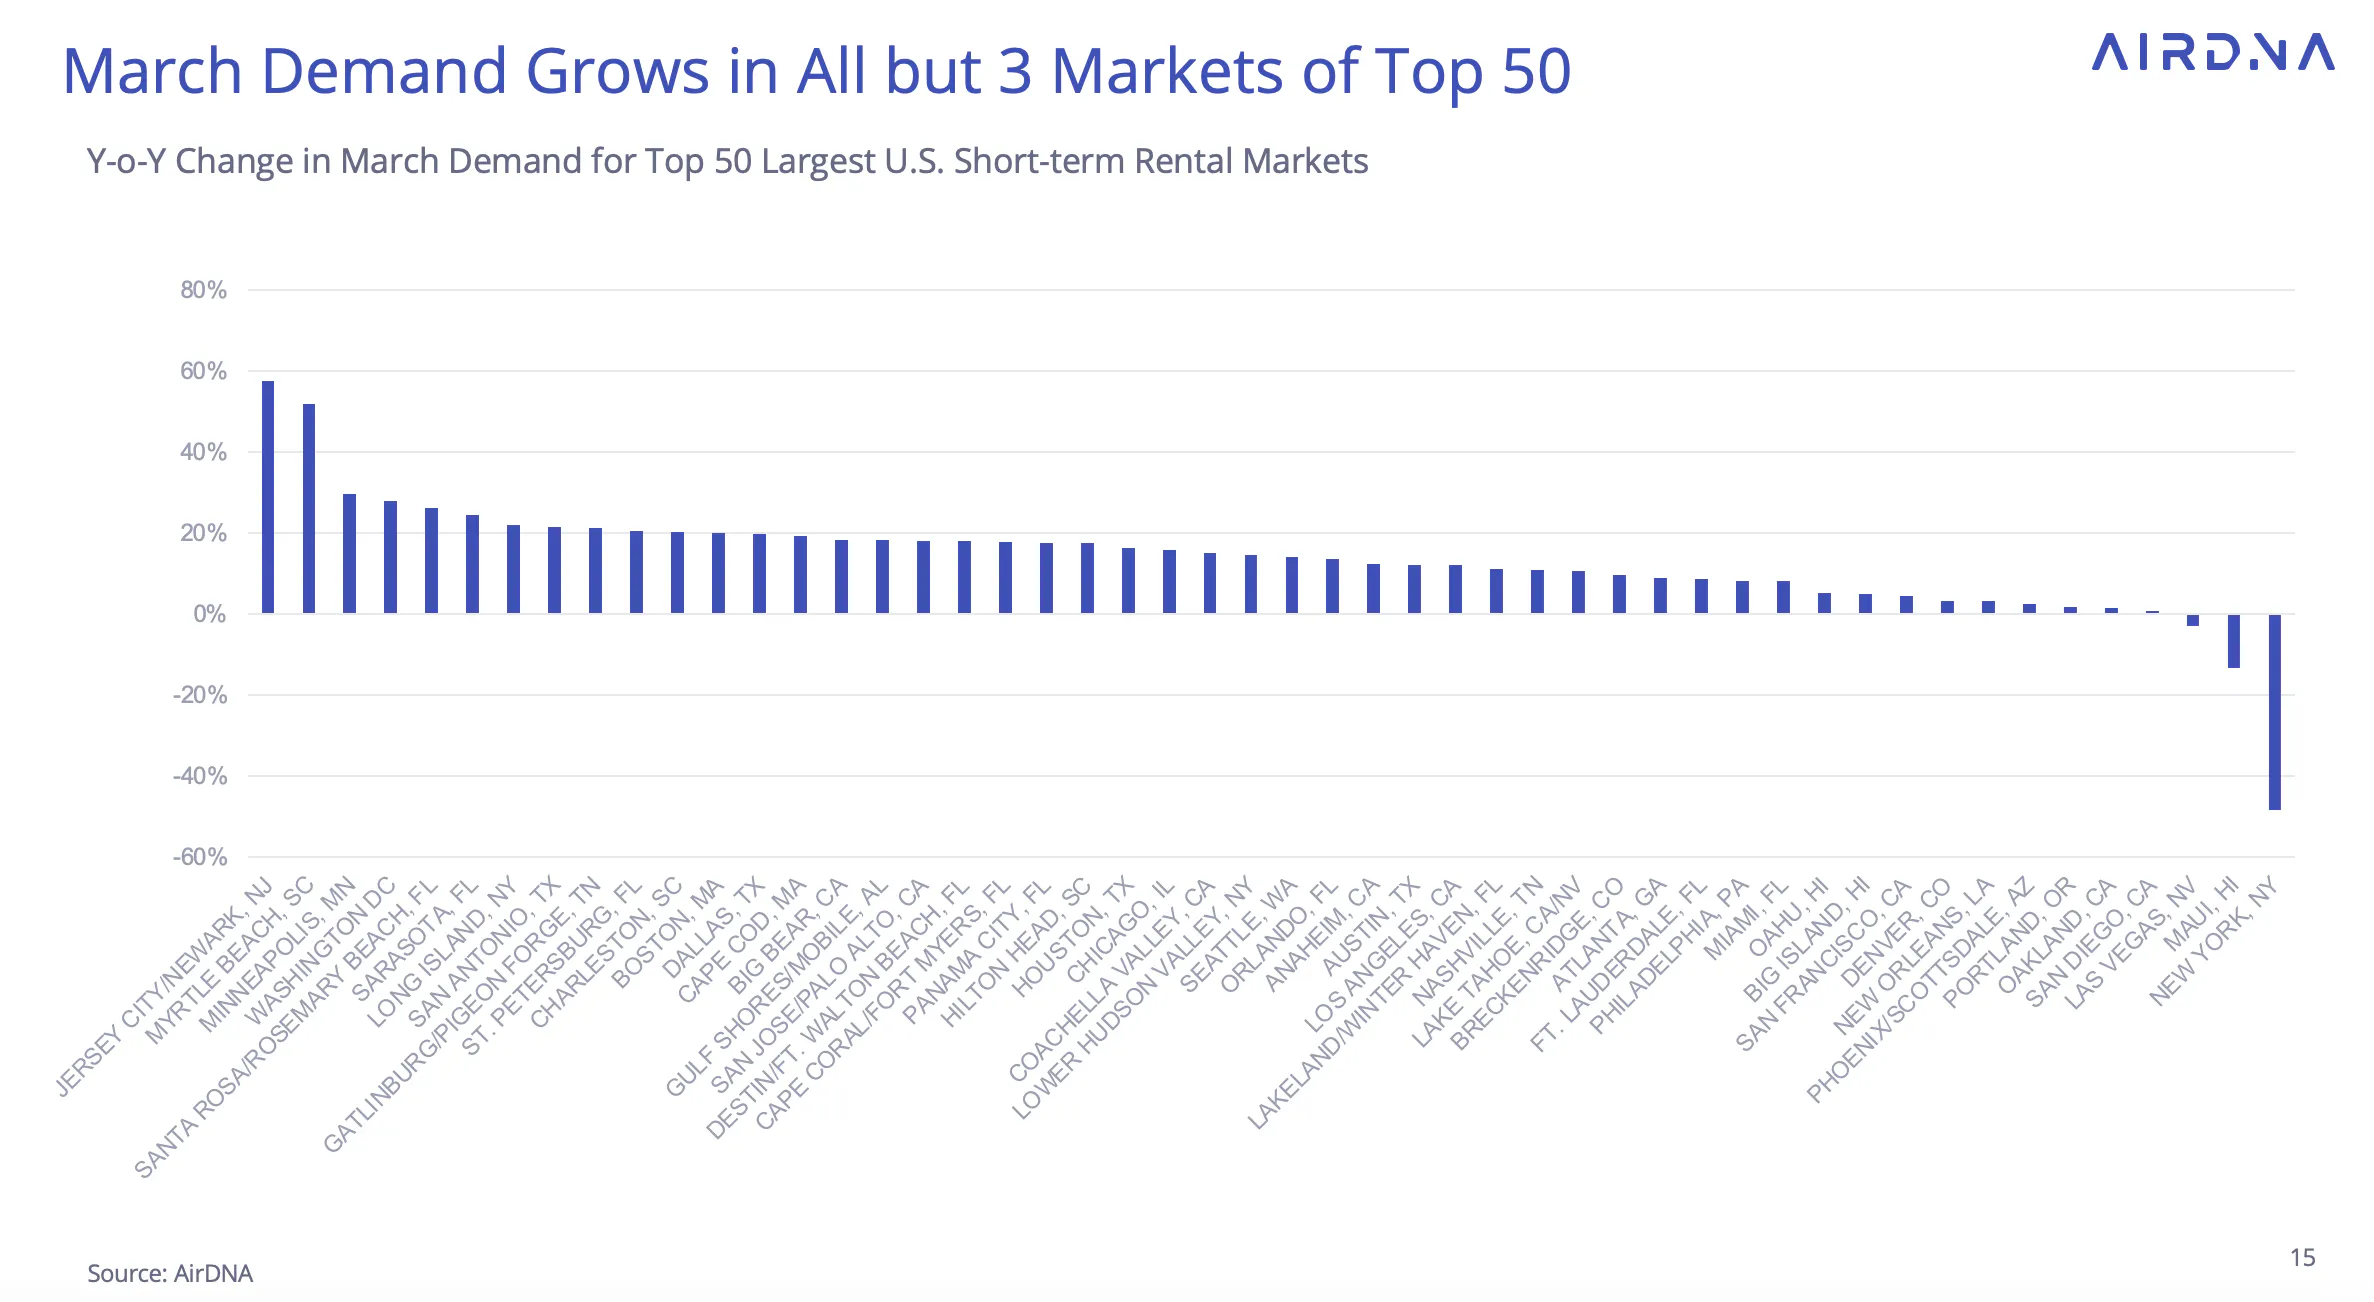
The top markets also shared demand boosts, with 47 of the top 50 markets seeing growing demand. Jersey City/Newark topped the list, thanks to recent regulatory enforcement in New York, with other notable increases in coastal destinations:
- Myrtle Beach (+51.9%)
- Santa Rosa/Rosemary Beach (+26.2%)
- Sarasota (+24.5)
Maui continues to face depressed demand (-13.2%) as it rebuilds following devastating wildfires last year.
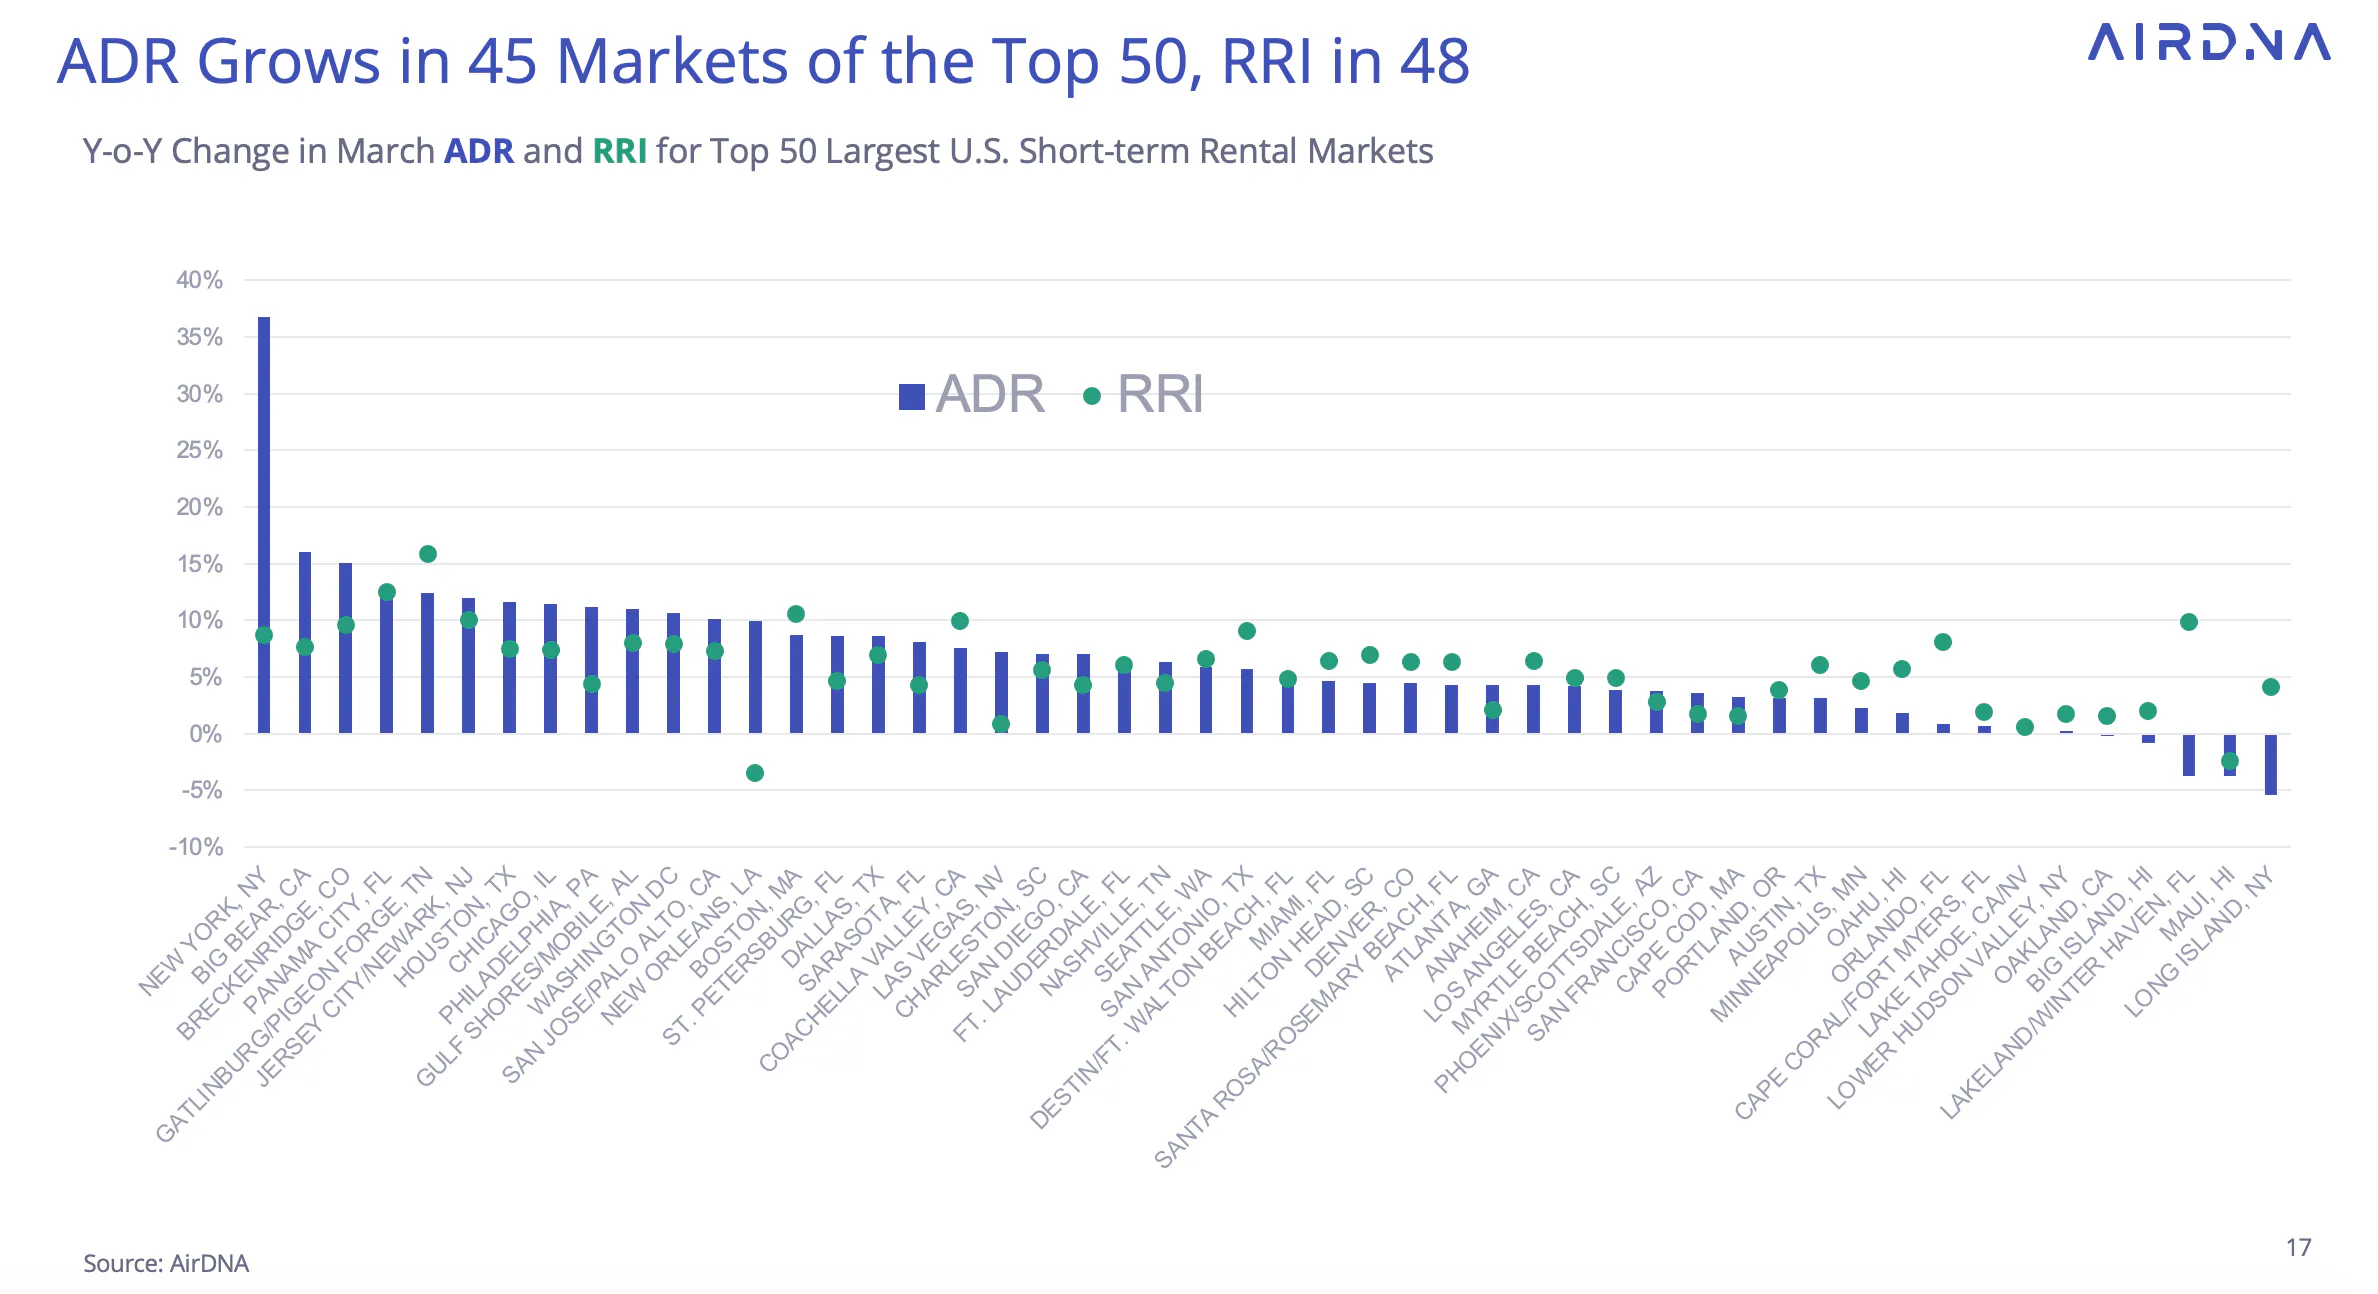
ADR growth was mostly positive for the top markets as well, with 45 of the top 50 seeing YOY growth—10 more than in February.
While New York had by far the highest ADR growth (36.8%), RRI growth in this market was only 8.7%, suggesting that mix shift is behind most of the ADR increase.
Conversely, while Long Island had the lowest ADR growth at -5.4%, RRI growth was 4.1%, suggesting that existing operators have been able to raise rates after all.

Low Demand Pacing Until Memorial Day Spike
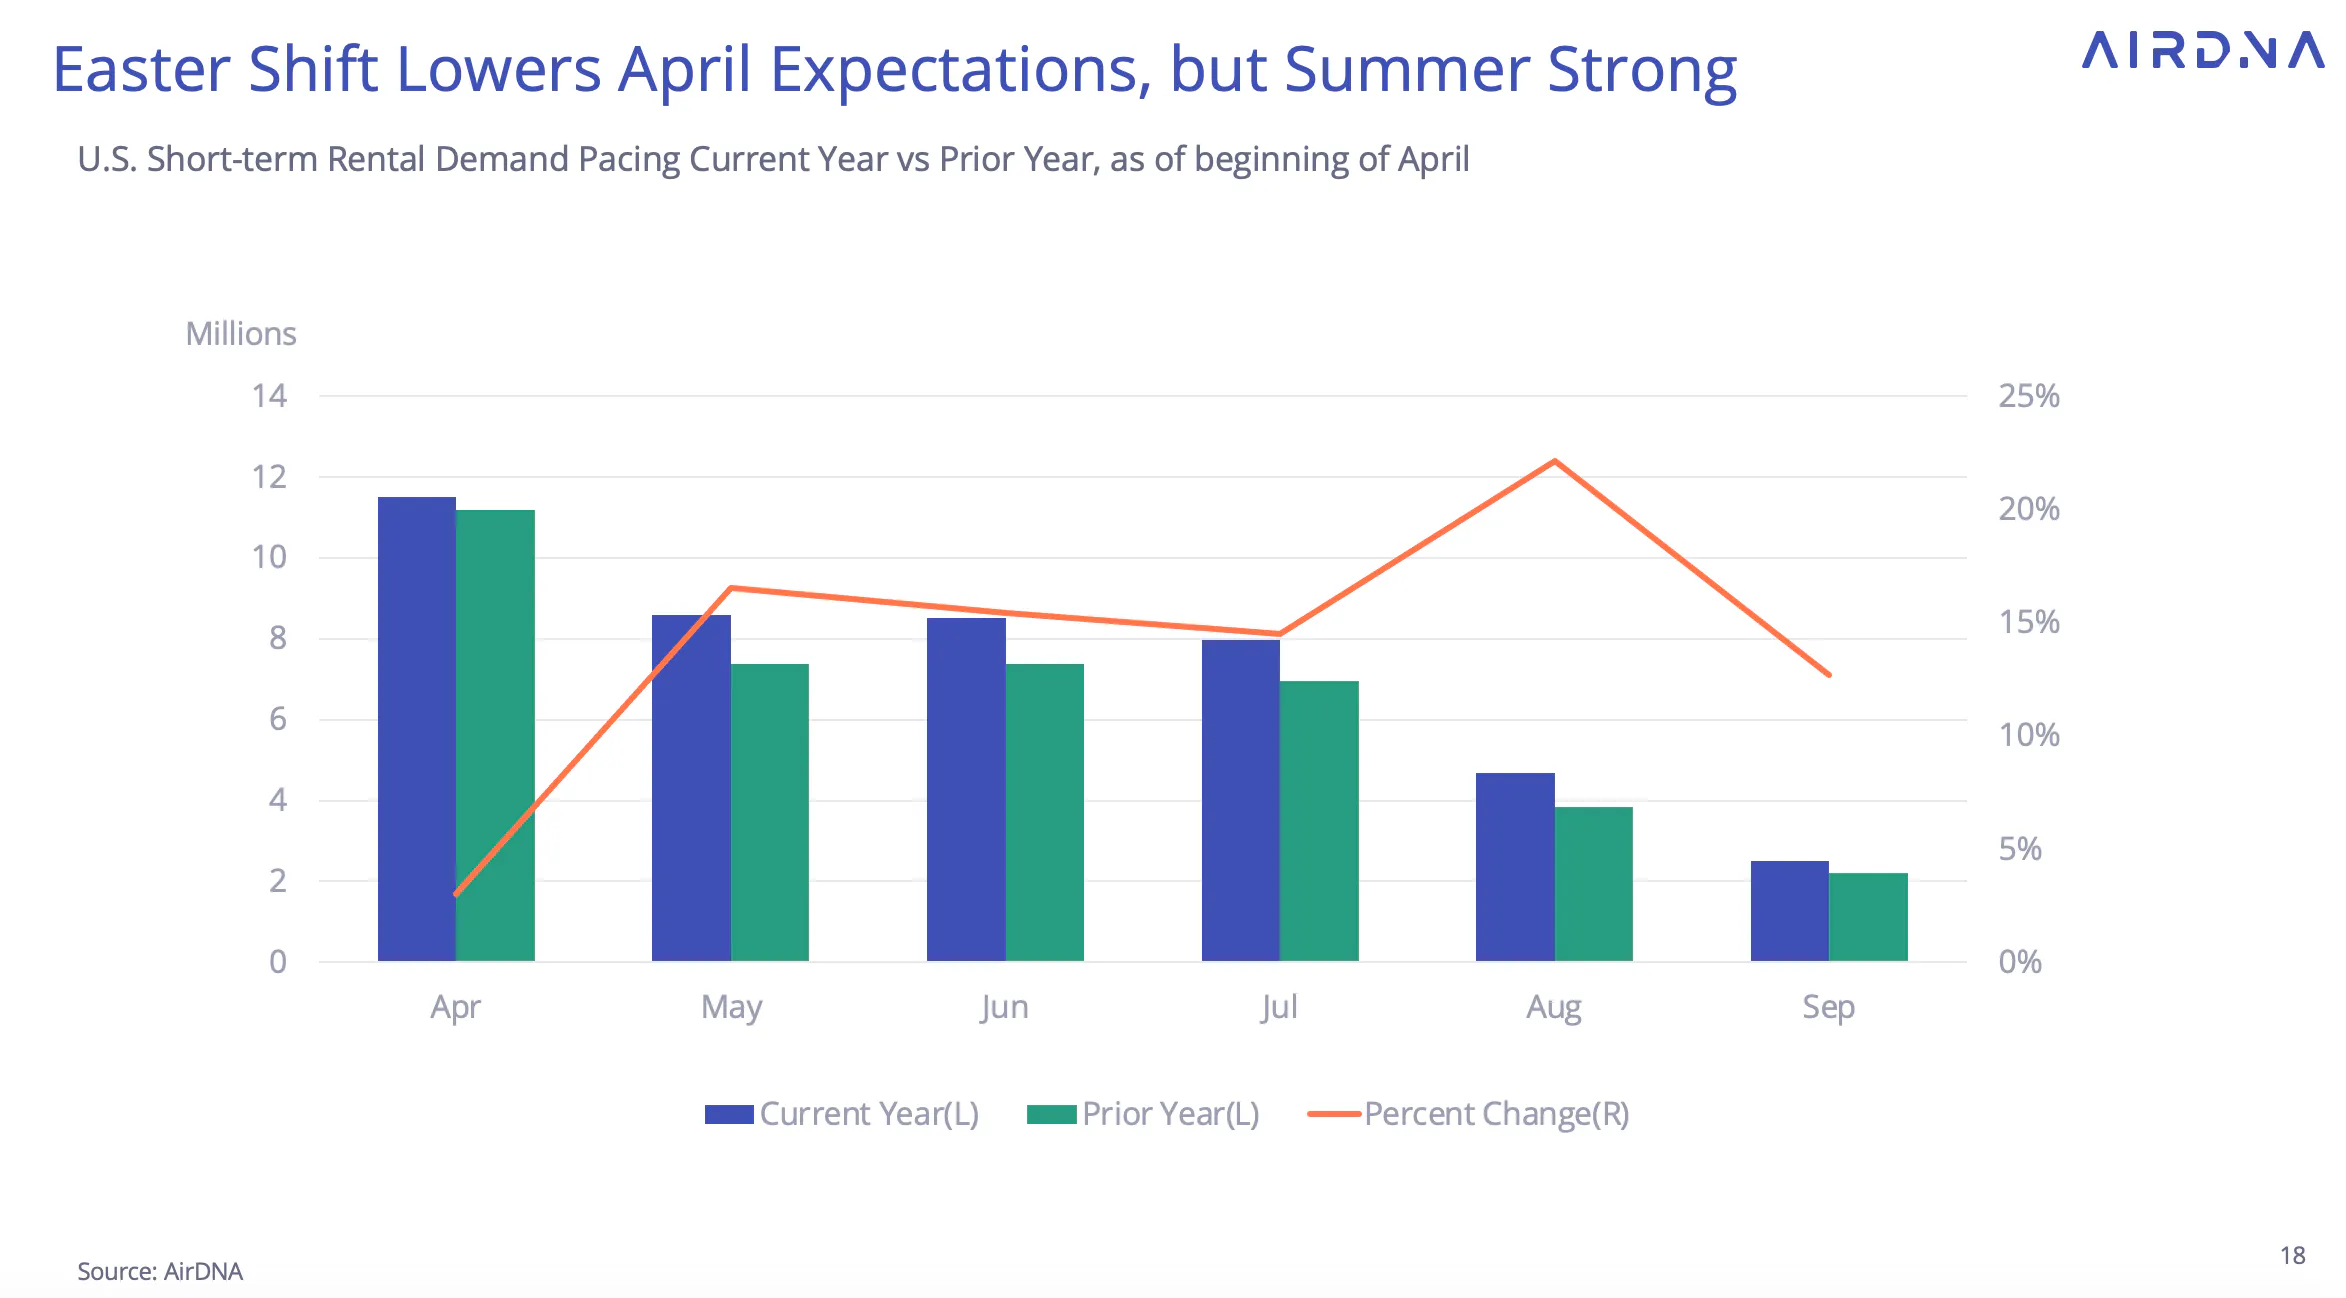
Turning to demand pacing, the relatively low pacing of 3.0% for April affirms the impact of the early Easter calendar shift. Afterward, pacing hovers around 15% growth until August, which is currently pacing 22.1% ahead of this time last year. September pacing then drops to 12.7%.
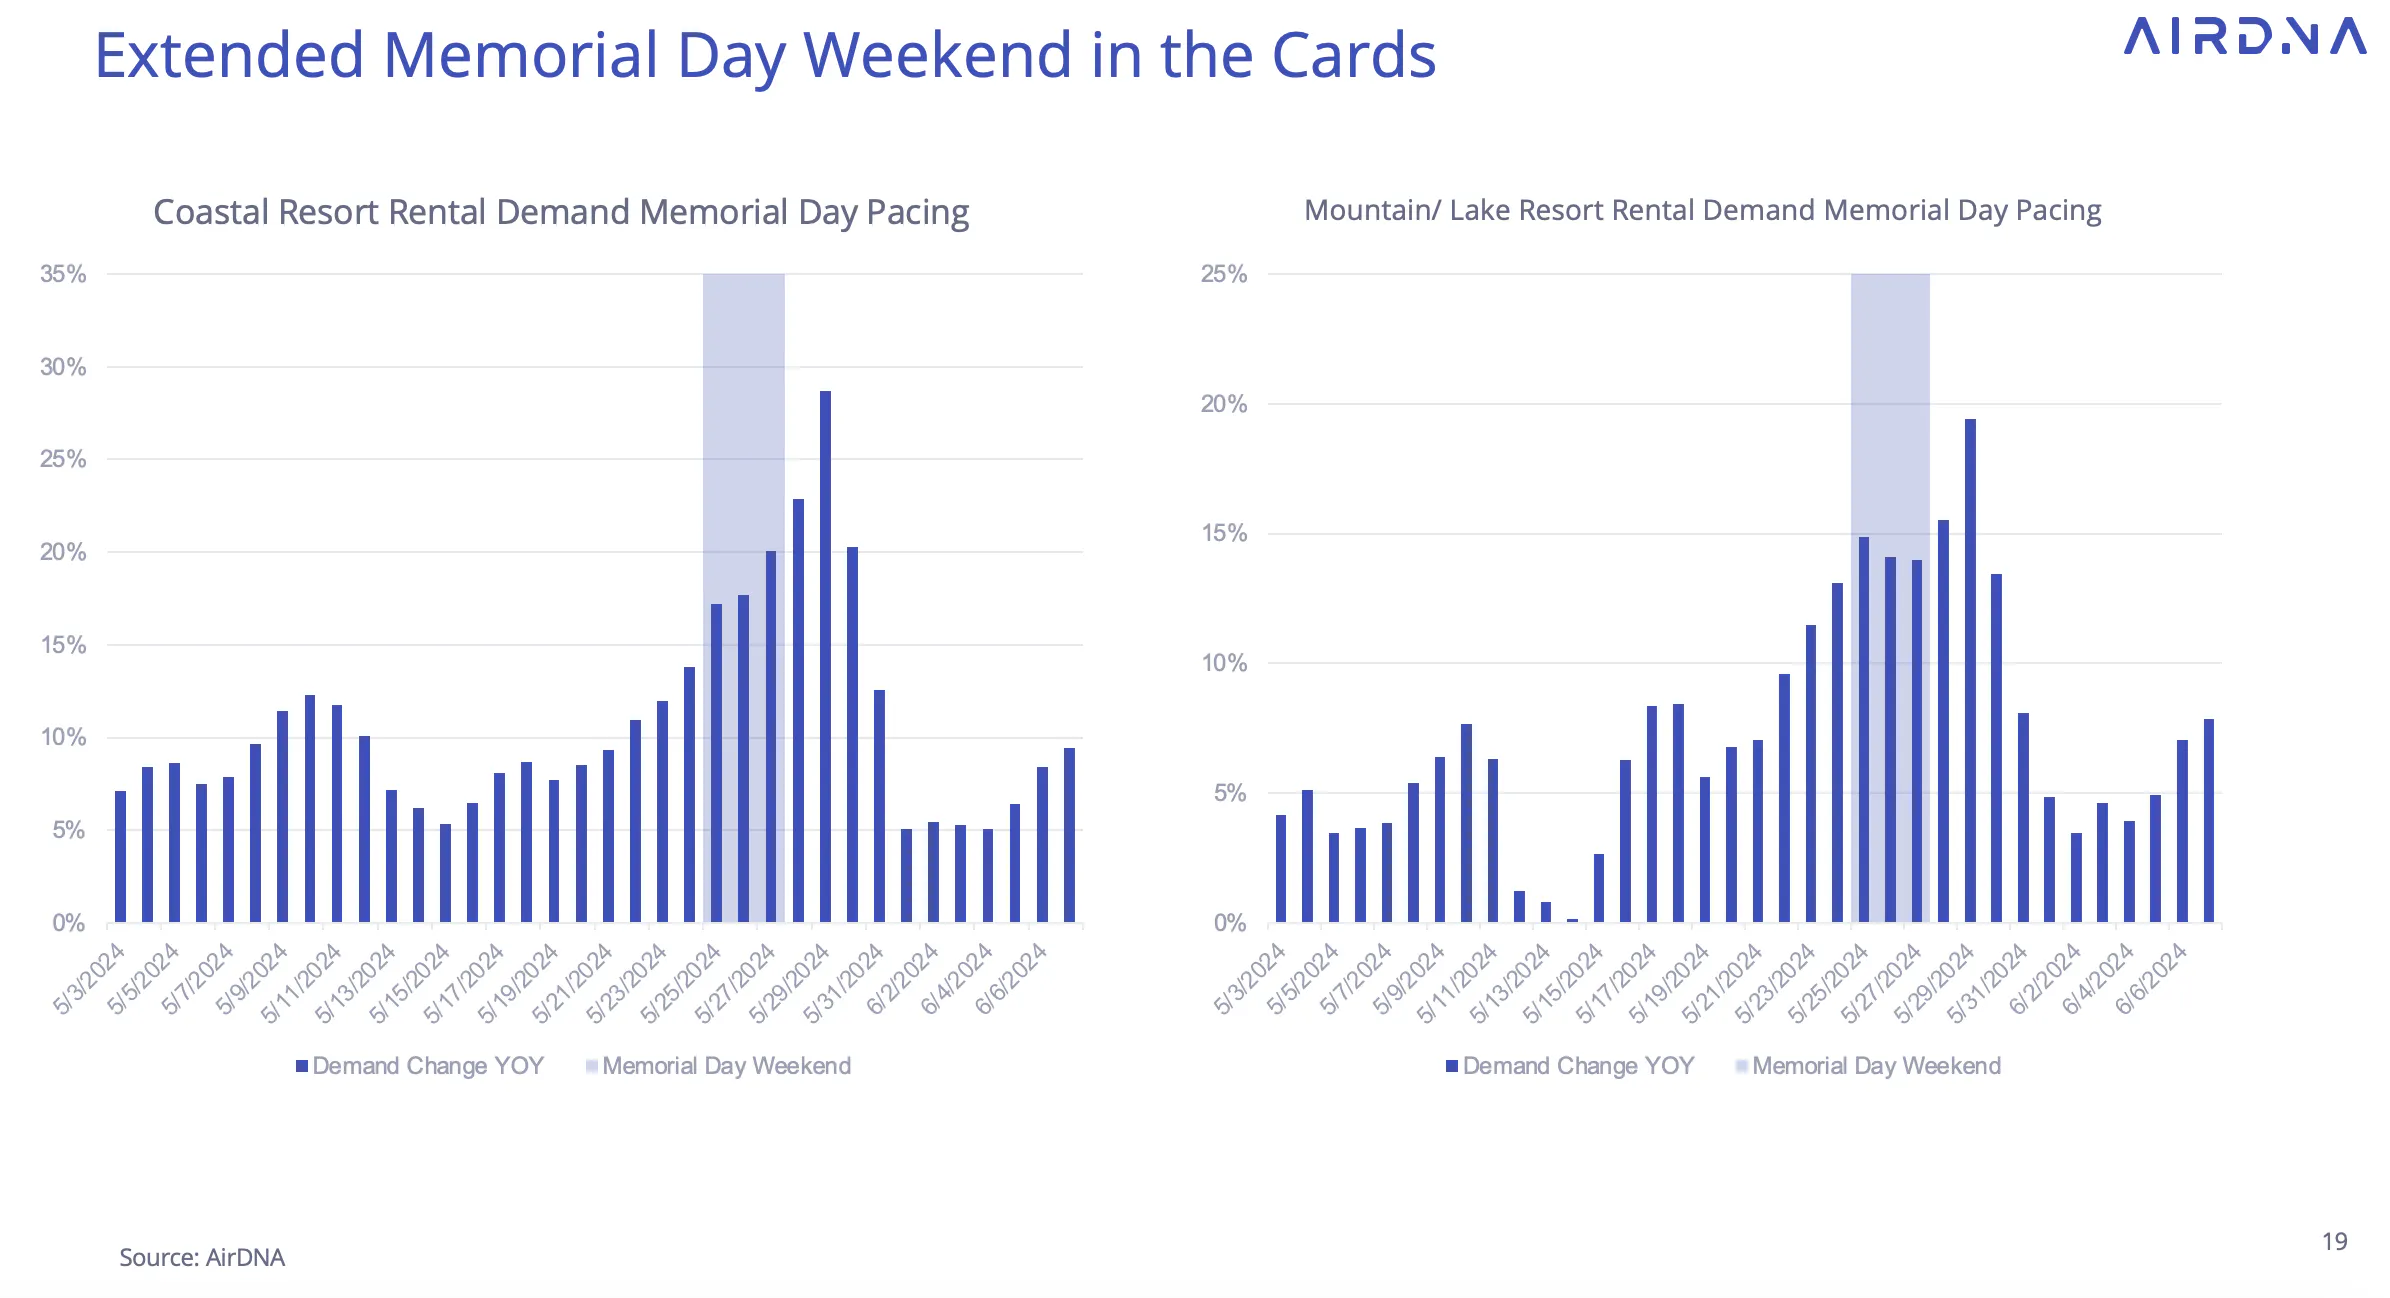
For the more immediate future, Memorial Day pacing suggests that many are expecting to take an extended weekend vacation.
Memorial Day falls on Monday, May 27, and demand pacing for that Monday is up 20.0% for Coastal Resorts and 14.0% for Mountain/Lake Resorts compared to the 2023 holiday.
The Wednesday after, however, is pacing 28.7% higher in Coastal Resort locations and 19.4% higher for Mountain/Lake Resorts.
ARTICLE SUMMARY
March saw positive short-term-rental KPIs thanks to an early Easter and growing occupancy that's bringing ADR and RRI averages up with it.
Bram Gallagher
AirDNA Director of Economics and Forecasting
Bram Gallagher is an Economist at AirDNA, specializing in uncovering insights that drive smarter short-term rental decisions. He put his Ph.D. in Economics from the University of Georgia to work researching and forecasting hotel data with CBRE prior to joining AirDNA, as well as teaching economics at a number of universities. In his spare time, Bram enjoys making wooden furniture with hand tools.