What Is RevPAR and Why Does It Matter for Pricing?
Published: May 8, 2024
Last updated: October 30, 2026

Dillon DuBois
Key Takeaways
- RevPAR (Revenue Per Available Rental) is a hospitality industry metric that measures how well a property generates revenue.
- Average Daily Rate (ADR) and Occupancy Rates are two metrics that are used to calculate RevPAR.
- A higher RevPAR indicates a successful combination of pricing and occupancy strategies, while a lower RevPAR might suggest areas for improvement.
You need a little charm and hospitality to run a great Airbnb, but you need razor-sharp acumen to really drive business success.
Understanding the interplay of key performance metrics that affect your revenue is essential. One of these metrics is RevPAR, or Revenue Per Available Rental. RevPAR combines your average daily rate (ADR) with your occupancy rate to give you a snapshot of your potential and actual income. A simple example would be:
RevPAR = ADR x Occupancy Rate
RevPAR = $75 x 80%
RevPAR = $60
You need to understand RevPAR to make data-driven decisions that can help you fine-tune your approach to pricing and marketing, ultimately boosting your bottom line. Let’s break down what RevPAR is, how to calculate it, and how it can inform your decisions to maximize revenue for your Airbnb.
What Is RevPAR?
RevPAR is a significant metric in the hospitality industry that provides a snapshot of the revenue a short-term rental (STR) generates. It’s based on the optimal combination of occupancy rates and pricing strategies.
Though RevPAR for hotels looks at Revenue Per Available Room, RevPAR in the short-term rental industry reflects how much a host could earn per rental per night for each property they own. Understanding RevPAR can help you assess the operational efficiency of your rentals and make informed decisions that may increase the amount of money you make.
How RevPAR Fits Into the Bigger Picture
RevPAR is not a standalone figure. Instead, it reflects how well Average Daily Rates (ADRs) and occupancy rates are balanced to maximize revenue.
- Average Daily Rate (ADR): This is how much a host charges per day for their rental, reflecting the pricing strategy of the property.
- Occupancy Rates: This metric shows the percentage of available rooms or rentals occupied at a given time. It helps property managers understand the demand and attractiveness of their property.
When combined, these two metrics feed directly into the calculation of RevPAR, offering a snapshot of the property’s performance. A higher RevPAR indicates a successful alignment of pricing and occupancy strategies. In contrast, a lower RevPAR might suggest areas for improvement, such as adjusting prices or doubling down on marketing efforts to increase occupancy.

What RevPAR is Used For
- Optimizing Revenue: RevPAR provides insights into which strategies yield the better financial results—whether pushing for higher prices at the cost of reduced occupancy or lowering prices to fill more rooms. The ultimate goal is to find the sweet spot that brings in the maximum revenue.
- Market Positioning: You can gauge your market positioning by comparing your RevPAR with industry averages or similar properties. This helps you identify whether your property is underperforming or outperforming the market, guiding strategic decisions regarding pricing or marketing.
Keep in mind that finding comparable listings is crucial to accurately benchmarking your property against other short-term rentals. Variables like type of property, number of bedrooms, and amenities all affect ADR. When using AirDNA to build a custom comp set, be sure to target properties that are similar in size and offerings.
Understanding the interplay of property features and their impact on RevPAR empowers vacation rental managers to make data-driven decisions that increase their bottom line as well as their efficiency.
How to Calculate RevPAR
The method you choose for calculating RevPAR depends on whether you're assessing individual properties or entire markets. Let's break down the calculation into simple terms first, then move on to the nitty gritty.
RevPAR Formula for Individual Listings
At its most basic, the RevPar formula is
- Total Revenue/Number of Available Nights.
This formula provides property owners with an average figure of nightly revenue for the days their property is available, offering a true reflection of earning capacity and ensuring the data isn't distorted by unbookable days. Unbookable days may include times when you’re using the property for personal use or have scheduled maintenance.
You can also calculate RevPAR with ADR x Occupancy Rate. You’ll get the same result because this formula effectively mirrors the one above. It accounts for how much revenue is made on booked rooms, adjusted by how often they’re booked.
Both approaches are designed to measure revenue efficiency but from slightly different perspectives.
RevPAR Formula for Markets
RevPAR looks and sounds a little different in the context of market analysis.
AirDNA calculates RevPAR for a market in two ways:
- Daily RevPAR = Total Daily Revenue/ Total Number of Listings Available
- Monthly RevPAR = Total Monthly Revenue / Total Number of Listing Nights Available Over the Month
These numbers help investors understand market-wide demand and seasonality. You can read more on RevPAR figures in AirDNA data here.

A RevPAR Example
Let’s look at an example to illustrate how to calculate RevPAR:
Let’s say you have a property with the following available nights, booked nights, and revenue figures:
- 100 available nights
- 80 booked nights
- A total revenue of $6,000
First, we calculate the Average Daily Rate (ADR):
- ADR = Total Revenue / Booked Nights
- ADR = $6,000 / 80
- ADR = $75
Then, we determine the occupancy rate:
- Occupancy Rate = Booked Nights / Available Nights
- Occupancy Rate = 80 / 100
- Occupancy Rate = 80%
Now, we have two ways to calculate the RevPAR:
- Using the total revenue and available nights:
- RevPAR = Total Revenue / Number of Available Nights
- RevPAR = $6,000 / 100
- RevPAR = $60
- Using the ADR multiplied by the occupancy rate:
- RevPAR = ADR x Occupancy Rate
- RevPAR = $75 x 80%
- RevPAR = $60
Use RevPAR Data to Optimize Strategy
AirDNA's detailed dashboard provides a wealth of data on RevPAR by market, which is an invaluable resource for vacation rental owners looking to refine their strategies. The screenshots below showcase the RevPAR performance in Key West over the last year, offering insights into market trends and demand cycles.
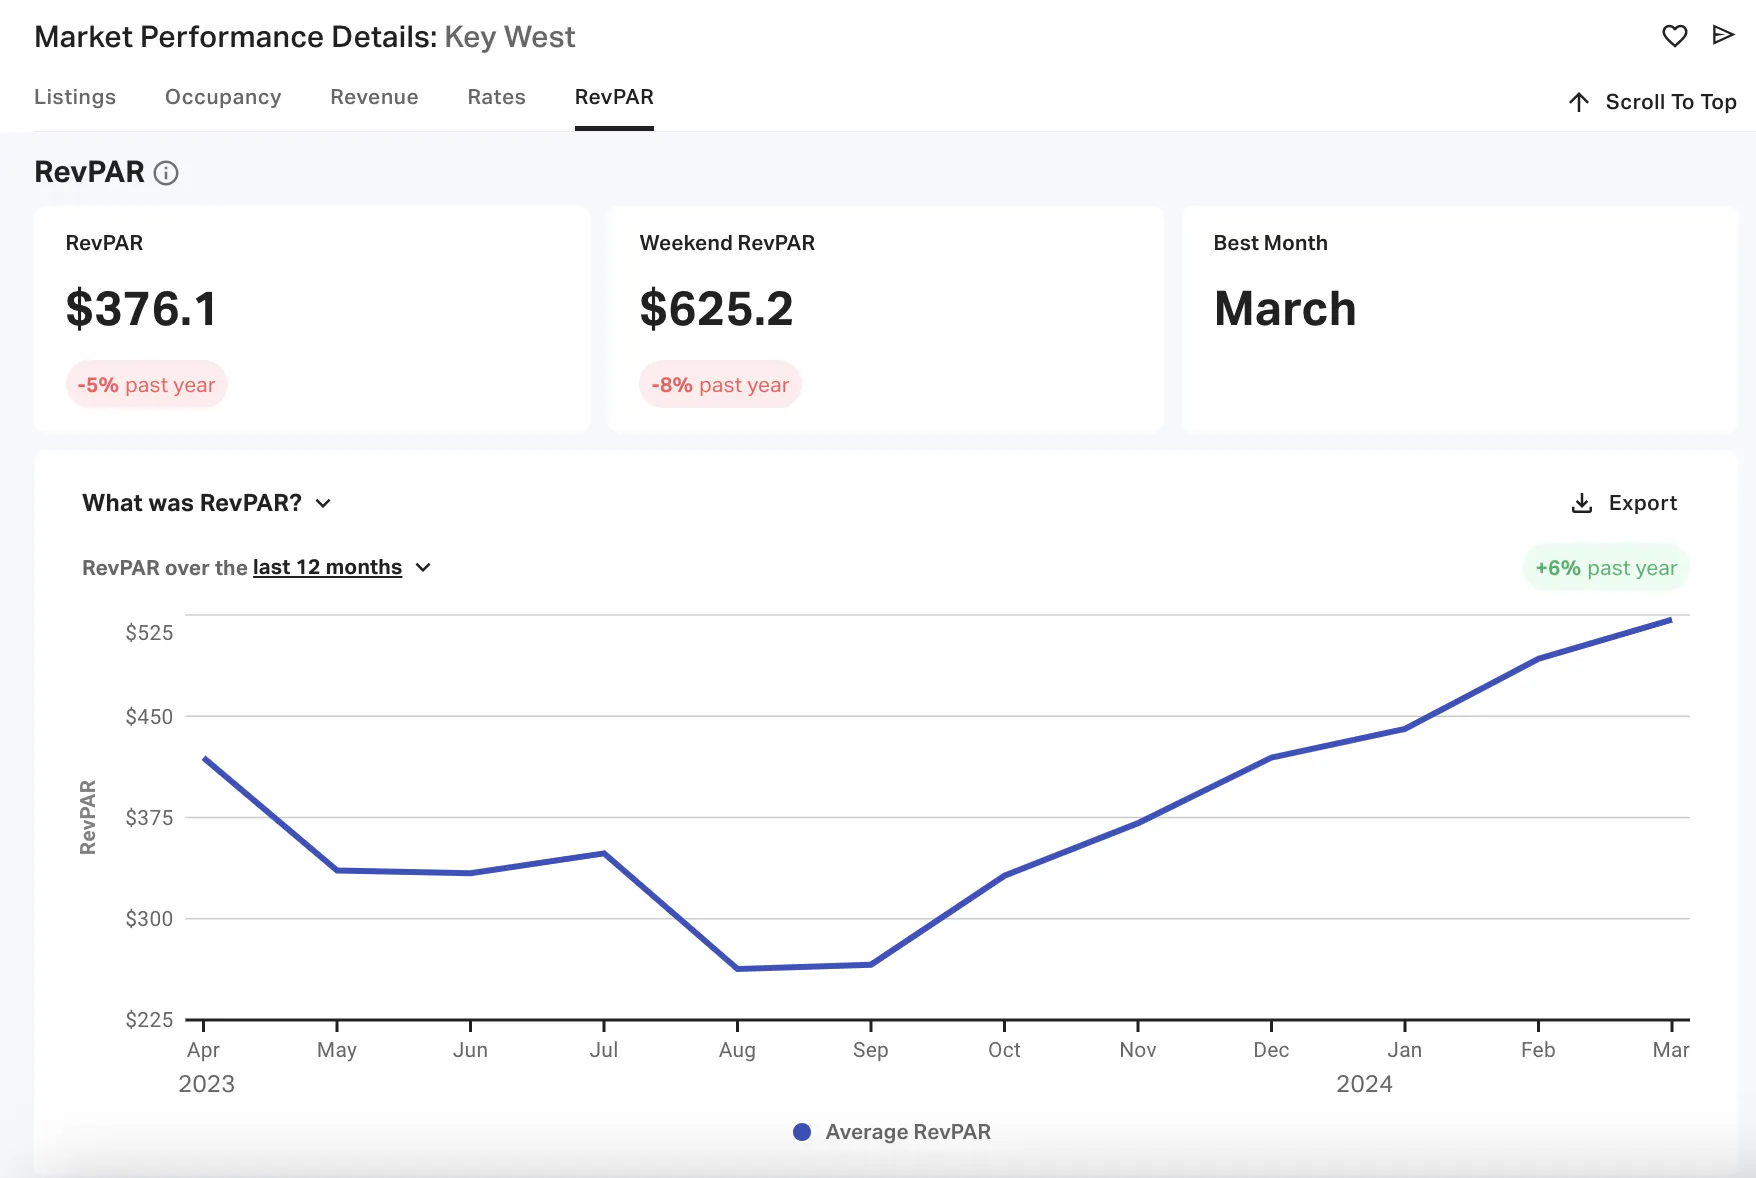
Our first graph illustrates the ebb and flow of RevPAR between April 2023 and March 2024, with a clear peak in March—indicative of high demand, possibly due to spring break travelers. This information is crucial for understanding when to adjust pricing to capitalize on increased demand.
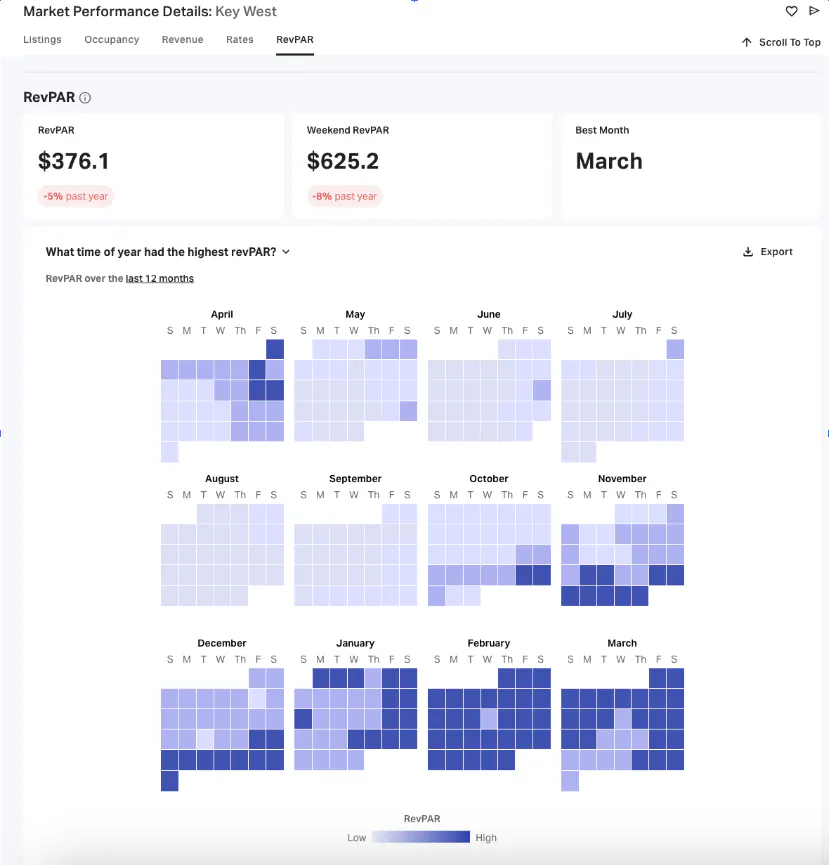
The above graph shows us a heat map of daily RevPAR throughout the year. The darker shades represent higher RevPAR days, which correspond with popular travel times or local events. Property owners can use this data to anticipate peak periods and adjust their booking strategies accordingly.
Let’s imagine you have a couple of properties in Key West and want to optimize your pricing strategy. You can use RevPAR to help you determine whether to adjust your ADR or your occupancy rate.
- Consider an upscale condo with an ADR of $250 and an occupancy rate of 40%. While the unit commands premium rates, its RevPAR may be limited by lower booking frequency. If the Key West market shows higher occupancy trends, especially during peak months, the host might consider lowering the rate slightly to increase occupancy and potentially improve overall RevPAR.
- Conversely, a cozy bungalow might have an ADR of $120 with an occupancy rate of 90%. Despite being frequently booked, its RevPAR could still fall short if the market's ADR is higher. By analyzing market data, the host may find room to increase the ADR during high-demand periods to boost revenue without significantly impacting bookings.
Ultimately, the goal is to use the RevPAR figure as a benchmark to assess whether current strategies are working or if new tactics need to be implemented to drive a higher RevPAR.

Why RevPAR Matters for Your Airbnb
RevPAR is more than just a figure on a spreadsheet; it’s a vital indicator of your Airbnb’s financial performance. It takes the pulse of your rental's health by marrying the average daily rate (ADR) with occupancy rates—two metrics that, when optimized together, can lead to a winning strategy for maximizing income.
Lowering daily rates might fill your calendar but at the cost of diminishing returns, whereas higher rates could mean fewer guests but potentially more revenue. It's a delicate balancing act where understanding the interplay of these elements is key.
Using AirDNA’s data, hosts can compare their RevPAR against market trends and adjust strategies accordingly. For instance, a property in a busy urban area may benefit from a higher ADR due to constant demand.
In contrast, a beachfront rental might adjust prices seasonally to capture the market at peak times. By analyzing RevPAR trends and making data-driven adjustments, hosts can strategically position their listings to not just compete but thrive in their respective markets.
RevPAR Outlook for 2024
After a challenging 2023 that saw the first RevPAR decline since AirDNA began tracking data in 2014, the outlook for 2024 shows signs of recovery and modest growth. Last year's 4.9% drop in RevPAR was driven by high supply growth, prior rate hikes, and stretched consumer budgets, which affected occupancy rates and pricing flexibility.
Despite these challenges, the market also saw positives, such as record demand in July and a peak in available listings reaching 1.6 million by September. With the economic environment stabilizing—marked by low unemployment and falling inflation—the STR market is poised for a rebound.
For 2024, we anticipate a 1.9% rise in RevPAR, supported by steady occupancy and a 2.1% increase in ADR. This expected growth indicates a shift towards more stable market conditions and an alignment with broader economic recovery.
For a detailed analysis and more insights into the future of the STR market, refer to our full Market Outlook Report. This report offers in-depth forecasts and strategic recommendations to help STR operators optimize their properties in the evolving market landscape. We also offer a monthly U.S. and European market review if you’re seeking regular updates on key STR performance metrics.
How to Improve Your Airbnb’s RevPAR
Knowing how to adjust your RevPAR is a sign of an experienced short-term rental owner or investor (but even beginner Airbnb hosts can master it too!). Here are several actionable strategies and tips to improve RevPAR:
1. Optimize Pricing
- Implement a dynamic pricing strategy that adjusts rates based on demand, local events, and seasonality. Tools like AirDNA can help forecast demand patterns and suggest optimal pricing.
- Regularly compare your rates with similar properties in your area. Make sure your pricing is competitive and reflects the value and unique amenities your property offers.
2. Boost Occupancy
- Offering a more flexible cancellation policy can make your listing more attractive, especially to travelers who are making last-minute plans or are uncertain about travel conditions.
- Use high-quality photos and detailed, compelling descriptions to showcase your property’s best features. Promote your Airbnb across social media platforms to increase visibility.
- Develop special promotions or discounts to attract guests during off-peak seasons when demand is lower. Consider targeting business travelers or offering extended stay discounts.
3. Improve the Guest Experience
- Exceptional guest experiences often translate into positive reviews, which can increase your property's appeal and allow you to command higher rates. Focus on providing excellent service, cleanliness, and thoughtful touches that exceed guest expectations.
- Invest in key upgrades that guests value, such as high-speed internet, modern appliances, or a hot tub. Amenities like these can justify higher nightly rates and improve overall guest satisfaction.
4. Utilize Market Data
- Use vacation rental data tools like AirDNA to gain insights into market trends, competitor performance, and economic factors affecting travel in your area. Understanding the market helps you anticipate changes in traveler behavior and adjust your strategies accordingly.
Employing these strategies can improve your Airbnb’s RevPAR, ensuring your rental property meets the market standard and stands out. In addition to tangible benefits like improved RePAR, these strategies can encourage repeat business and attract new guests.

Frequently Asked Questions
What is the difference between RevPAR and ADR?
RevPAR (Revenue Per Available Room) and ADR (Average Daily Rate) are both critical metrics in the hospitality industry, but they serve different purposes.
ADR measures the average revenue earned from rented nights only and does not account for unbooked nights. It gives you an idea of pricing effectiveness when a room is sold.
In contrast, RevPAR considers the average revenue generated per available rental, whether booked or not. This provides a broader view of the interplay between pricing and occupancy. RevPAR helps assess how well a property is using its available inventory to generate income.
What makes a good RevPAR?
A "good" RevPAR varies by market, property type, and the economic conditions that affect the travel and hospitality sectors. Generally, a good RevPAR shows year-over-year improvement or outperforms the average RevPAR of comparable properties in the same region or category.
Benchmark your listing against similar properties, consider trends over time, and factor in market conditions if you want to assess whether your RevPAR is competitive. Improving RevPAR can be achieved by increasing ADR, occupancy rates, or a combination of the two.
How can I use RevPAR to improve my Airbnb listing’s performance?
RevPAR is a powerful tool for making informed decisions about your Airbnb listing. Here are a few ways to use this metric effectively:
- Optimize Pricing: By tracking RevPAR alongside market trends, you can adjust your pricing strategies to maximize revenue, especially during peak and off-peak seasons.
- Strategic Marketing: If RevPAR is low due to occupancy issues, consider boosting your marketing efforts or offering promotions to increase bookings.
- Performance Tracking: Regular monitoring of RevPAR can help you gauge the success of your operational strategies and make necessary adjustments. It allows you to see the impact of your decisions on both occupancy and nightly rates.
- Market Comparison: Use RevPAR to see how your property stacks up against the competition. If your RevPAR is lower, it may be time to reassess your amenities, services, or property improvements.
ARTICLE SUMMARY
RevPAR is a key metric for vacation rental owners to maximize their revenue. It's calculated by combining average daily rate (ADR) and occupancy rates to give a clear picture of revenue generation.
Dillon DuBois
AirDNA Senior Product Manager
Dillon DuBois is a seasoned expert in the short-term rental space, having worn many hats at AirDNA since joining in 2019. From driving B2B marketing initiatives to shaping product strategy, Dillon’s deep understanding of both the company and the industry makes him a key player in delivering innovative solutions. Now a Senior Product Manager, he leverages his experience to bridge the gap between data and user needs. He manages his own short-term rental in Medellín, Colombia, and enjoys all things outdoor adventure, travel, cooking, & surfing.