Calculate Revenue
 Research Markets
 Find For Sale Properties
 Compare My Listing
 STR Revenue Calculator
 Custom Comp Sets
 Submarket Insights
 Custom Search Filters
 Rate Recommendations
 Performance Benchmarking
 Competitor Comparison
 Owner Contact Details
 Property-level performance data
 Tourism Insights
 Real Estate Investment Analytics
 About Us
 Sales
Sales Support
 Press
PressHow to Nail Your Homeowner Projection Pitch | AirDNA

Converting a homeowner lead into a profitable addition to your property management portfolio is tricky.
Many of you spend good time and energy drafting a projection pitch, but it doesn’t seem to seal the deal. In fact, we spoke to a range of vacation rental manager companies, and they told us that their conversion rates can sit as low as 20%. That means they only convert 1 in 5 of every homeowner that touches base with them.
But that remaining 80% of homeowners are not lost. We’ve seen vacation rental managers improve their conversion rates by as much as 60% in a matter of months. How? It starts with the AirDNA property management pitch deck and, of course, data.
These are our top tips to perfect your homeowner projection pitch.
How to Use the Pitch Deck Template
The AirDNA property management pitch deck is free to download and has slides that delve into the following areas for homeowners:
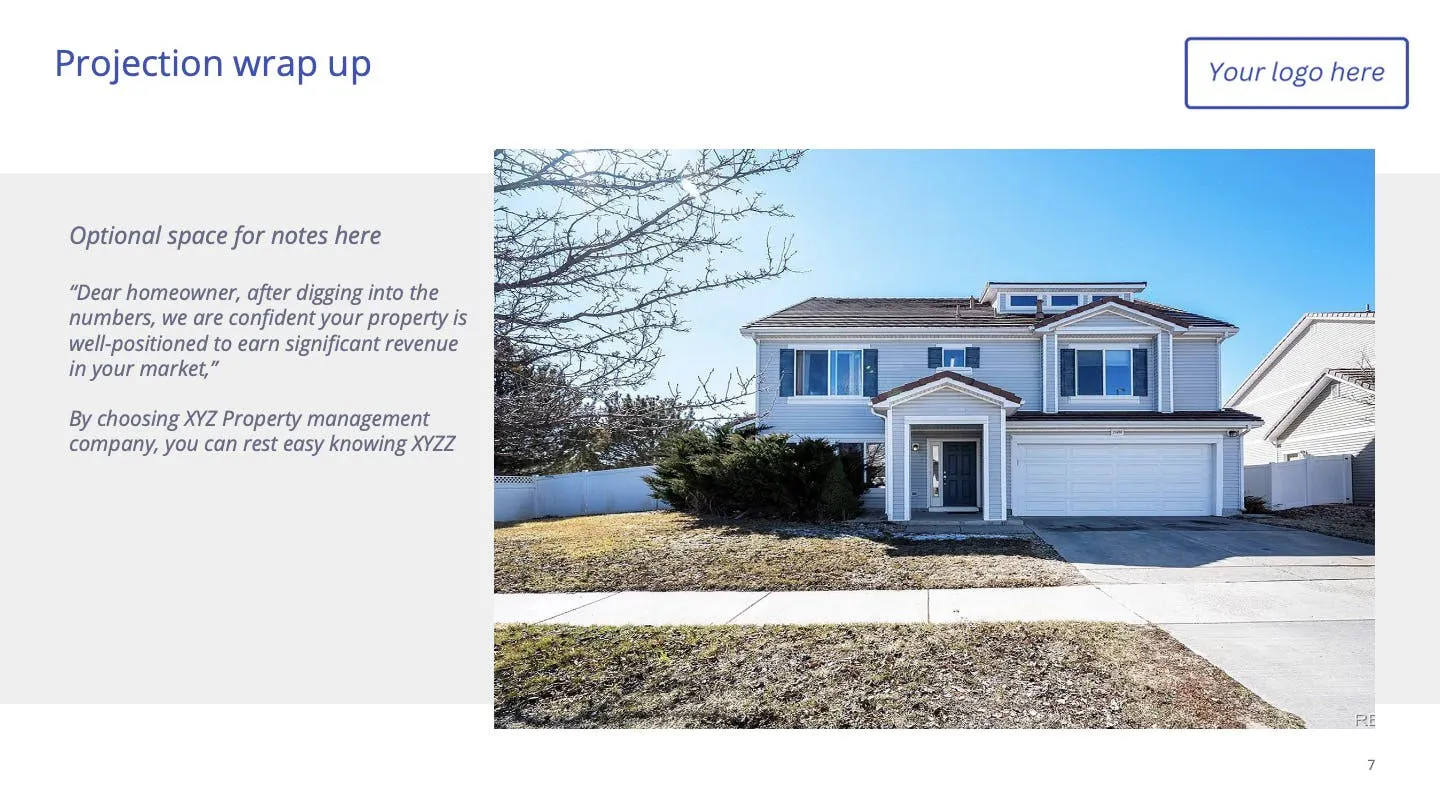
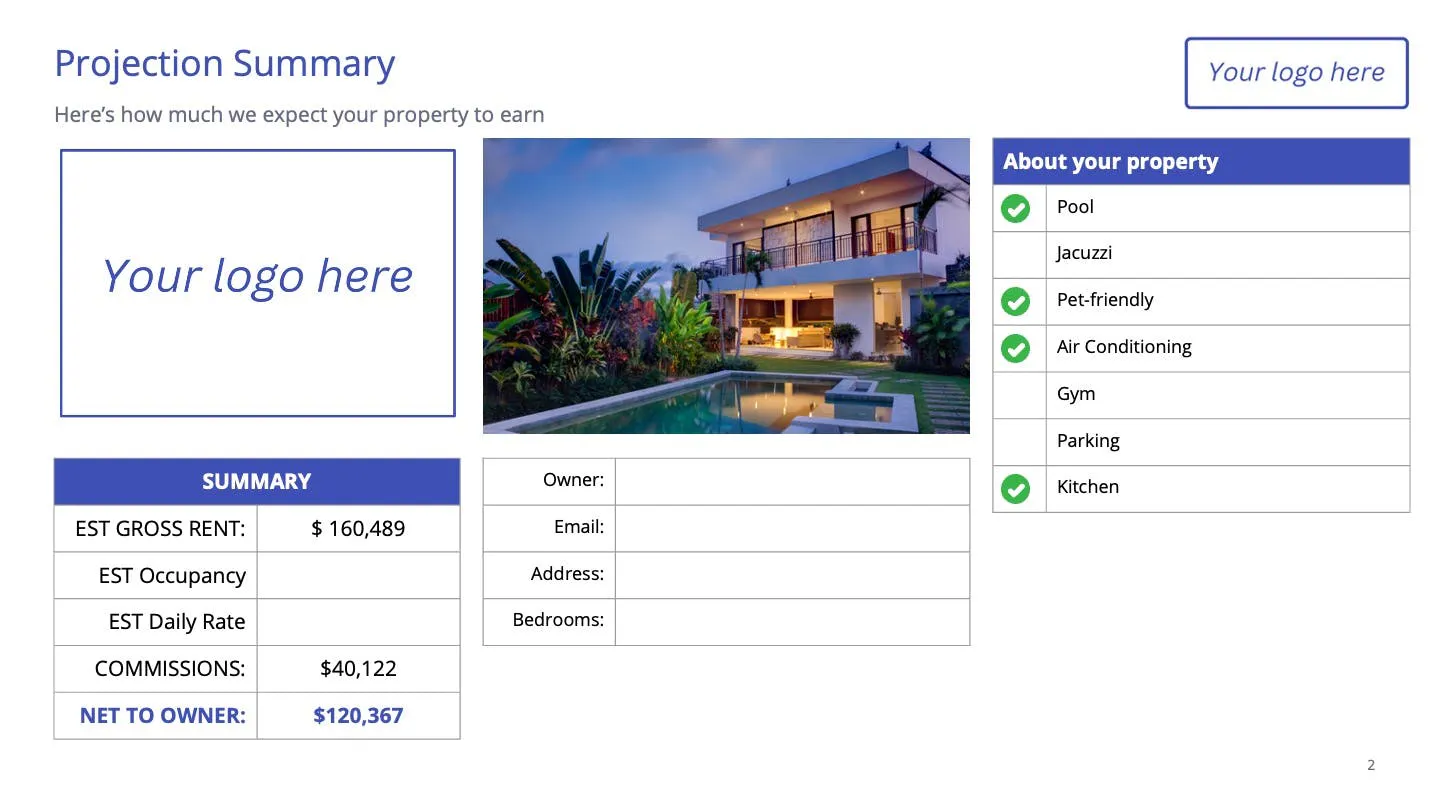
- Projection summary
- What to expect around rates, occupancy, and revenue
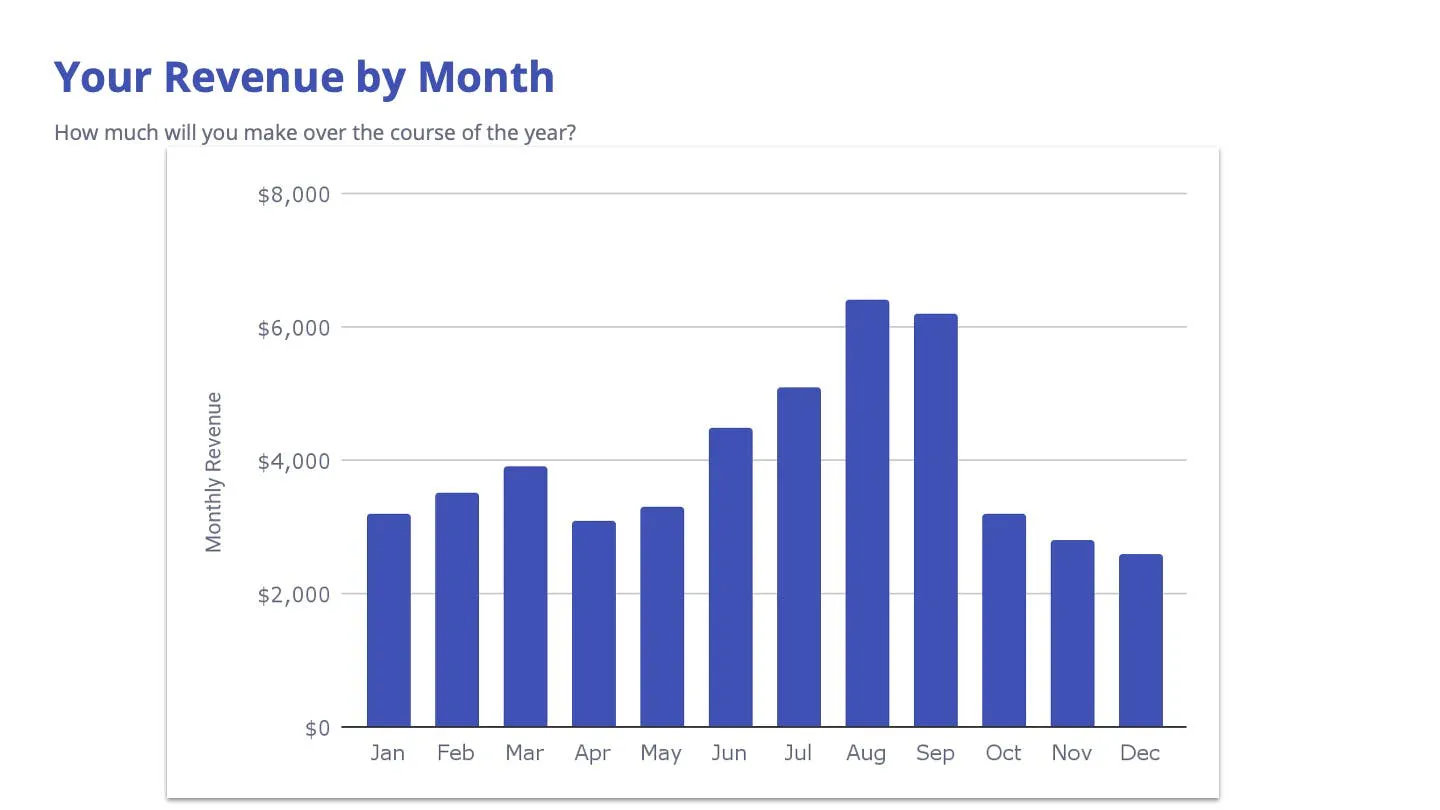
- Revenue by month
- Top comparable properties
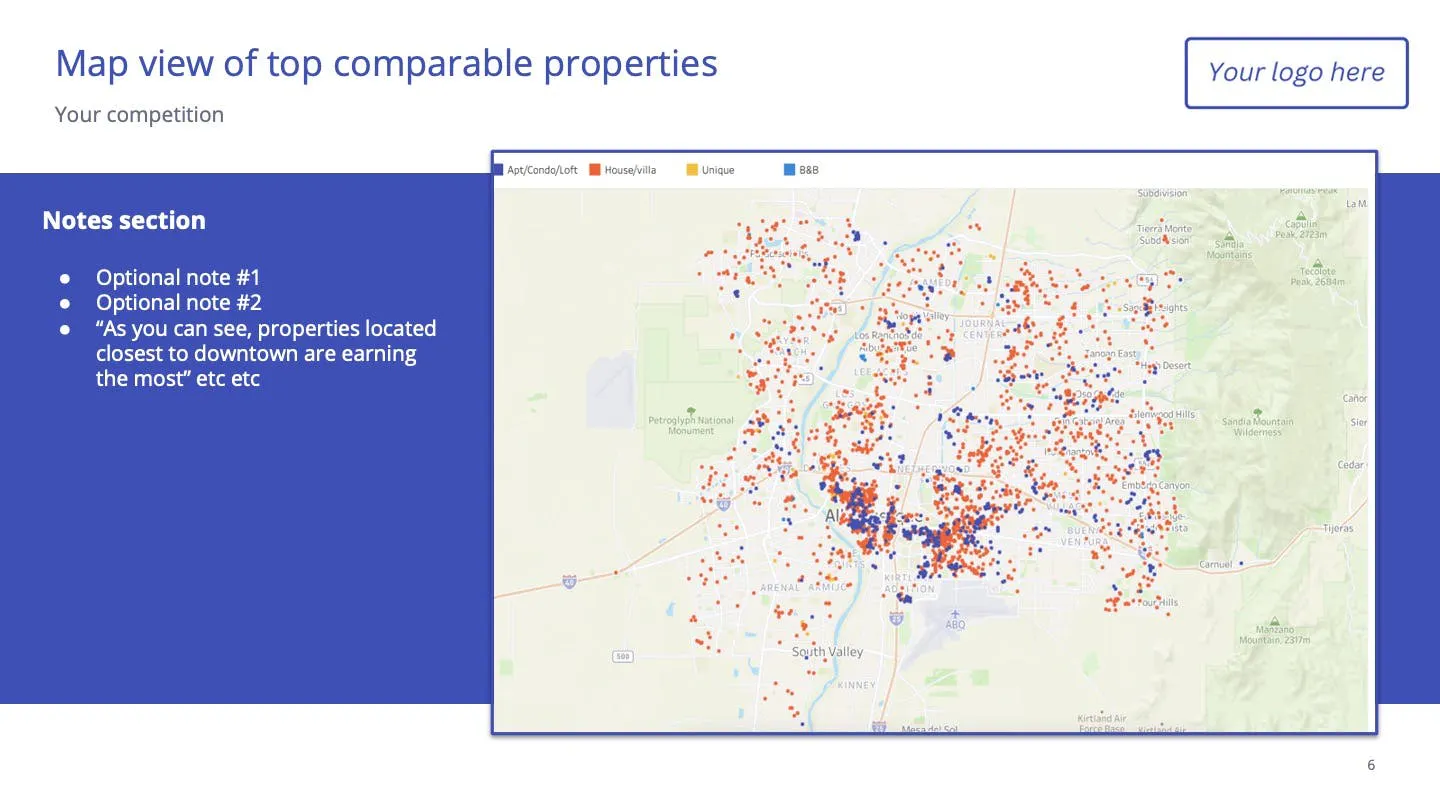
- Map view of top comparable properties
- Projection wrap-up
Each slide has labeled placeholders where property managers can insert data from the Property Performance Dashboard (PPD). There are also prompts to help qualify the data (e.g., “As you can see, properties in X location are earning the most”) and spaces to brand the pitch according to your company.
Within your pitch deck, follow these practices for the best results:
Offer an Overview of Homeowners’ Markets
Trust is the backbone of any good pitch, and providing an overview of the vacation rental market gives homeowners a reason to trust you. Why? Because you’re introducing them to information that is genuinely valuable, not immediately pushing a business sale.
Using the Property Performance Dashboard, you can show homeowners property trends in their area, letting them in on seasonal insights like “You’re likely to see 50% of your revenue come in X months of the year” or “There are Y other two-bedroom properties in your market and price range”.
These snippets go a long way in positioning you and your pitch as experts and tell homeowners that you’re tuned into the macro workings of vacation rental property management. Once you’ve got them on board with your vacation rental company, you can then zoom in on the micro workings too.
Provide Accurate Projections for Properties
Beyond a synopsis of homeowners’ markets, use a comprehensive analysis tool like the Property Performance Dashboard to include representative projections for homeowners’ specific listings in your pitch. This data lets homeowners know that you’re invested in working with them for good as well as boasts your access to sophisticated, informative resources.
Remember that homeowners want data that makes the most sense to them, so take care to set appropriate filters for the projections. For example, the dashboard allows you to draw your own precise custom region amenities, property type, property rating, full-time properties, and more. You can then slot this aggregate data into your pitch and seamlessly impress your leads.
Show Owners Comparable Properties (and Their Data)
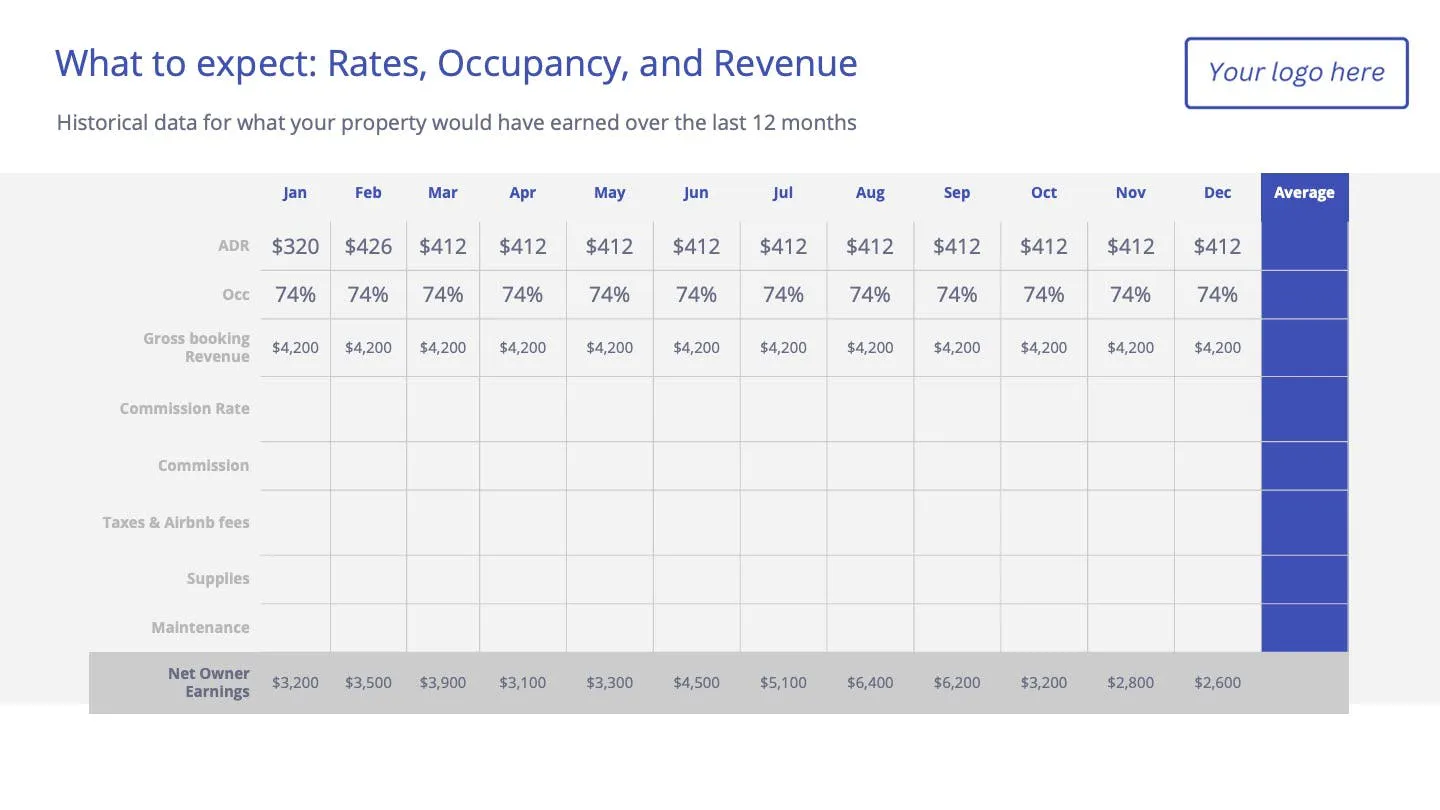
Homeowners don’t want wishy-washy advice from vacation rental managers. “Properties like yours can make X per month” is too vague for homeowners to convert. Instead, give them granular data about their competitors (the ones they know and don’t know about). We’re talking about statements like “X property generates Y per month”. This data could come from properties that are already in your portfolio, or you can use the Property Performance Dashboard to pull information on any property, anywhere. This is a perfect use for a comp set as well.
And when it comes to formatting, the AirDNA template has placeholders for you to easily add photos and data from their would-be competitors.
Break Down Seasonal Fluctuations
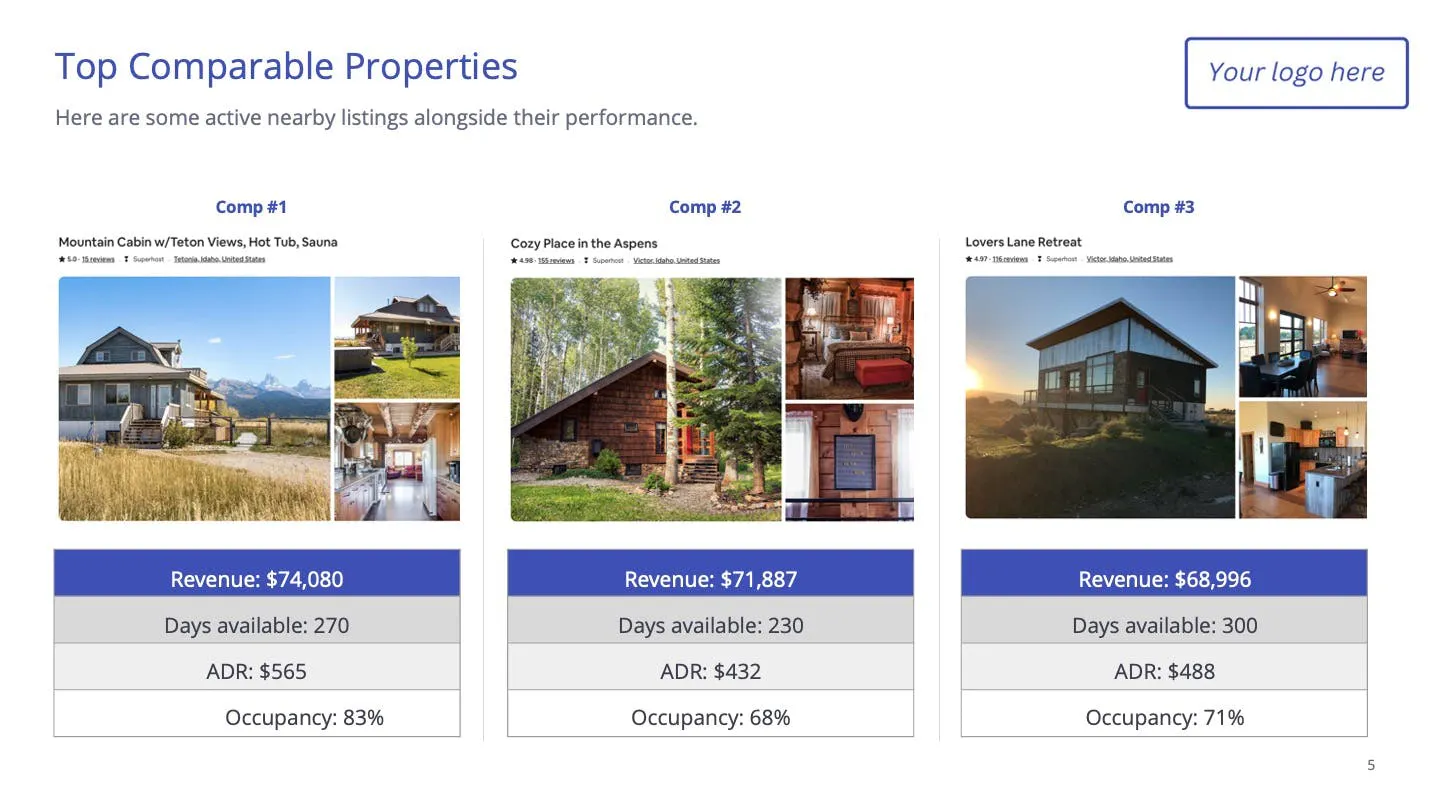
Twelve months can be a long time in homeowner years. While in some instances an annual overview makes sense, homeowners also need to know what to expect on a month-by-month basis to identify peak and lull seasons and adjust their strategy.
In your pitch template, be sure to add data that communicates metrics like rates, occupancy, and revenue per month. The Property Performance Dashboard clearly displays this with up to five years of historical data.
Separate Yourself from the Property Manager Pack
Creating any perfect match requires a little peacocking—homeowners often have dozens of property managers to pick from, so why should they knock on your door?
Your pitch template should showcase where you excel compared to others in the industry. In other words, let the data do the talking for you with stats around your average rating, reviews, nightly rates, and occupancy levels, all shown side-by-side in the PPD against other property managers.
Talk about Historical Performance
Some of the biggest takeaways in the vacation rental space come from looking at historical data. Naturally, homeowners need to know how their property is performing now, but trends from previous years can give a firm indication of what’s to come.
Your pitch template should feature appropriate data around rates, revenue, and more from set timeframes to help homeowners understand their property’s performance in practice as well as its potential.
Give Your Pitch a Unique Touch
Sprinkle some pizzazz on your pitch! Your template is a reflection of your property management brand and how you work with homeowners. Don’t be afraid to be creative with your messaging and marketing techniques to really convince leads to convert.
You may want to share a photo of one of your properties’ calendars or a series of rave reviews in the pitch and ask homeowners with similar properties if they want to replicate the success. Alternatively, you could include testimonials from homeowners in your portfolio about how your data diligence has boosted their returns.
Make Your Data a Long-Term Discussion with Homeowners
The strongest partnerships have ongoing communication. No homeowner wants to be lured in with data and then get radio silence for the rest of the year. Make it clear that you’ll be checking in frequently, whether through monthly competitor analysis, quarterly reports, or year-in-review documents. You can find the data to compile these in the Property Performance Dashboard, alongside metrics that can determine how properties are performing in their local and wider markets at any time.
Your homeowner projection pitch is a stepping stone to convert leads, and data is the fuel to accelerate the journey. With data, you can shape deeper trust with homeowners, offer them meaningful insights, and convey your distinct brand value.