Product Overview
The #1 Tool for STR investment data
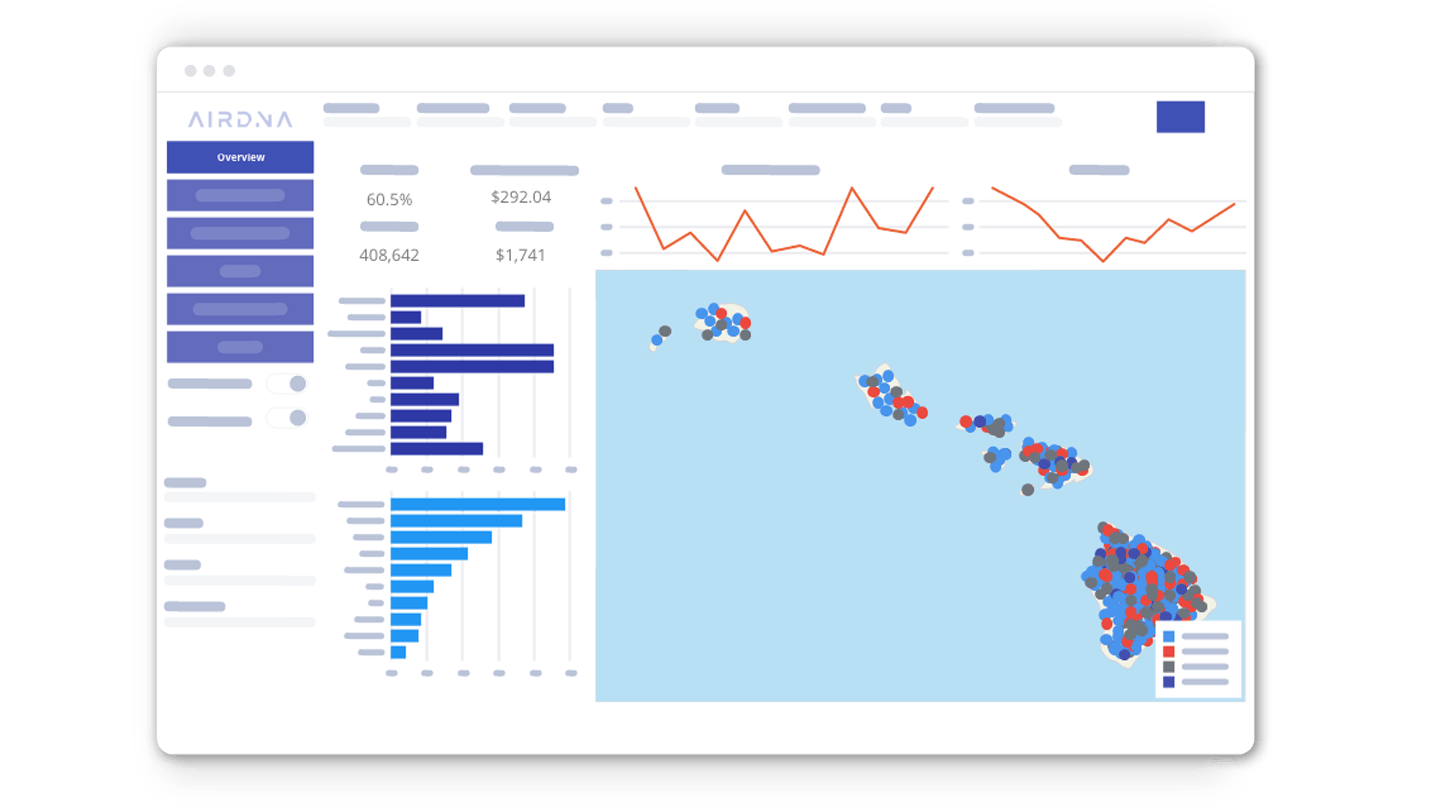
Think of the Property Performance Dashboard like a search engine for your real estate business. Find fast answers to any investment question imaginable. “How much would a pet-friendly three-bedroom with a pool make in that neighborhood?” Or, “Are mountain towns better than beach towns?”
Investment strategy
Revolutionize your investment strategy
Ditch the spreadsheets and friend-of-a-friend advice. The Property Performance Dashboard empowers investment teams to stand out by making smart portfolio decisions—all from one, easy-to-use platform.
How it Works
Powered by AirDNA Research
The Property Performance Dashboard is powered by the world’s most trusted name in vacation rental analytics. We track the daily performance of every listing on Airbnb & Vrbo and bolster our insights with over 1.5 million partner properties & 100,000+ host-submitted properties.
Explore Any Market
Discover the best markets for vacation rental ROI
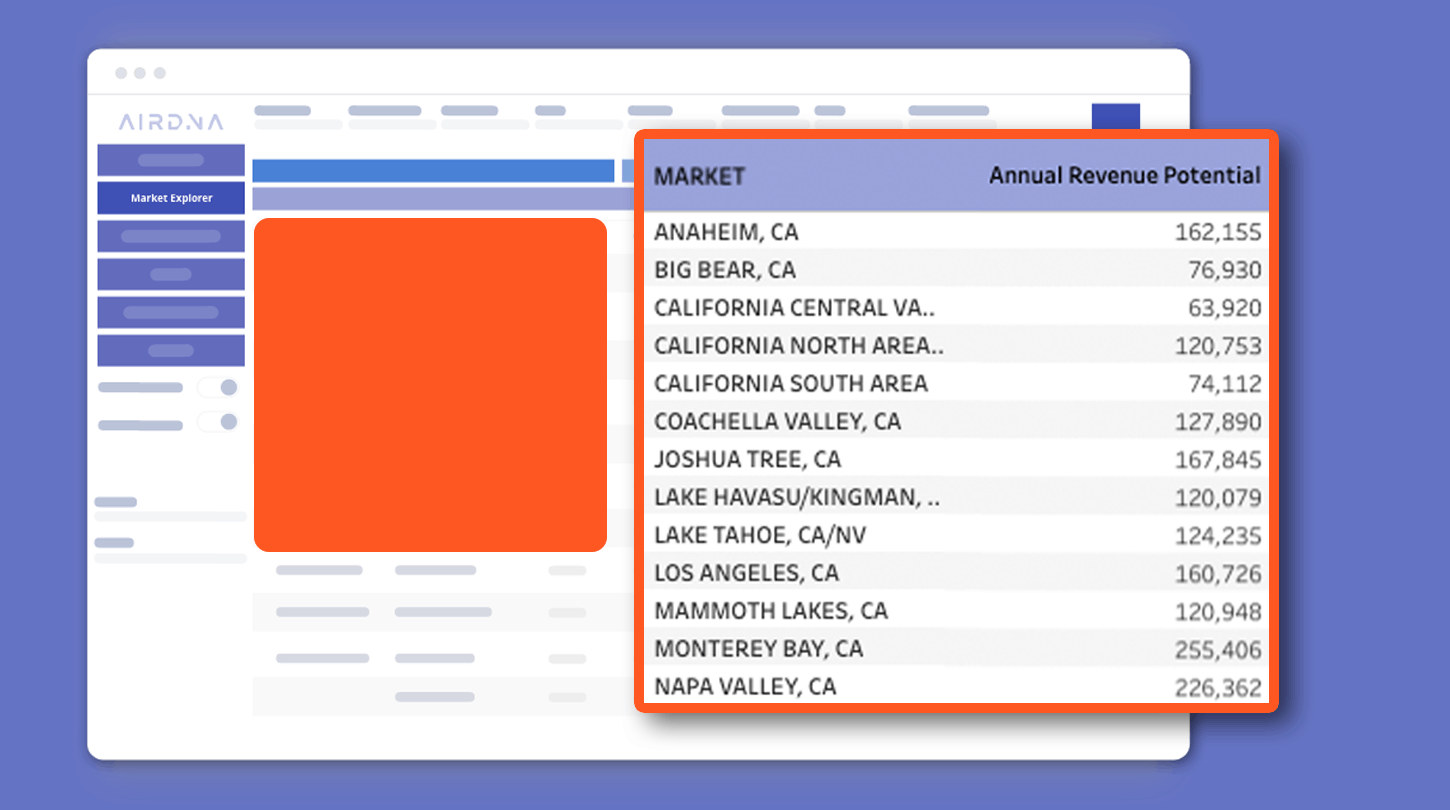
Vacation rental management can be lucrative—as long as you're in suitable locations. Use the dashboard to easily sort markets by those with the highest revenue potential, daily rates, length of stay, listing count, and much more.
Uncover hidden gems
Find the next up-and-coming hotspot
Whether you’re looking for hidden gems or reliable cash flow, the dashboard allows you to uncover the anatomy of any market. After all, what makes sense for your portfolio might not make sense for others.
Introducing location types
Not all markets are created equal
Drill down your analysis by location type (mountain, coastal, urban), submarket, neighborhood, and zip code. Trust us—finding new markets is a breeze.
Accurate Revenue Projections
Vacation rental projections for any address
Wondering how much an unlisted property will make on Airbnb? Underwriters, lenders, and investors use the Property Performance Dashboard to create hyper-targeted comp sets to gauge revenue potential and set accurate expectations.
Amenity analysis
To be (pet-friendly), or not to be?
Amenities make a world of difference. See how add-ons like pools and jacuzzis influence revenue potential, and then use that insight to inform your investment strategy.
Creating Comp Sets
Filtering like you’ve never seen
The dashboard makes it easy to weed out irrelevant properties. Filter for rentals with a minimum number of reviews, ratings, bookings, days listed, and much more. Comparing like-for-like has never been easier.
Trends, comps, & property managers
Master your market’s trends
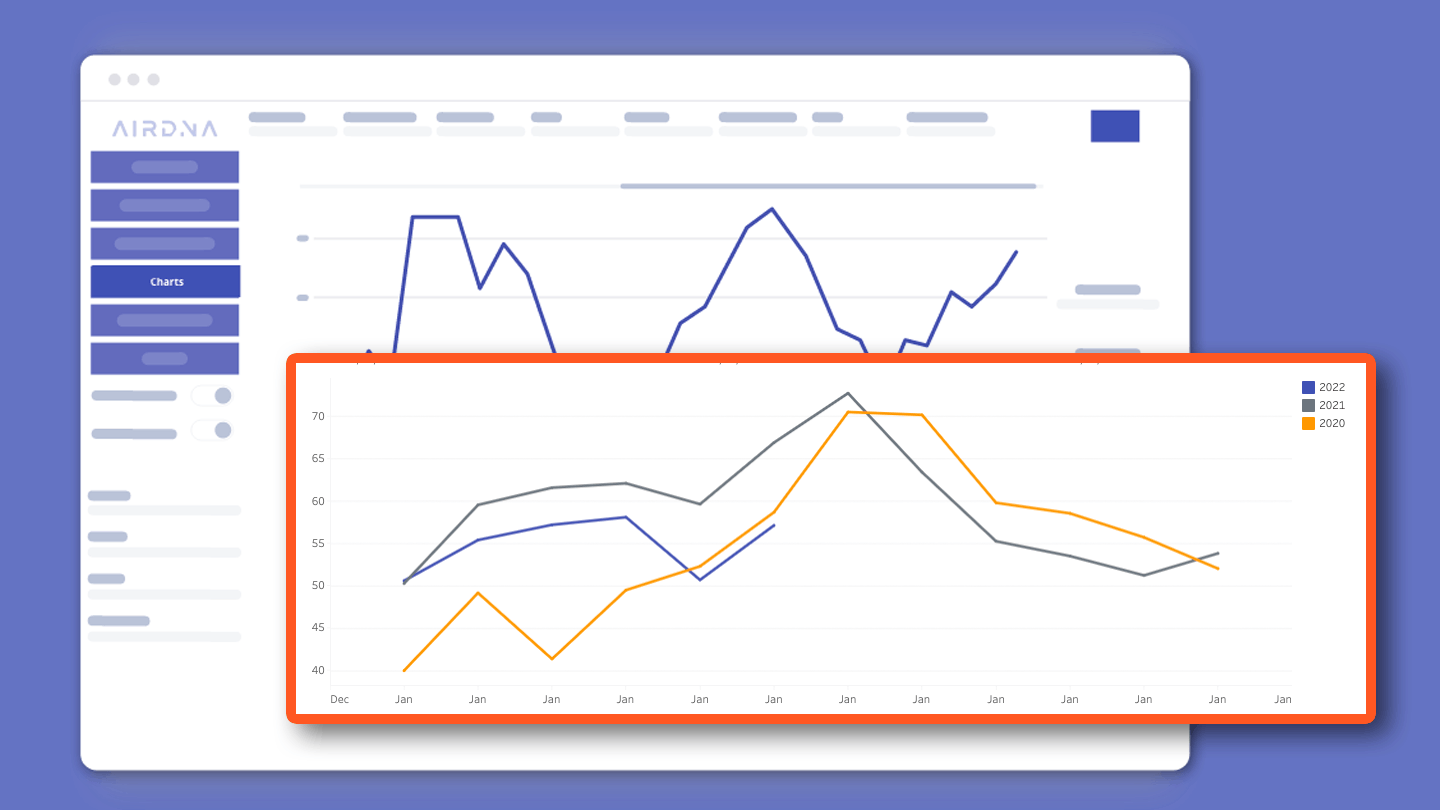
Knowing how properties currently perform is one thing, but what about their trends over time? The Property Performance Dashboard is jam-packed with historical data to quickly discover whether or not properties or markets are trending in the right direction.
Comps
Get granular in your research
Here's the real secret sauce. No summaries, no averages—just the true performance of every single listing on Airbnb and Vrbo. Uncover how much revenue they earn, what they charge, and study their live listings with photos and descriptions.
Property Managers
Track the who's who of vacation rental management
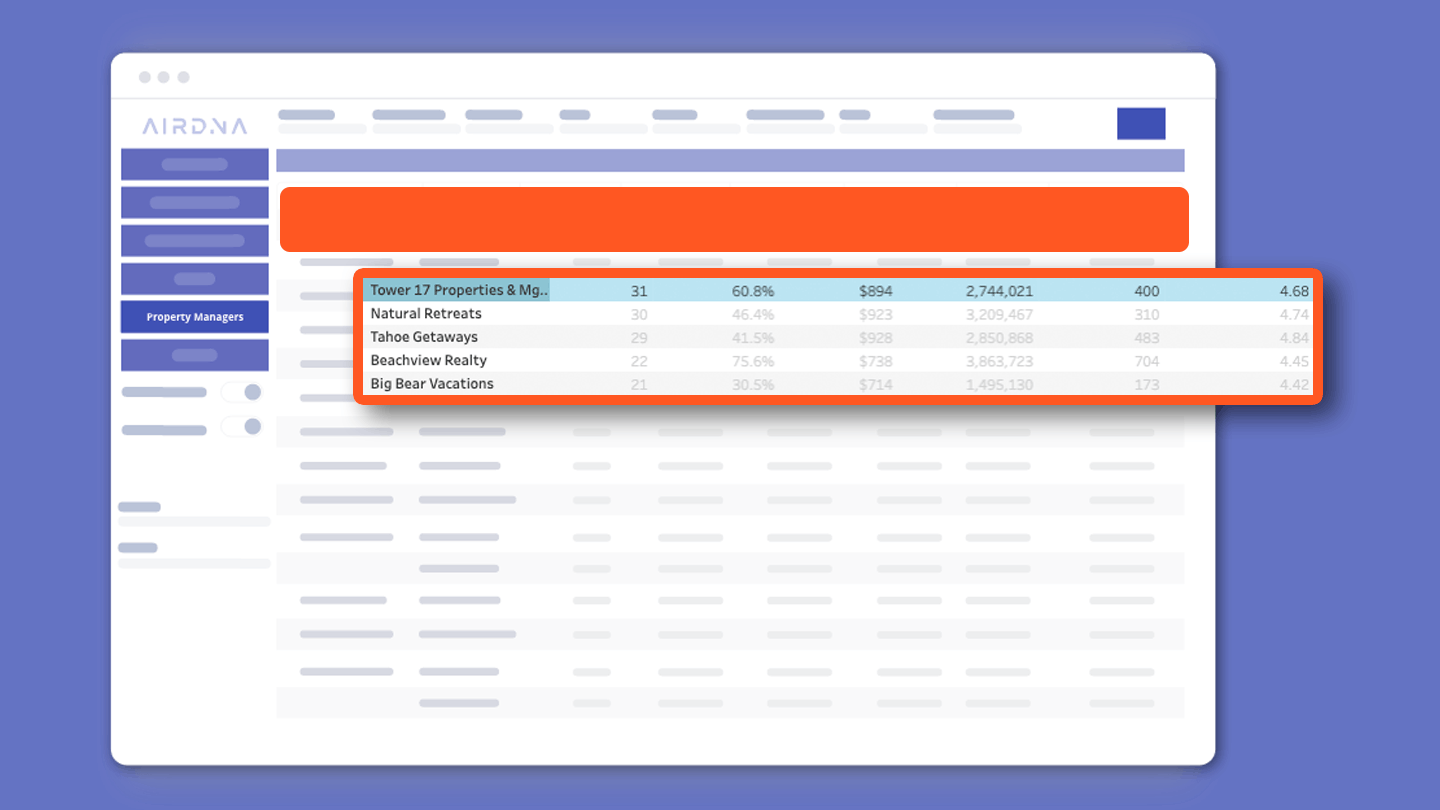
Looking for a suitable property manager for your next listing? Review rankings of the top-performing managers in any market for any property type.
10M
Global vacation rentals tracked
50K
All-time AirDNA customers
98.7%
Accuracy on all estimates
Loading...