U.S. Market Review: Demand Stays Strong as Occupancy Softens
Published: July 21, 2022
Last updated: May 5, 2026

Scott Sage
At a Glance: Key U.S. Short-Term Rental Performance Metrics for the Month of June 2022:
- Available listings reached 1.37 million, up 25.4% YOY (+9.8% vs. 2019)
- Demand is up 16.3% YOY (+23.8% vs. 2019)
- Occupancy was down 9.2% YOY to 63.6% (+8.6% vs. 2019)
- Average daily rates (ADRs) are up 4.5% YOY to $291 (+29.5% vs. 2019)
- Revenue is 21.5% higher YOY (+60.3% vs. 2019)
- Nights booked were up 5.8% YOY to 15.8 million
U.S. short-term rental (STR) occupancy hit 63.6% in June, which was down 9.2% from last year. While down from the highs in 2021, occupancy is still 8.6% higher than in 2019. Falling occupancies were driven by 25.4% year-over-year growth in the number of available listings, which now top 1.37 million listings. Overall industry demand remains strong, though: in June, demand was up 16.3% from last year and remains 23.8% higher than 2019 levels.

Despite recent lows in consumer and business confidence, key economic indicators related to lodging performance remained strong in June. U.S. employment increased by another 372,000 jobs in June and is now just south of pre-pandemic levels with no signs of significant slowing. Oil prices have fallen by over 20% in the past month, which has contributed to declining gas prices. This decline should marginally help last-minute bookings for summer travel. While unemployment remains at record lows, wages have pushed higher for most workers, helping offset inflation and maintain their spending power.
With demand maintaining its strength, close attention needs to be paid to new supply. Where is it being added, how much of that new supply is able to be absorbed into the market, and what impact is it having on occupancy and ADR? Fortunately, for existing short-term rental operators, it appears that gross new supply additions, i.e., how many new listings were added each month, have peaked. In June, there were 80,000 new listings added, down from the 83,000 added last month. While the pace of new listing growth slowed in large cities and destination/resort markets, it continued to climb in rural areas and small and midsize cities.

This was expected with the recent run-up in housing prices and interest rates, which has increased the average 30-year fixed mortgage payment by 58% in the past year, with most of those gains in just the past couple of months. The rising cost of new acquisition, combined with plateauing or declining revenues for short-term rentals, has reduced the investment opportunity in many areas throughout the country, which should result in fewer new units added in subsequent months as long as interest rates remain elevated.
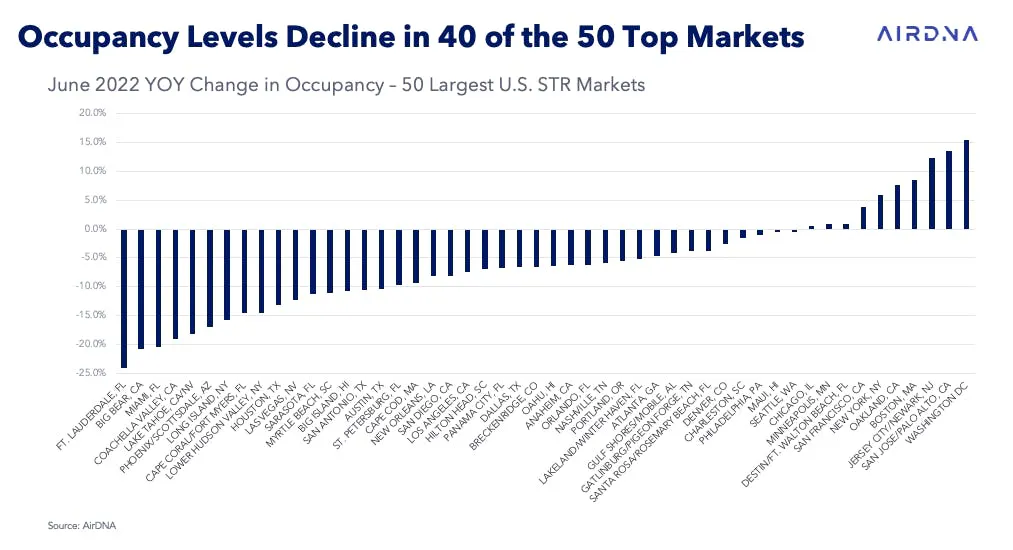
Occupancy Declines Impact Vast Majority of U.S. Markets in June
Of the 50 largest U.S. short-term rental markets, 40 saw year-over-year declines in occupancy in June. The largest declines were in Fort Lauderdale, Florida, Big Bear, California, and Miami, Florida, which all had declines of greater than 20% compared to last year. Washington, D.C. led markets for highest growth, with a 15.6% gain in occupancy. Even with the strong gains in D.C., the market is still 6.7% below 2019 levels. Similarly, all of the markets with the largest declines in occupancy are still well above 2019 levels.
To measure the impact that supply growth is having on market performance, we aggregated performance by grouping markets based on their year-over-year change in the number of listings in each market. The first group included those markets where listing growth was less than 20% over the past year, with the next group including markets where growth was between 20% and 30%, then 30-40%, and the final group included markets where growth in listings was greater than 40%. All groups roughly included the same number of markets.
Those markets in the first group, with less than a 20% increase in listings, performed significantly better across the key metrics. Occupancy still declined by 5.6% in these markets compared to a decline of more than 11% in markets where supply grew more than 30%. ADR growth in the low supply growth markets was more than double that of the high growth markets. RevPAR, or revenue per available rental (or listing), was positive for the month in the low supply growth markets, increasing by 1.7%, while in the high listing growth markets, it fell by 8.7%.
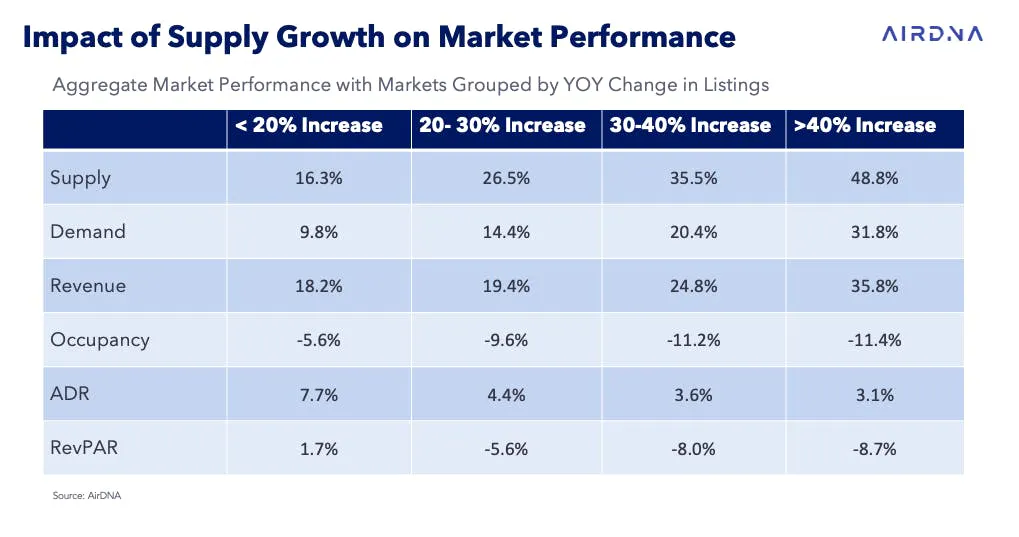
Another result of this analysis is how correlated supply and demand are: the markets with the highest supply growth have also seen the highest demand growth. This suggests that many of these markets were supply-constrained and that the growth in supply has allowed them to accommodate more guests who were already interested in coming. Though, the growth of new supply has significantly reduced the occupancy of existing properties and reduced the ability of hosts to continue to raise prices.
International Travel Picks Up, But Mostly Outside of the U.S.
Summer is the peak season for both domestic as well as international travel. Thus far, the opening of borders and a suspension of COVID-19 testing requirements to enter or re-enter the U.S. has primarily benefited those short-term rentals outside of the U.S. that have benefited from almost a full recovery of travel spending. As of May, the most recent data point from the NTTO, travel spending by Americans traveling outside of the U.S. was only 12% below 2019 levels.
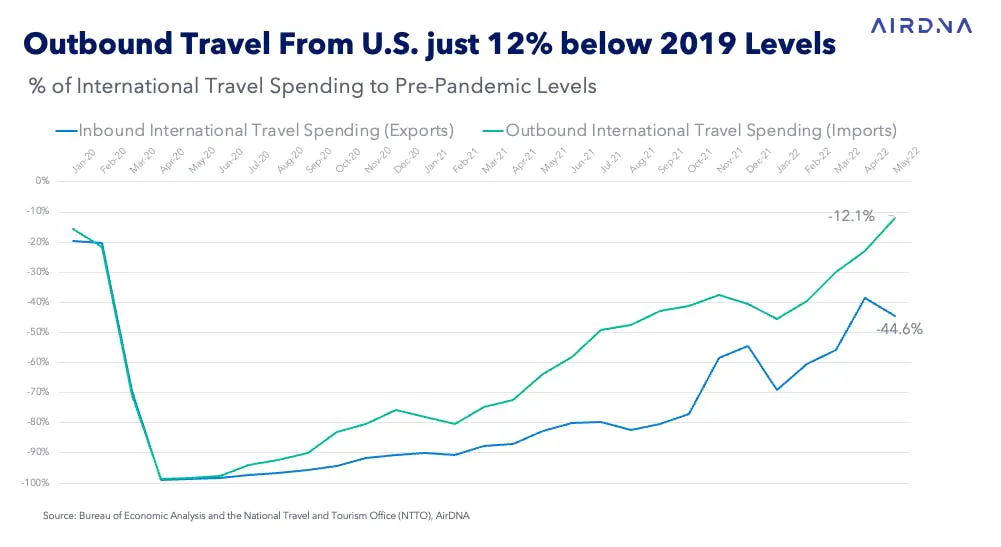
A recovery of travel spending by foreigners inside the U.S. has stalled in recent months and actually, as a percent of 2019 levels, retreated last month to -45% after reaching -40% in April. U.S. short-term rentals are seeing a similar pattern: when we look at the percent of reservations from domestic vs. international guests, the segment of bookings from international guests has fallen in May and June to around 60% below 2019 levels of booking share.
A large part of the reason why international guests are avoiding the U.S. is because of the strength of the U.S. dollar, which is at one of the highest levels in recent history. Likewise, the U.S. dollar and the euro are trading at the same level for the first time in 20 years. The strong dollar makes travel to the U.S. more expensive (curtailing inbound travel to the U.S.) and travel overseas cheaper (increasing outbound travel from the U.S.).
ADR Growth Slows as Occupancy Declines Mount
With the inflation rate still topping 9%, there is pressure for hosts to continue to increase ADRs to cover every growing cost of operating their short-term rentals. In June, ADRs increased by 4.5% year over year to $291 (+29.5% vs. 2019). This is comparable to the 4.7% increase in May but significantly less than double-digit increases from the first few months of the year. ADR grew the most in urban and coastal markets, where growth rates topped 9%. In mountain locations, where occupancy declines have been the greatest, ADRs increased by just 0.6% from the year prior.

At a market level, 11 of the 50 largest short-term rental markets saw a year-over-year decline in ADRs in June, with the largest declines in Big Bear, California (-24%), New Orleans (-7.5%), and Miami (-7.2%). Most markets are still seeing positive growth, with the biggest gains in Chicago, where ADRs were up 37.4% from the previous year.
Future Booking Pace: No Slowdown Ahead
As we look to Q3 2022, demand is pacing 11% higher than 2021 and 18.6% higher than 2019, with Q4 pacing slightly higher. Across all location types, demand continues to pace higher than last year's levels, and there are no signs of demand turning negative as we look at current booking pace. ADRs also continue to pace higher, with Q3 rates now 7% higher than at the same point last year.
While economic uncertainty is pervasive, almost all indicators point to positive gains for the hospitality industry and, specifically, for the short-term rental sector. STRs will continue to benefit from a return of international travel, an ever-growing supply base, and work-from-home policies that make it easy for more and more guests to live and work anywhere.
Watch to see our VP of Research, Jamie Lane, discuss key trends:

Mid-Year Outlook Report
See what's in store for US STRs in the coming months
Market Insights
Dig deeper and see what's happening in your market
European Trends
See what's happening across the pond
ARTICLE SUMMARY
U.S. short-term rental occupancy remained down from last year’s record highs in June 2022, though demand stayed strong (+16.3 YOY). The influx of new supply is pushing occupancies down particularly in destination and resort markets across the country.
Scott Sage
Senior Vice President, Marketing & Customer Experience
Scott is an Airbnb Superhost and industry pro, having founded Home Base BnBs—a short term rental management company that scaled to 200+ units. Scott combines his experience and passion for hosting to empower AirDNA customers' success. When he's not thinking about STRs, he is hiking, playing basketball, or playing pickleball.