Surging Demand Paves the Way for Record Airbnb Supply
Published: November 21, 2022
Last updated: October 11, 2024

Scott Sage
What you’ll learn in this article:
- How both total active and available listings now exceed pre-pandemic levels
- How the strength of supply growth has continued year over year for most countries
- How the different market types have balanced supply and demand
- How new investment and supply growth may slow in relation to market conditions
The growth of Airbnb listings and all forms of lodging came to an abrupt halt during the COVID-19 pandemic.
The period that followed set the stage for pent-up demand to spread to previously less-frequented destinations, which sequentially added new supply to service the new volume of travelers.
Some markets stood to benefit more than others from this pivotal moment as guests began to venture away from urban areas to less populous destinations. Now just over two years following the onset of the pandemic, the supply of active Airbnb rentals has never been higher, with just over 6.1 million listings in September 2022, surpassing the pre-pandemic period of September 2019 by 19.2%.
What counts as a relevant listing can vary, but for this analysis, the state of a listing is defined as one of the following:
Total Listings: Number of units that are listed on Airbnb in a period. This consists of all active listings and listings that have never been booked or available.
Active Listings: Number of listings viewable on Airbnb with at least one prior booked night.
Available Listings: Number of active listings that have calendar availability or at least one booked day in the month.
Booked Listings: The count of Airbnb units that had at least one booked day in the month.
The available listing count reflects the number of units actively competing for guests during the month. It can also show seasonal patterns, as some units are only available for rent during peak seasons and are unavailable during off-peak periods.
By looking at differences in active and available listings since the onset of COVID-19, we can better tell if hosts are just temporarily adjusting their availability while demand is low or permanently removing a property from the booking platform.
In both cases, these figures may overstate the loss of Airbnb’s supply, as owners could easily relist their properties once travel begins to pick up again. To isolate trends in the short-term rental sector, all figures exclude listings for hotels and hostels.

Stellar Supply Growth Across Major Global Markets Year Over Year
Global active Airbnb listings in Q3 2022 increased by 22.1% over the same period in 2019 (+17.5% vs. 2021). August and September of this year saw a downturn in active listings, which was related to Airbnb’s exit from China, but more on that later. For now, it’s important to note the tenure of listings on Airbnb’s platform. As it stood in September 2022, 54% of active listings on Airbnb have been added to the platform since 2020. With a majority of supply on the platform being added post-pandemic, this indicates that Airbnb has been able to expand listing inventory in markets that align with demand behavior.

Between Q3 2021 and Q3 2022, nine of Airbnb’s 10 largest countries grew their active Airbnb listings, with the exception of China. To account for the seasonality of short-term rentals, we are looking at listing counts from Q3 2022 and comparing them to both Q3 2021 and Q3 2019, allowing us to benchmark growth and recovery levels.
Spurring from operational difficulties magnified by the pandemic, Airbnb stated in May that it would exit the Chinese market on July 30, 2022. Listing counts in China were up 8.5% in July 2022 relative to the same month in 2019. Despite overall listing growth in the country, China’s three largest short-term rental markets (Shanghai, Beijing, and Chengdu) had been on the decline relative to 2019. In July 2022, Shanghai, Beijing, and Chengdu made up 14.7% of the total listings in the country. Together, these three markets in July had lost 31.5% of their supply since July 2019, while the rest of the country had actually amassed 20.7% more supply in the same period.
In Q3 2022, Australia was the eighth largest country in terms of active Airbnb units. The land down under grew active listings by 2.7% year over year in the third quarter, which, although positive, was the lowest growth level of the top 10 countries. Australia’s supply is, understandably, recovering slower than other countries whose borders reopened much sooner after the pandemic. Overall, the supply of active listings in the country sat at 6.3% below Q3 2019 levels in Q3 2022. Within Australia, 41.2% of units were concentrated in just three markets (Sydney, Melbourne, and Gold Coast) in Q3 2019. Collectively, these markets have lost 27.1% of their supply since 2019, compared to an increase in supply throughout the rest of Australia of 8.2% in the same comparison period.
Active unit counts have grown the most in Brazil (69.4% vs. 2019), where even the country’s largest markets have seen listing growth relative to 2019. Collectively, Rio de Janeiro, São Paulo, and Florianópolis made up 19.6% of the total active listings in the country in Q3 2022, and each had grown 10.0%, 41.4%, and 38.8%, respectively, since Q3 2019.
On par with other countries, the trend of strong listings growth outside of the largest markets holds true in Brazil as well. Relative to Q3 2019, Brazilian Airbnb supply in Q3 2022 had grown by 84.7% outside of Rio de Janeiro, São Paulo, and Florianópolis. Coastal towns such as Ubatuba, Praia Grande, and Grande Vitória, as well as inland cities like Olímpia, Goiânia, and Pirenópolis, have sustained the strongest supply growth as a derivative of greater guest visitation through the period.

Confining the analysis to a year-over-year comparison illustrates a contrast of recovery momentum supported by the world's largest short-term rental markets. Demand has begun to return to urban areas, bolstered by the easing of pandemic restrictions and some return of international travel. Though, there remains a divergence in performance between the world’s largest short-term rental markets.
U.S. Top Cities Lead the Recovery
First, let’s address the underperforming markets. Unsurprisingly, the largest losses in supply, out of the top 25 largest global short-term rental markets, were in the Chinese cities Beijing and Shanghai—as a result of Airbnb’s exit from the country. Even prior to exiting China, Airbnb was facing headwinds there from the implementation of strict short-term rental regulations and a dissolution of international travel to the country due to border closures.
Elsewhere, the likelihood of Airbnb supply recovering in Amsterdam appears bleak, despite recouping 42.3% more demand in Q3 year over year. Officials there have long been in opposition to vacation rentals. In July 2020, the Amsterdam city council instituted a ban on vacation rentals in three city center districts. Despite the ban being overturned by the Dutch capital’s administrative court less than a year later in March 2021, it’s likely the city council agenda will attempt to limit Airbnb supply through other means while it focuses on revamping tourism in the capital. The existing rule in Amsterdam states that hosts can only rent out their homes there for 30 days max per year unless they have a specific short-term stay permit.
The remainder of the largest global markets can be divided into two groups: one where supply declines could be considered temporary and the other where supply is already exhibiting strong growth.
The areas likely experiencing temporary declines have been heavily impacted by decreased international tourism. Australia and Japan each maintained international travel restrictions in the first half of 2022, with the former requiring proof of vaccination for entry until July 6th and the latter outright banning the entry of independent tourists until October 11th. Decreased visitation to Sydney and Tokyo has taken a toll on Airbnb supply in these markets but will likely recover as restrictions have eased. By removing the barriers to entry for many tourists, these cities could conceivably reclaim supply in line with increased demand.
The strongest growth in active listings was in the United States, where domestic travel has been robust and urban areas continue to recover. Orlando, Florida, Austin, Texas, and Miami saw the greatest year-over-year climbs in active units of the top 25 largest global markets in Q3 2022. In terms of available listings, Austin led the change over last year, followed by Toronto and Madrid.
Occupancy Falls Where Supply Growth Supersedes Demand
Following the pandemic, demand had shifted away from urban markets as guests began venturing to small cities, rural areas, and destination/resort areas en masse. These markets gained the greatest number of available listings as short-term rental investors capitalized on the economic opportunity to service unmet demand. As supply has risen, however, many hosts are coming to find themselves in a saturated market. Occupancy levels, as a function of supply and demand, have fallen in areas where the growth in the number of nights available has surpassed the growth in number of nights reserved.
In Q3 of 2022, year-over-year supply growth was greater than demand growth in all U.S. location types except coastal resorts, which explains the widespread decline in occupancy levels that many operators have been feeling. However, at the market level, there are some divergences from this pattern.
Mountain destinations, specifically where the cost of entry is high—ski resorts, for example— have been slow to add available listings year over year, and occupancy rates have increased in response to unrelenting demand. Telluride, Colorado, saw 29.7% higher occupancy in Q3 year over year, which was the highest growth in the period. The Colorado mountain town had experienced an available supply increase of just 12.3% vs. Q3 last year, while demand grew by a huge 64.5%. The market that saw the second-highest growth in occupancy was Aspen/Snowmass (19.7%), also in Colorado, which also saw supply increase by 12.3%, but demand had risen by 37.0%. Increases in occupancy were seen in other Colorado mountain destinations, such as Vail/Avon (12.5%) and Breckenridge (11.8%), which experienced similar trends in greater demand growth over supply growth.
The highest growth in occupancy levels among coastal destinations was found in Destin/Fort Walton Beach, Florida (13.7%), South Padre Island, Texas (11.2%), and the Outer Banks, North Carolina (9.8%). Similar to the mountain towns, these coastal markets tend to be top-tier priced and geographically supply-constrained. Destin/Fort Walton Beach saw supply grow by 21.4% year over year in Q3, while demand rose by 48.4%. South Padre Island grew available listings by 21.8% and demand by 39.2%. Available listings in the Outer Banks grew by 29.8%, and demand gained 48.1%.

Airbnb Churn Softens When Removing China From the Equation
The rapid addition of units being added to Airbnb begs the question of how much of this supply is being retained by the platform. Taking the difference between churn and the three-month moving average of new listings, we arrive at Airbnb’s quarterly net change in listings. In Q3 2019, Airbnb averaged a net change of roughly +116,000 (+2.3%) listings per month, however, in Q3 2022, the platform’s average monthly net change in listings was roughly +61,000 (+1.0%). This means that despite adding over 250,000 (38.3%) more new units on the platform in Q3 2022 than in Q3 2019, the growth rate in Q3 2022 was less than half of what it was in Q3 2019.
The reason for this lower growth rate is churn as Airbnb left China. Declines steepened in August and continued in September following Airbnb’s decision to leave China on July 30th. In July 2022, China was Airbnb’s fourth largest country in terms of active supply, with over 330,000 listings (behind the United States, France, and Italy), so withdrawal from China had a dramatic effect on global totals.
In order to visualize a more accurate assessment of global Airbnb supply, we must account for Airbnb’s exit from China by removing the country from the churn calculation altogether. After excluding China from the analysis, we can see that the churn rates in August and September are far less dramatic.
When including China in the global Airbnb churn calculation, there were more than 330,000 listings that left the platform in the month, however, this number is reduced to roughly 185,000 when removing China from the equation. And while new listings remained flat at 270,000 (as no new listings were added in China), the net change in listings was positive when removing China from the calculation, with an 80,000 listing gain in September. When including China, Airbnb was showing a loss of over 30,000 listings in the period. In essence this means that in September 2022, Airbnb’s churn rate was 3% on a three-month moving average basis when excluding China, which aligns with historical seasonality patterns.

New Investment May Slow with Greater Barriers to Entry
In September 2022, there were 70,000 new short-term rentals added in the U.S., which, although down from 75,000 in August, allowed available listings to reach an all-time high of 1.38 million. Given the impressive increase in short-term rental returns, it’s no surprise that real estate investors accelerated their additions to supply in the beginning of 2022. However, moving forward, we expect short-term rental growth to be hampered as investors weigh market conditions.

The cost of buying a home has risen dramatically, with home prices pushing 14% higher in the past year and rising interest rates—up from 2.8% to 6.1% at the end of September 2022. We estimate that the new average 30-year fixed mortgage payment for higher-end homes has risen by 66% since last September.
While the cost of buying a home has risen, short-term rental revenues have remained stagnant in the past year. The expected premium (monthly expected STR revenue/average monthly mortgage cost) for acquiring a short-term rental investment has fallen from over 80% at its peak last summer to just 17.9% as of September 2022. This is the lowest level the expected premium has been in the last four years, functionally below profitability after accounting for the average property management fee. These conditions are expected to continue into 2023, which could slow the rate of supply growth moving forward.
The short-term rental industry has the luxury of being able to dynamically shift supply rather quickly in accordance with demand, unlike other forms of lodging. However, a flood of new supply in a market is not always indicative of future demand, let alone profitability, as market conditions and consumer preferences can change in short order. Vacation rental managers will need to be especially diligent to find profitable markets and properties while establishing nightly rates in tune with the current environment.
Occupancy Gap Tightening in the U.S.
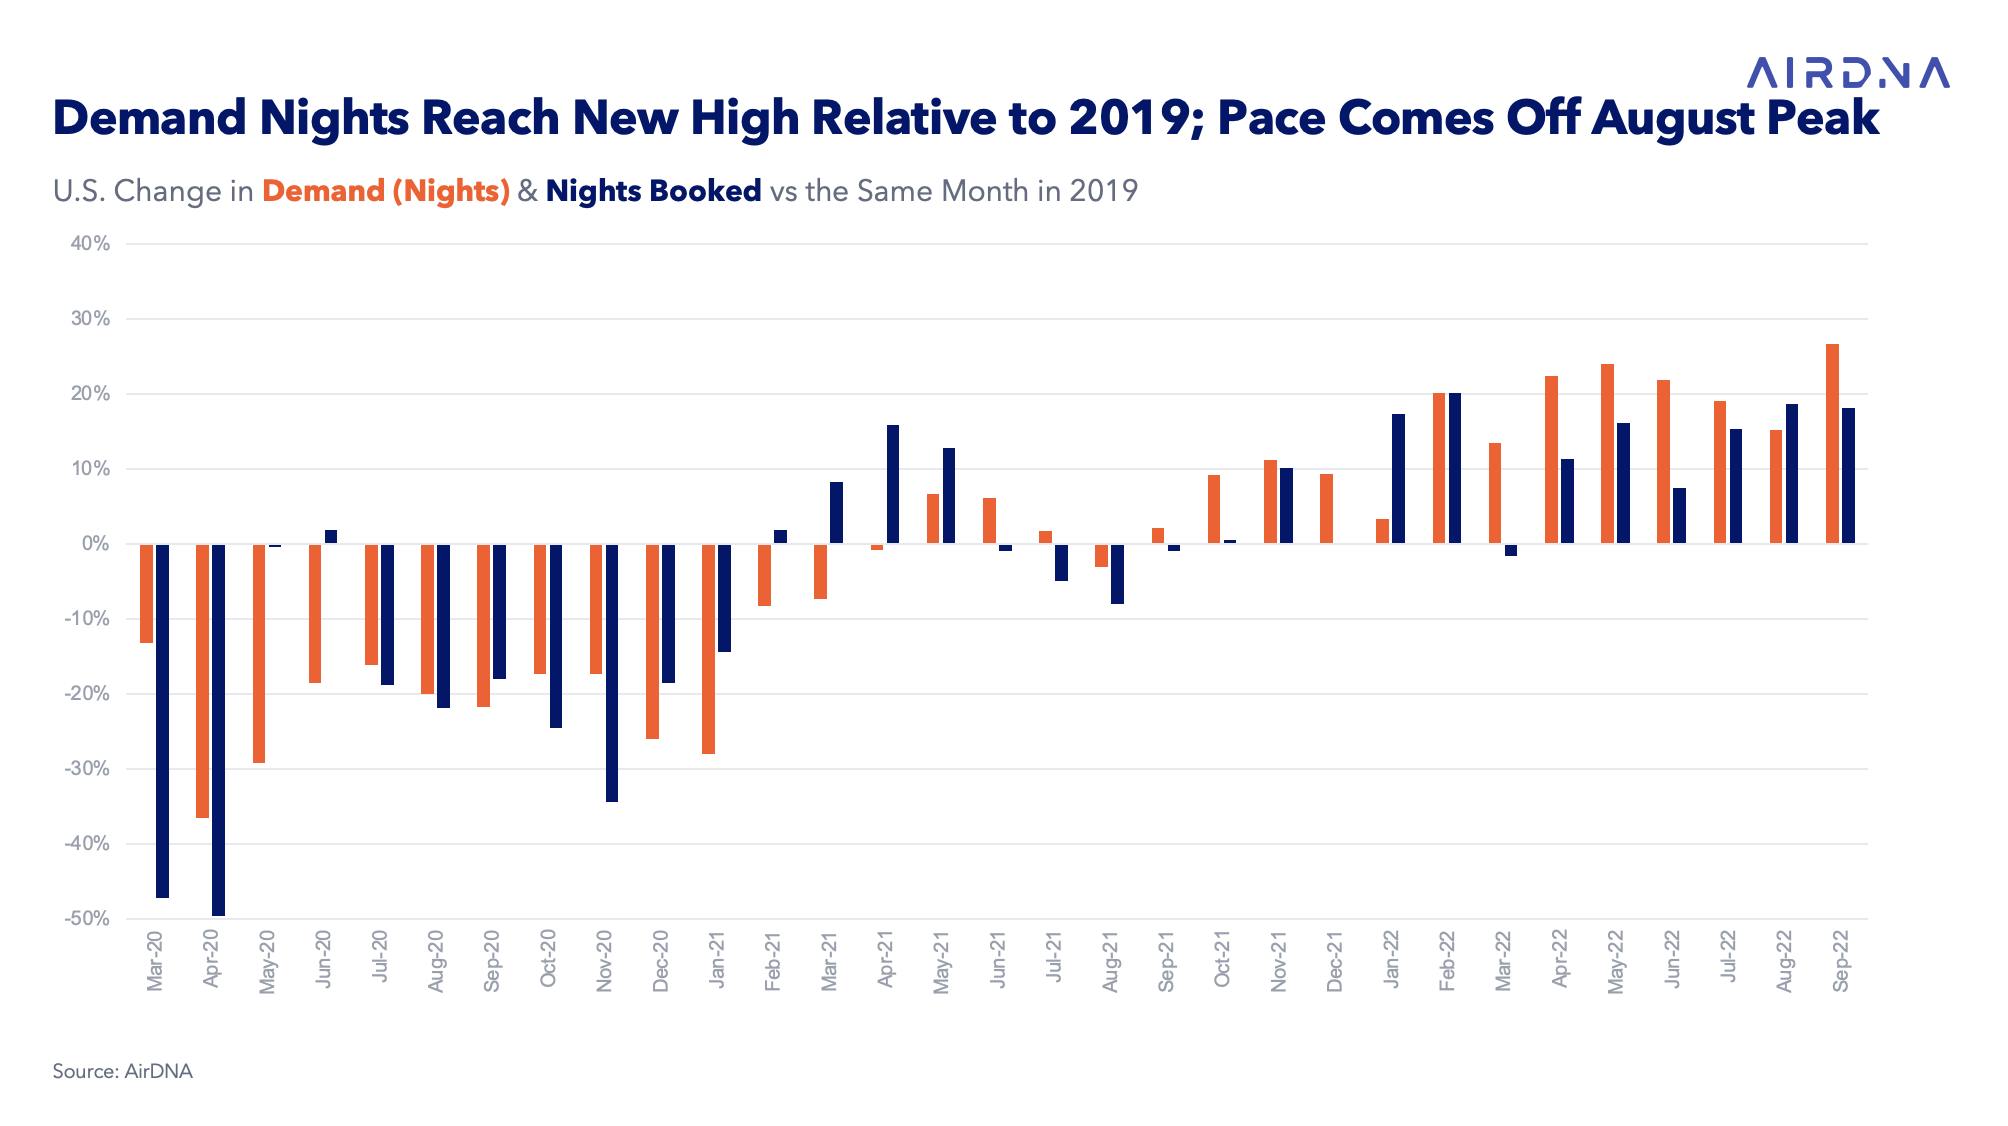
AirDNA’s latest market review shows another record month for short-term rental demand in the U.S., with 26.6% more nights stayed than the same month in 2019.

Dive into the Data
See supply, demand, occupancy, average rates and more for your market in our MarketMinder™ tool

Competition Heats Up Between Hotels and Rentals
Read our joint report with hotel data company STR to see how the hotel and rental sectors merged in the pandemic up to now.
ARTICLE SUMMARY
Airbnb supply is flexible by nature and has grown rapidly since 2020, reaching a record 6.1 million active listings in September, up 22% from 2019. Of the top 10 countries, Brazil has seen the highest increase in active listings since 2019 (+69.4%), while China is the only country that has not seen growth year-over-year following Airbnb’s announcement to leave operations in the country in May 2022.
Scott Sage
Senior Vice President, Marketing & Customer Experience
Scott is an Airbnb Superhost and industry pro, having founded Home Base BnBs—a short term rental management company that scaled to 200+ units. Scott combines his experience and passion for hosting to empower AirDNA customers' success. When he's not thinking about STRs, he is hiking, playing basketball, or playing pickleball.