


Maureen Morgenthien
Director of Marketing, Punta Gorda/Englewood Beach
“Short-term vacation rentals can be an invisible market. AirDNA really provided 100% more understanding of our market.”

Track booked nights, measure event impact, and see future demand with accurate data on every Airbnb, Vrbo, and Booking.com listing in your destination.
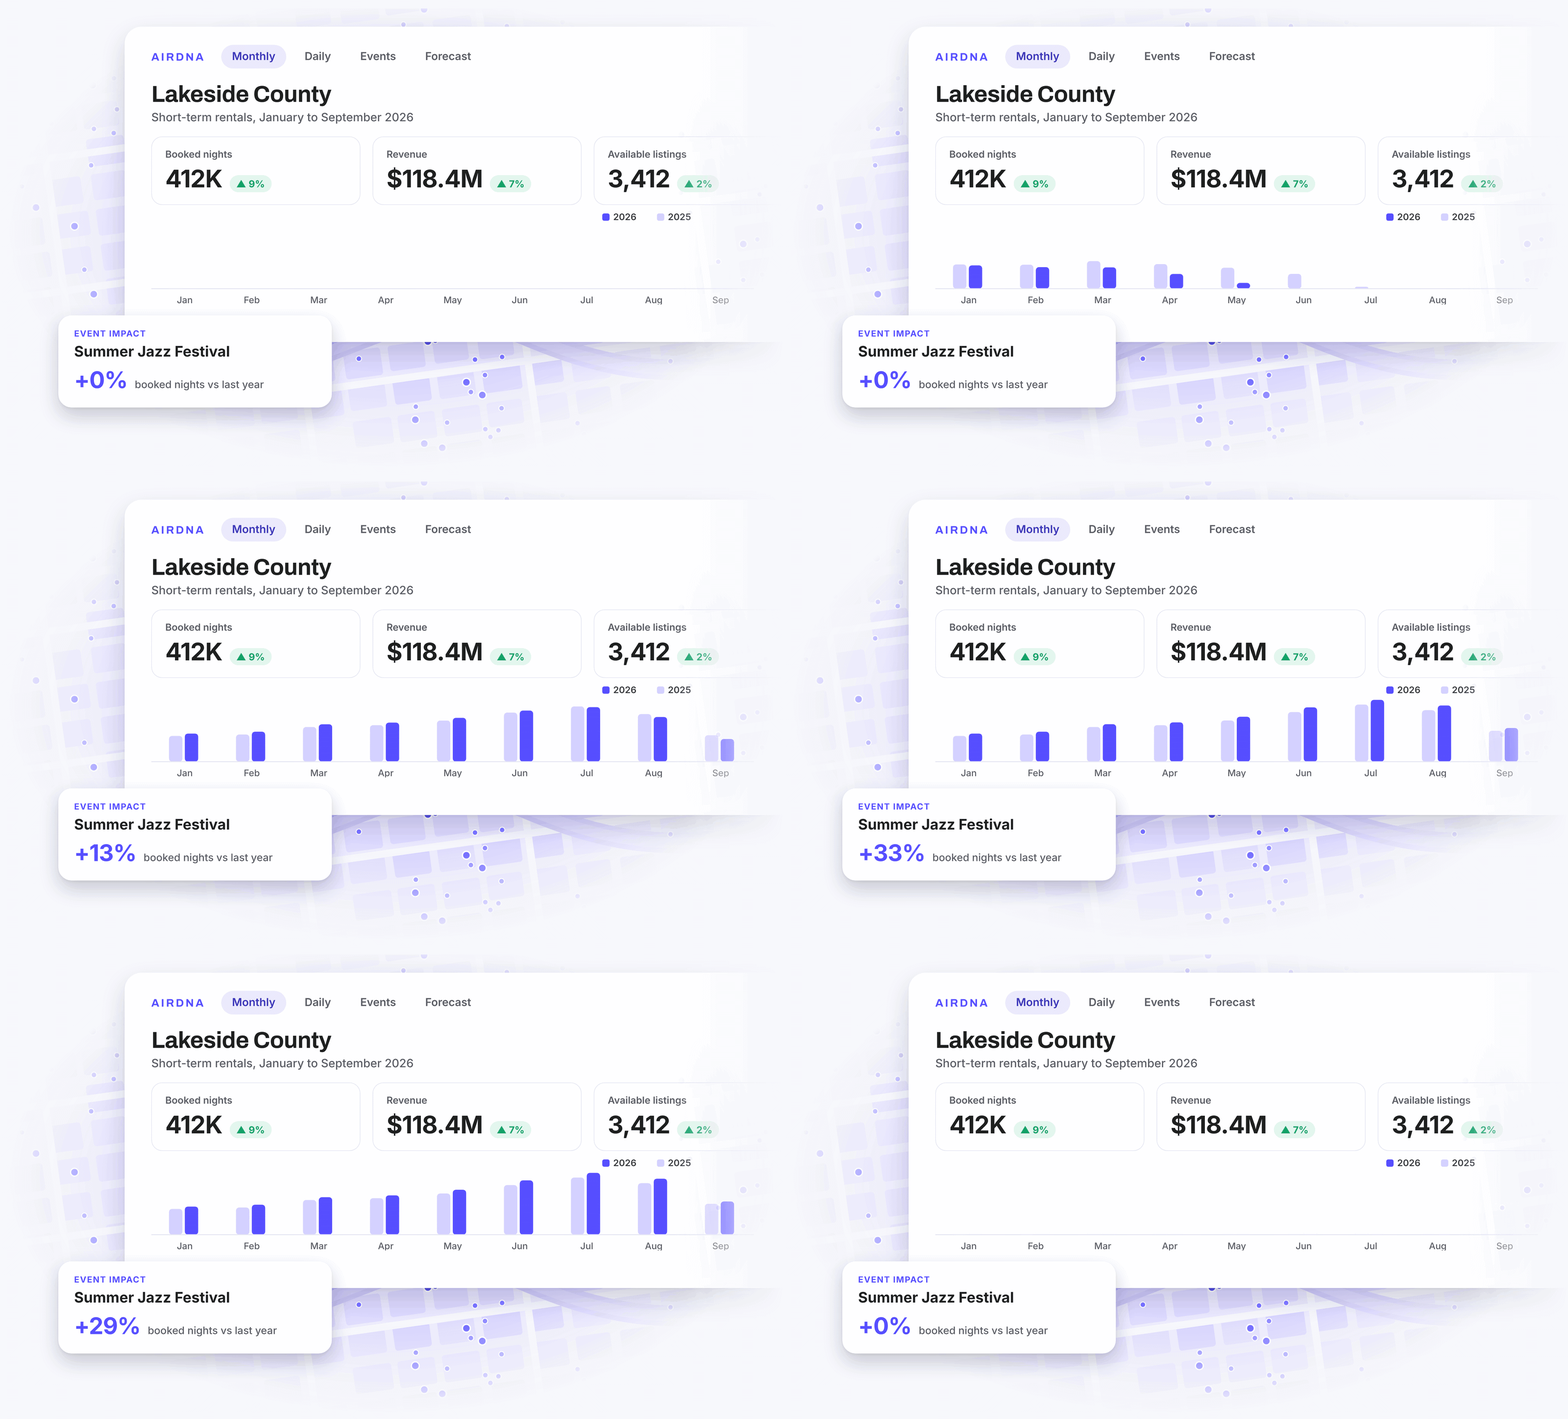
Tourism Insights is our DMO dashboard, built around the metrics and decisions that matter to you, with the most accurate data on your whole market.
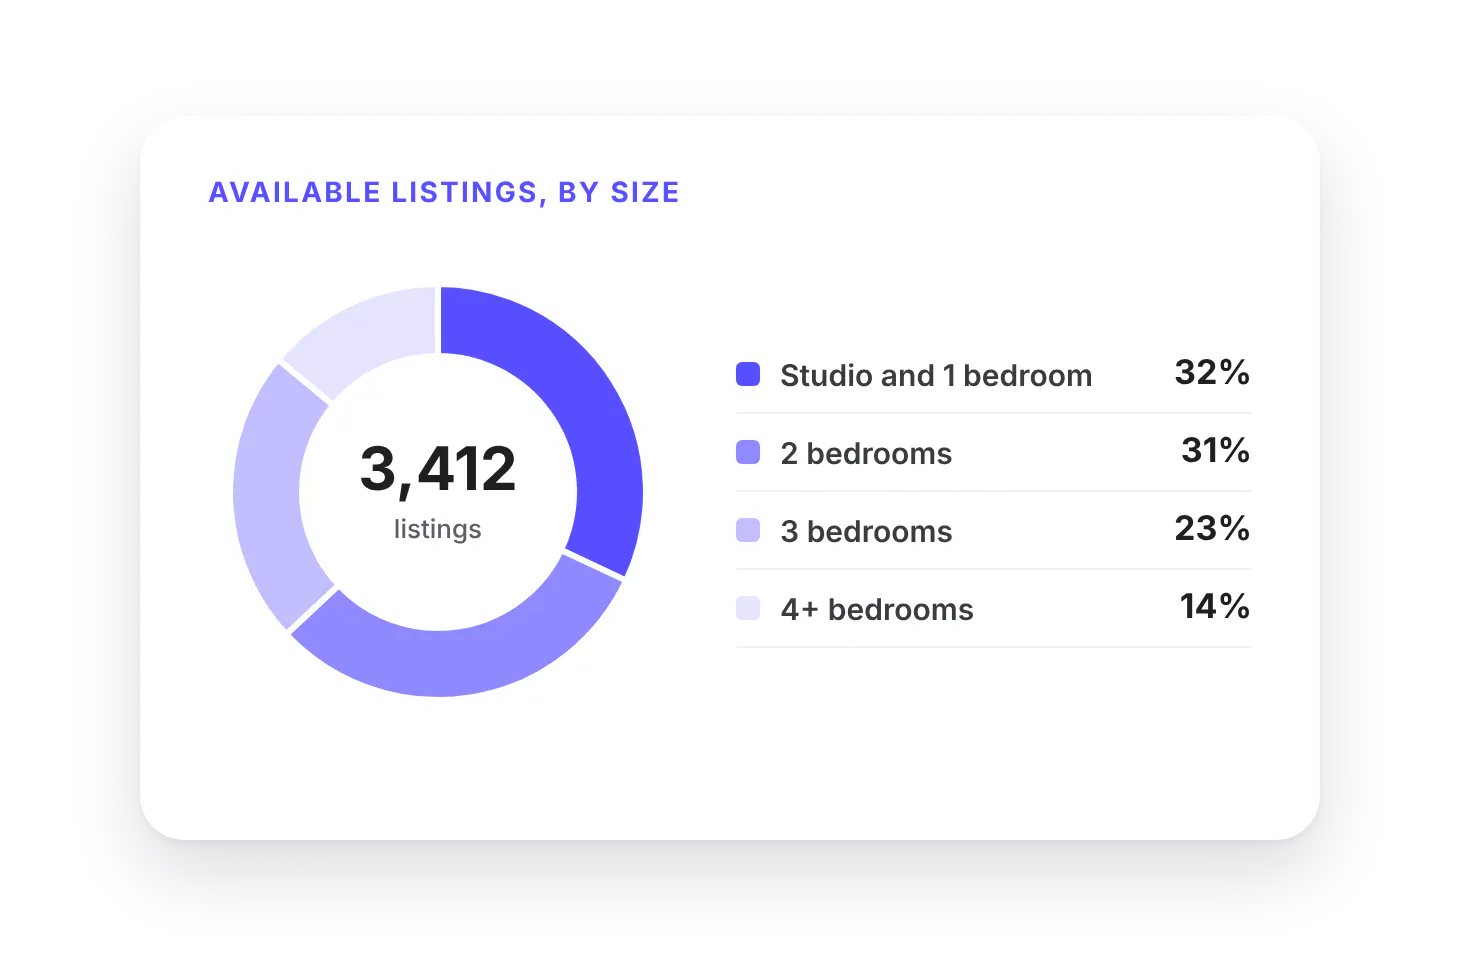
If you only count hotels, you’re missing beds. See every short-term rental, from big property managers to one-home hosts, for a true picture of your market.
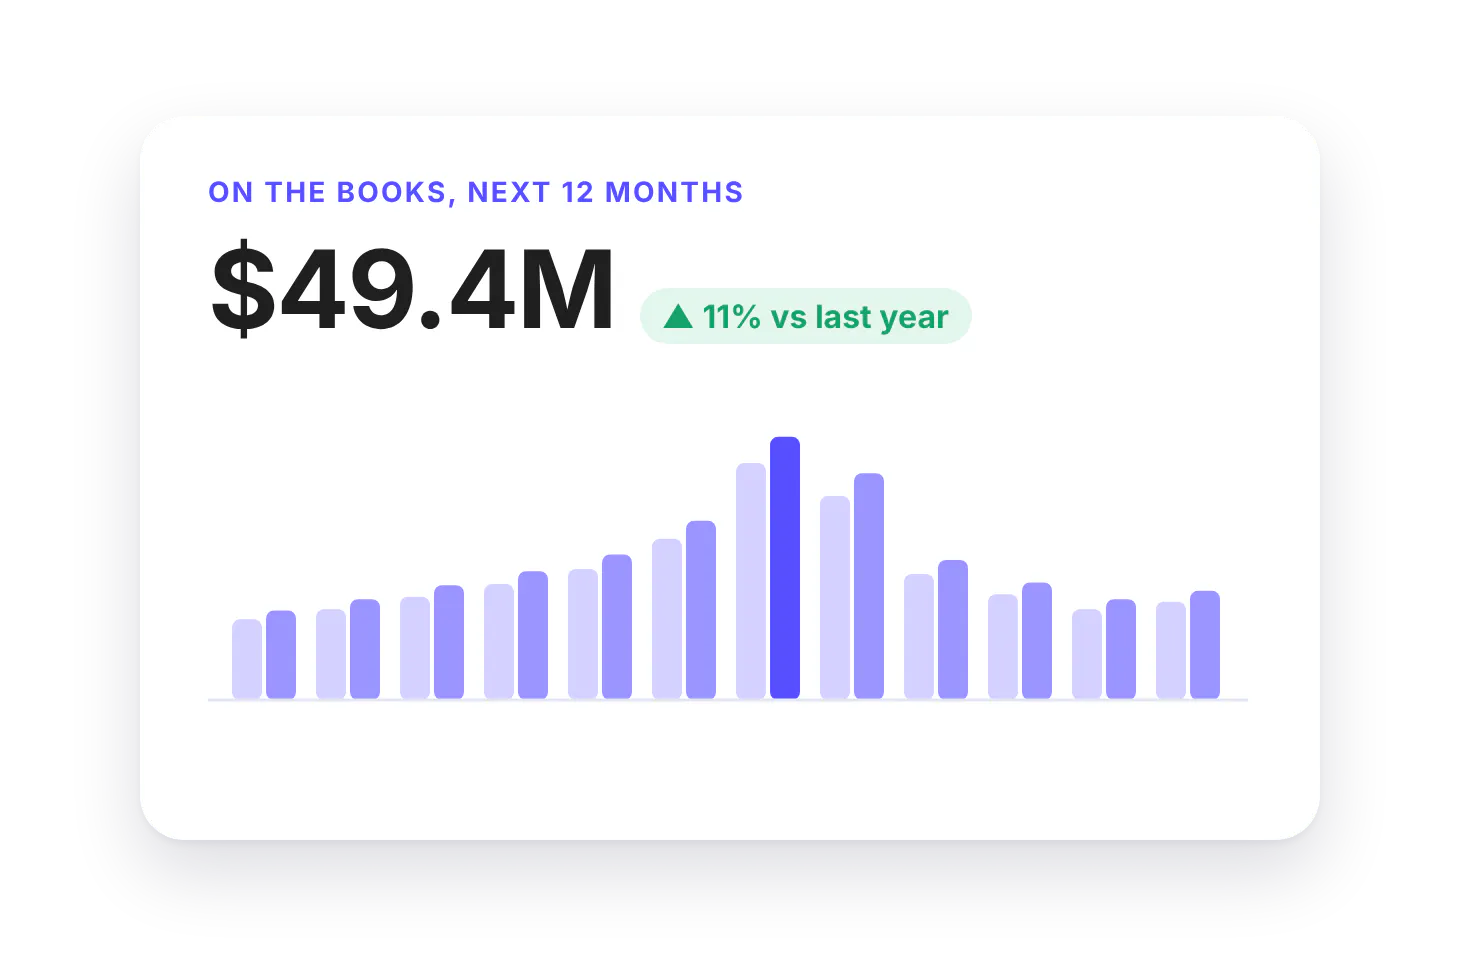
See up to 12 months of future bookings, and how far ahead visitors book, so you can time your marketing to land right when visitors are planning their trips.
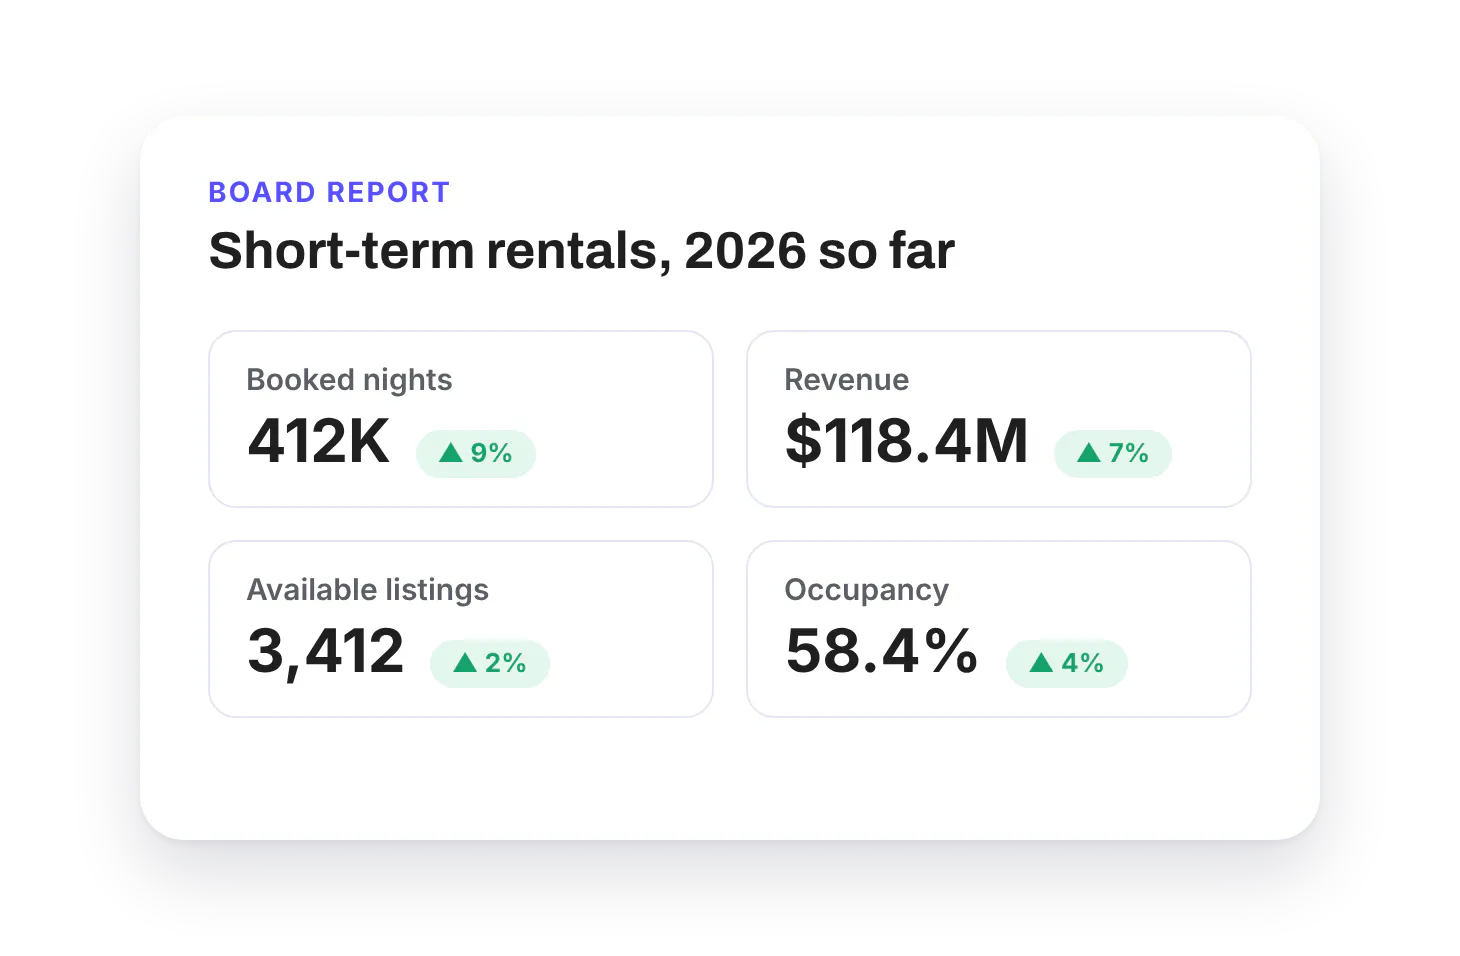
Our data lands within 95–97% of Airbnb’s own results. Make the big calls on budgets, policy, and funding, and back them up with board-ready reports.
Your market doesn’t have to follow city or county lines. We’ll set it up to match exactly the area you’re responsible for, then break it into submarkets, like a tax district or the streets around a venue.
Go back to 2016 for long-term trends, or day by day to find which weeknights, weekends, and seasons fill up. Track booked nights, revenue, nightly rates, length of stay, and booking lead time.
Check what’s booked for up to 12 months ahead, and compare it with how many bookings you had for the same dates at this point last year. You’ll know early if a month is running ahead or behind, so you can plan campaigns and set timelines in time.
Measure how a festival, game, or conference moved booked nights and revenue, day by day. Compare it with last year’s event, or with other events in your area, then use the numbers to plan next year, shape your marketing, and make the case for funding.
Compare up to 25 destinations, from neighboring counties to whole states, across three years. Find out where you’re ahead, where you’re behind, and what other markets are doing well.
Set up tailored reports with the destinations and metrics you choose, then send them to yourself, your team, or your stakeholders in one click. Need more detail? Download any chart, dashboard page, or the raw data as a CSV.
Your market doesn’t have to follow city or county lines. We’ll set it up to match exactly the area you’re responsible for, then break it into submarkets, like a tax district or the streets around a venue.

Board and council reporting
Hotels alone don’t tell the whole story. Show booked nights, revenue, and nightly rates for every short-term rental, with trends back to 2016, ready for your next board meeting.

Lodging tax
See rental revenue already on the books up to 12 months ahead, and budget for the tax it brings in. Check it against what you receive, or make the case for taxing rentals.

Campaign planning
Booking lead time shows when visitors book. Length of stay and bedroom count show who they are. Pair it with pacing to see if a month needs a push.

Events
Show organizers and funders what last year’s event brought in. Compare it with previous years or other events in your area, and track how this year’s bookings are pacing so you can time your campaigns.

Benchmarking
Find out whether it’s just your market or the whole region that’s growing, and report your results in context.

Seasonality
Find the shoulder weeks with room to grow, then track bookings week by week, so you can see what’s working and move quickly when a month falls behind.
Director of Marketing, Punta Gorda/Englewood Beach
“Short-term vacation rentals can be an invisible market. AirDNA really provided 100% more understanding of our market.”
15M+
Listings checked daily
120K+
Global markets covered
97%
Accuracy vs. Airbnb’s results
10
Years of historic data
WHY 400+ DMOS TRUST OUR DATA
Not all short-term rental data is created equal. Some providers rely on data from their partner property managers. It’s precise for their homes, but it’s a small sample, so they try to fill the gaps with a quick scrape of booking sites. Crucially, it’s not the same scrape as ours.
We start from every listing on Airbnb, Vrbo, and Booking.com, because that’s the only way to cover your whole market. Then we do the technical work a quick scrape skips: matching homes across sites, taking out booking-site fees, and separating real bookings from blocked nights. Finally, we check our numbers against real reservations.
That’s why our data lands within 95–97% of Airbnb’s own reported results.
Book a demo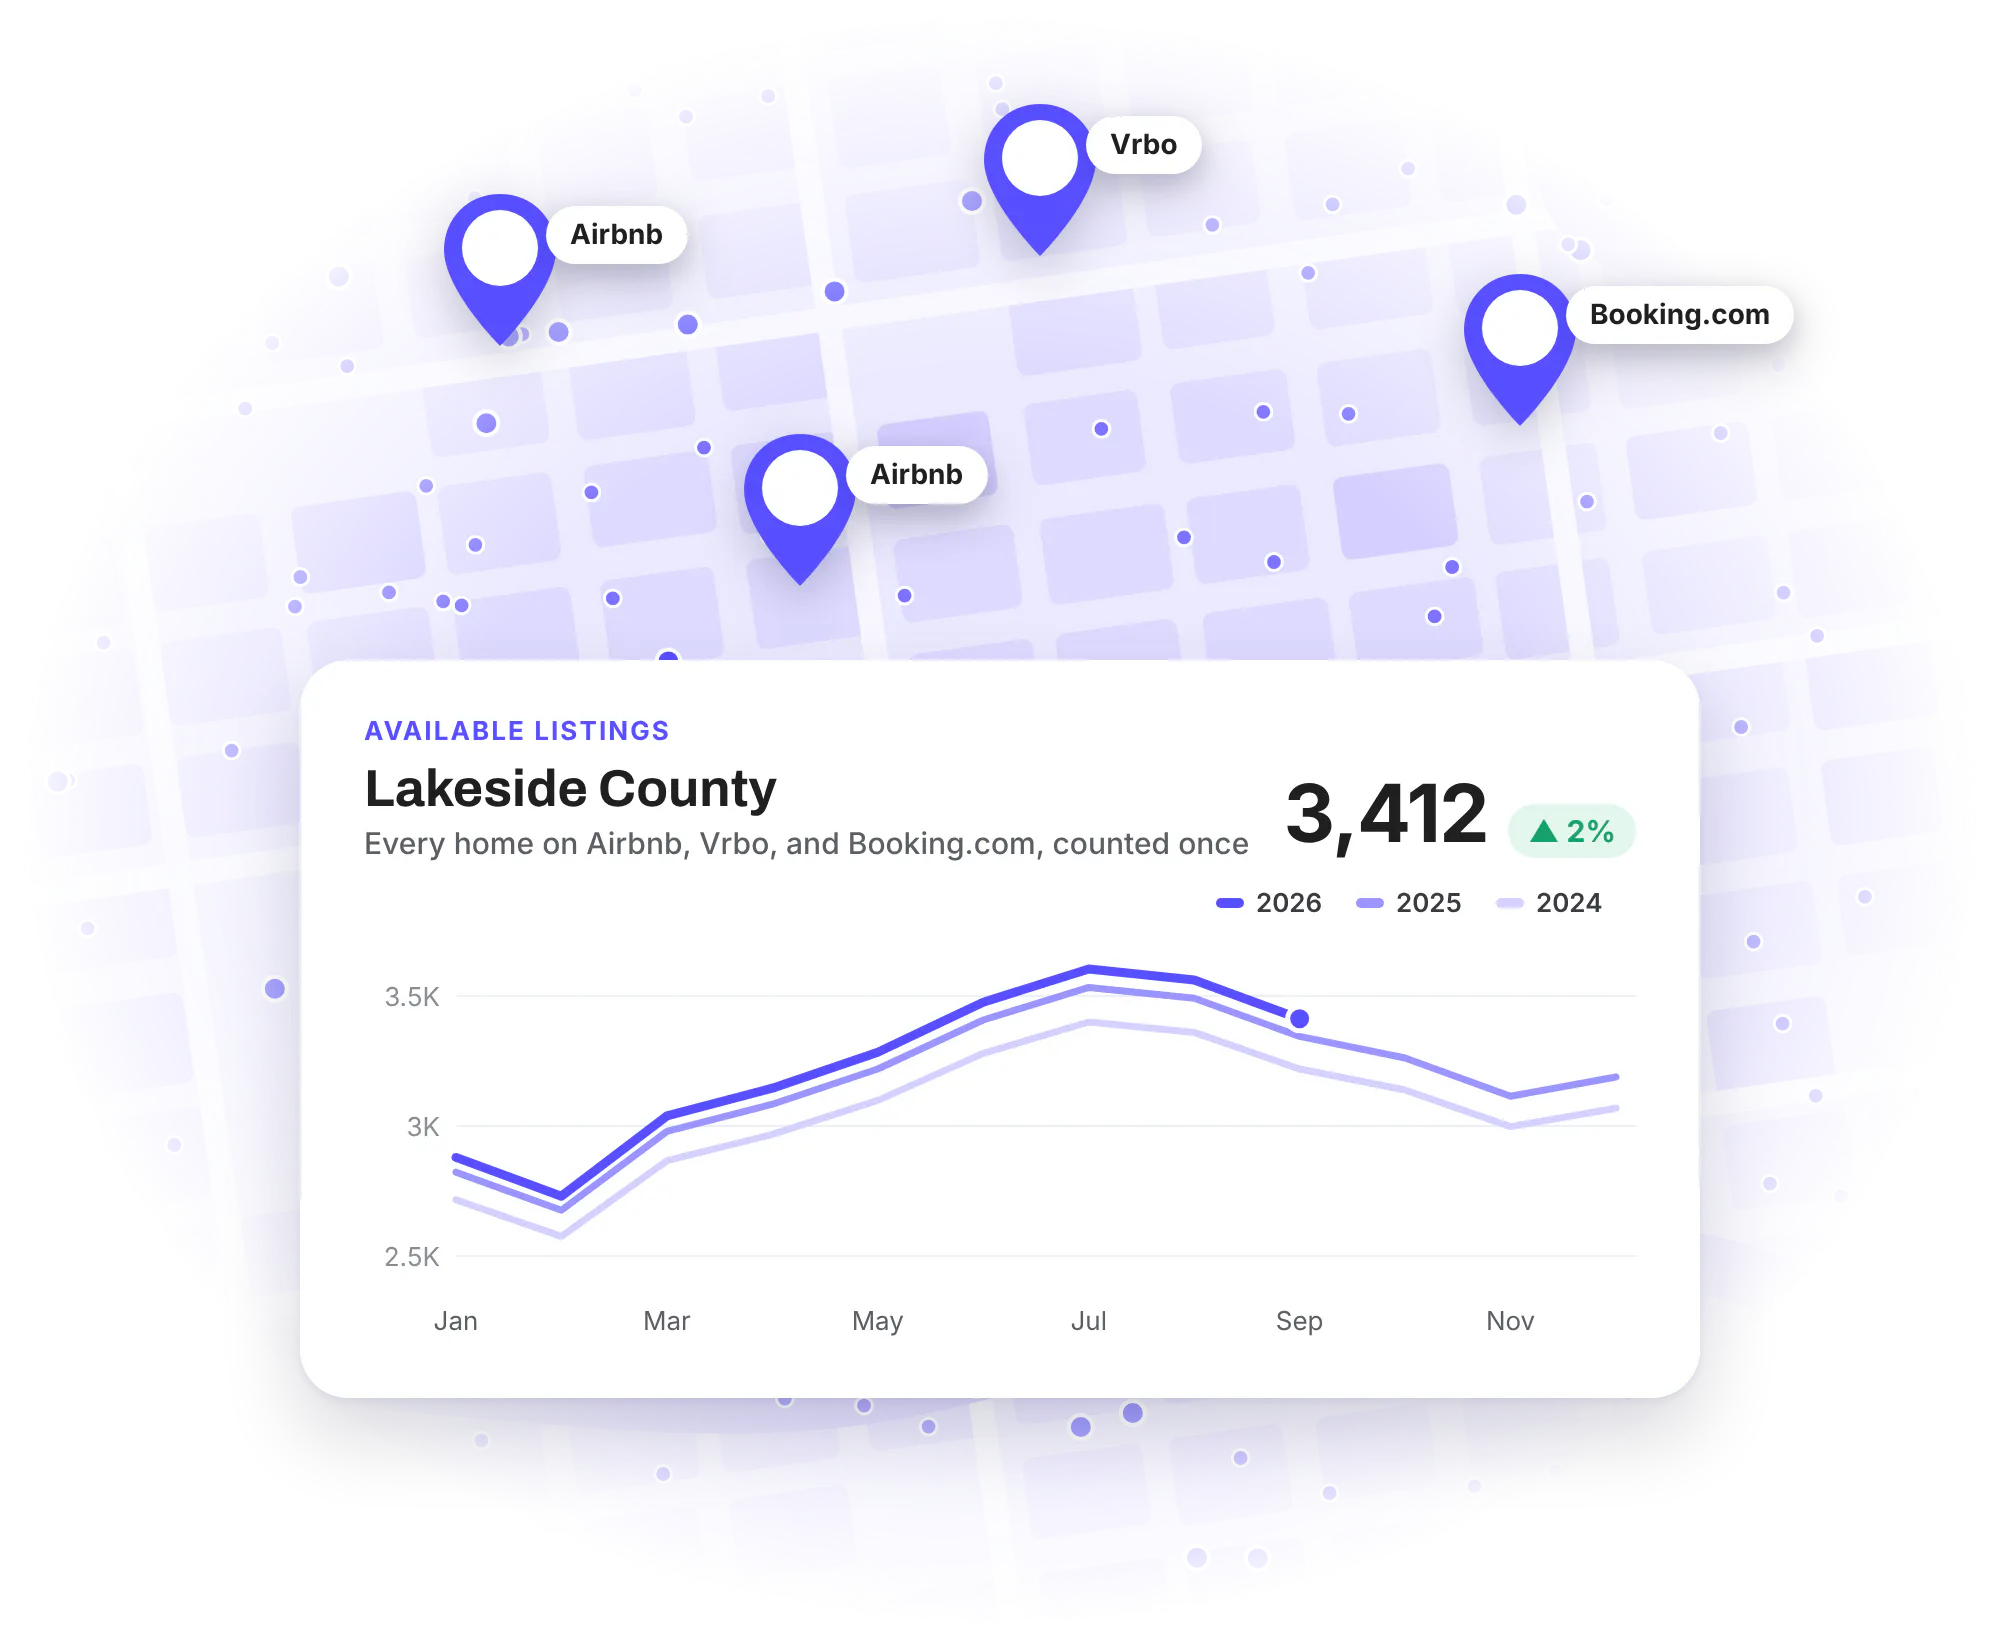
Accuracy you can check
We built our methodology around accuracy, and it’s why we have the most complete short-term rental dataset. Here’s where that makes the biggest difference.

Coverage
Vs. property manager data: accurate, but only for the small part of your market they manage.

Small towns and rural areas
Vs. property manager data: only as good as their partners in your area, so small towns and rural areas often have little or no real data.

Year over year
Vs. property manager data: partners come and go, so this year and last year aren’t measuring the same homes.

Booked vs. blocked nights
Vs. a quick scrape: blocked nights can be counted as booked, so occupancy looks higher than it is.

Homes on several sites
Vs. a quick scrape: the same home on several sites can be counted more than once, inflating the numbers.

Booking-site fees
Vs. a quick scrape: booking fees left in make revenue look higher than it is.
HOTEL DATA IN PARTNERSHIP WITH KALIBRI
Short-term rentals are only part of your lodging market. Add hotel data from our partner Kalibri, and see hotels and rentals in the same Tourism Insights dashboard, for the same destinations you already track.
Kalibri’s data comes straight from the booking systems of 35,000+ US hotels, across 100+ brands and every chain scale, from economy to luxury. It’s reservation-level, so you see more than totals: how long guests stay, how far ahead they book, which channels they use, and whether they’re traveling for business, leisure, or a group event like a conference or wedding.
Book a demo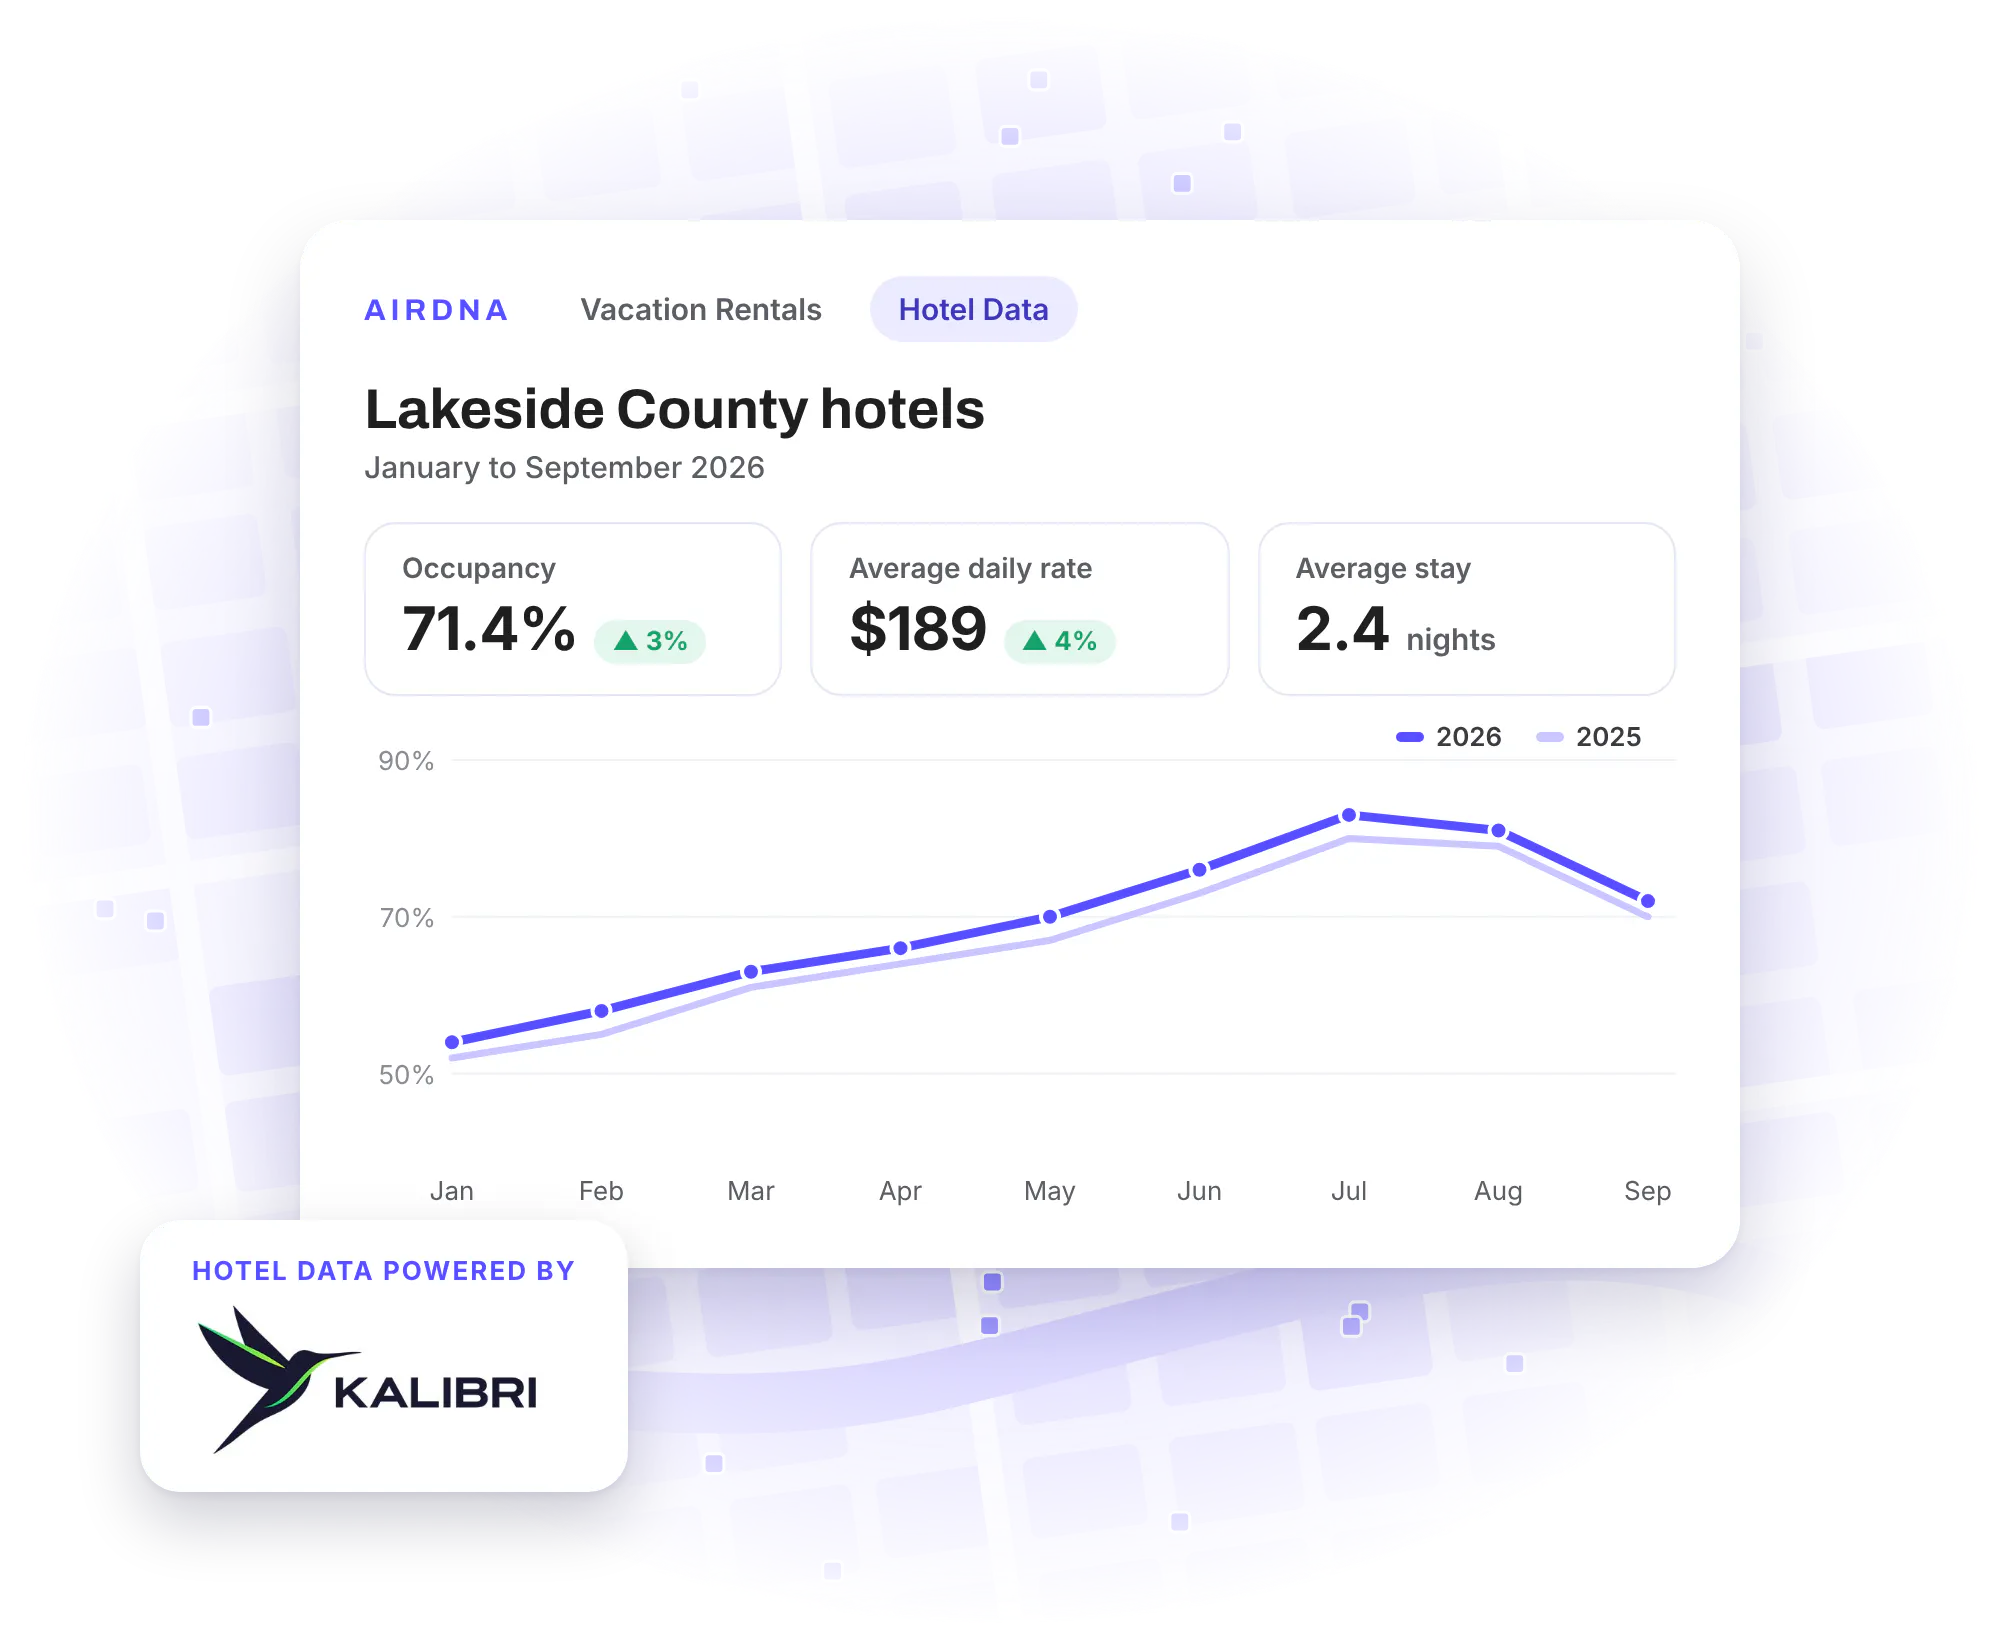
Our free monthly newsletter for DMOs across the US and Canada. Every issue includes:
By subscribing, you agree to receive The Destination Brief from AirDNA. Unsubscribe anytime. See our privacy policy.
We’ll walk you through real data from your destination.
AirDNA collects every listing on Airbnb, Vrbo, and Booking.com, every day, to build a true picture of your market. That’s 15 million listings, with their calendars, rates, and property details, back to 2016. Because we cover every listing, our data is as accurate in a rural county as in a capital city, anywhere in the world.
Then we clean the data with a model we’ve spent 10 years improving:
We check our work every week against real reservations from property managers, and every quarter against Airbnb’s own results, where we land within 95–97%.
Very, and we can prove it. Every quarter, we compare our numbers with Airbnb’s own reported results, and ours land within 95–97%.
Because we start from every listing, we’re not stretching a small sample’s trends across your whole market, or patching big gaps with data from somewhere else. What you see is what’s actually happening in your destination.
Spot a number you don’t understand? Our team of data scientists and economists would love to talk it through. Really.
AirDNA sees more of your market than other providers, and we do more to make sure those numbers are right.
Some providers collect data from the property managers they partner with. It’s precise for those homes, but it’s only a small part of your market, and independent hosts aren’t in it. Coverage depends on where they have partners, so small towns and rural areas often have little or no real data. To fill the gaps, they add a quick scrape of booking sites.
We start with every listing on Airbnb, Vrbo, and Booking.com. Then we do the technical work a quick scrape skips: matching homes across sites, taking out booking-site fees, and separating real bookings from blocked nights. Finally, we check our numbers against real reservations from property managers, and every quarter against Airbnb’s own reported results, where we land within 95–97%.
No, AirDNA data is just as accurate in a county with 20 listings as in a big city. That’s because we track every listing on Airbnb, Vrbo, and Booking.com in your area, and our model learns your destination’s own seasons and guest habits.
Providers that rely on partner property managers often have few or no partners in rural areas, so they have little real data on your destination to work with, and their accuracy suffers.
Yes, AirDNA’s data includes direct bookings. When a guest books on a property manager’s own website (or anywhere else), the host’s calendar closes on Airbnb, Vrbo, and Booking.com too, so the dates don’t get double-booked. We see that change and capture the booking, even though it wasn’t made on a booking site.
Yes, AirDNA’s pacing shows bookings already on the books up to 12 months ahead: six months in the monthly view, and 12 in the daily view.
Pacing lets you compare this year’s bookings with previous years. If you’re looking at a weekend three months out, we compare what’s booked for it today with what was booked for the same weekend at this point last year, not with last year’s final total. We even add back cancellations, so you’re comparing like with like.
It’s fiddly work, and not every provider bothers. But you’re building strategy on these numbers, so accuracy matters.
Absolutely. Tourism Insights is built for DMOs, and teams use it for everything from board reports to economic impact studies and funding applications.
Every metric has a clear definition, so you can explain what a figure means and where it comes from. Set up tailored reports, weekly or monthly, and send them to your board and stakeholders in one click.
Yes, you can add hotel data to your Tourism Insights dashboard. We partner with Kalibri, whose data comes straight from the booking systems of 35,000+ US hotels, across 100+ brands and every chain scale. It’s reservation-level, so you see more than totals, like how long guests stay, how far ahead they book, and which channels they use. Your comparison destinations carry over, too.
AirDNA works with 400+ DMOs of every size, from national and state tourism boards, convention and visitors bureaus, and regional tourism organizations to local governments and rural counties with a team of one. Send us your boundaries, whether that’s a whole state, a county, a city, or a single town, and we’ll set up your data around them, submarkets included.
No, and we’d be suspicious of anyone who says they can. Booking sites don’t share where guests travel from, so any visitor-origin number built on listing data is a guess.
What AirDNA can show is how your guests behave: how far ahead they book, how long they stay, what events they come for, and what size home they choose. That tells you a lot about who’s visiting.
AirDNA’s pricing depends on your destination. It’s based on how many listings you have and what you need, like daily data, events, or hotel data. We build every package around your goals and your budget. For a quote, book a demo and our team will walk you through the options for your destination.