


Data trusted by


Price confidently with market data
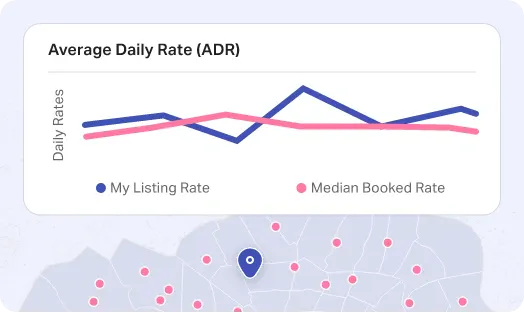
- Compare your rates with relevant successful properties.
- Understand seasonal pricing trends.
- Know when to adjust your prices based on when guests are booking.
- See what amenities command higher rates with customizable comp sets.
- Optimize your nightly rates.
Make smart growth decisions
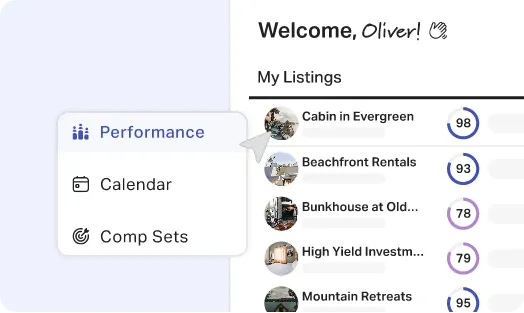
- Identify your best-performing properties.
- Learn what drives booking success in your market.
- Use data to justify your pricing to stakeholders.
- Make proactive hosting decisions based on future trends.
Turn your benchmarks into better prices with Adapt
Your benchmarks show where you're leaving money on the table. AirDNA Adapt uses dynamic pricing to close the gap.
- Dynamic nightly rates: Adapt adjusts your prices as demand in your market shifts.
- Built on AirDNA data: recommendations use the market data hosts already trust for benchmarking.
- Strategies that fit your goals: choose Premium Hold, Steady Earner, Volume Builder or Smart Yield.
- Automatic price sync: push rates to Airbnb, Guesty, Hostaway, Hospitable, OwnerRez and Uplisting.
- Simple pricing: $20 per listing per month after a 30-day free trial.
Features that help you succeed

Insights from your competition
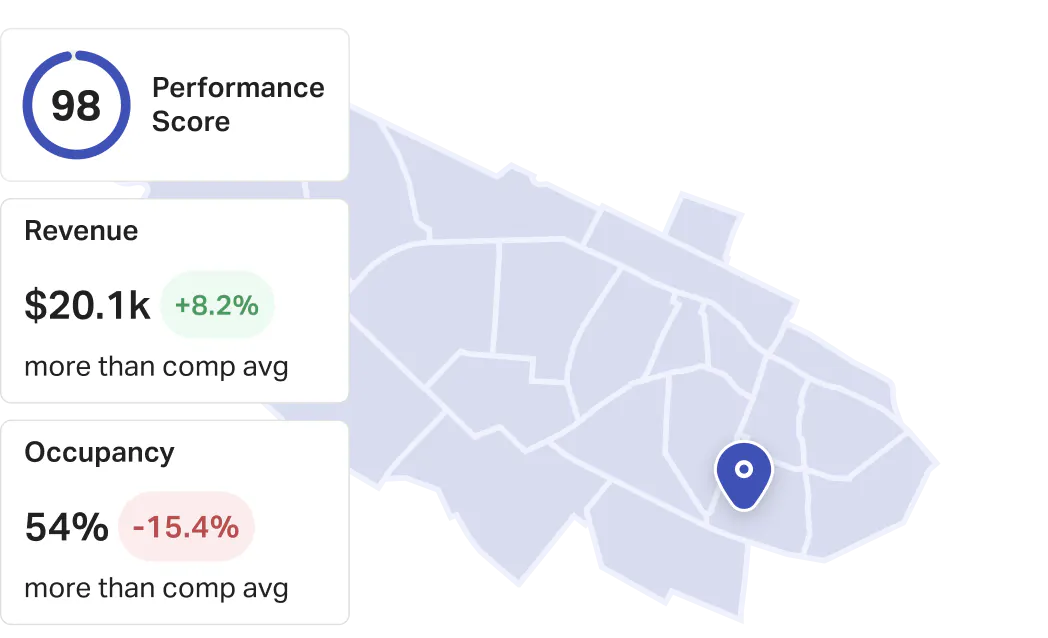
See how your occupancy rates and pricing compare to similar properties in your area. We'll highlight quick wins to help you surpass competitors.

Recommended Rates
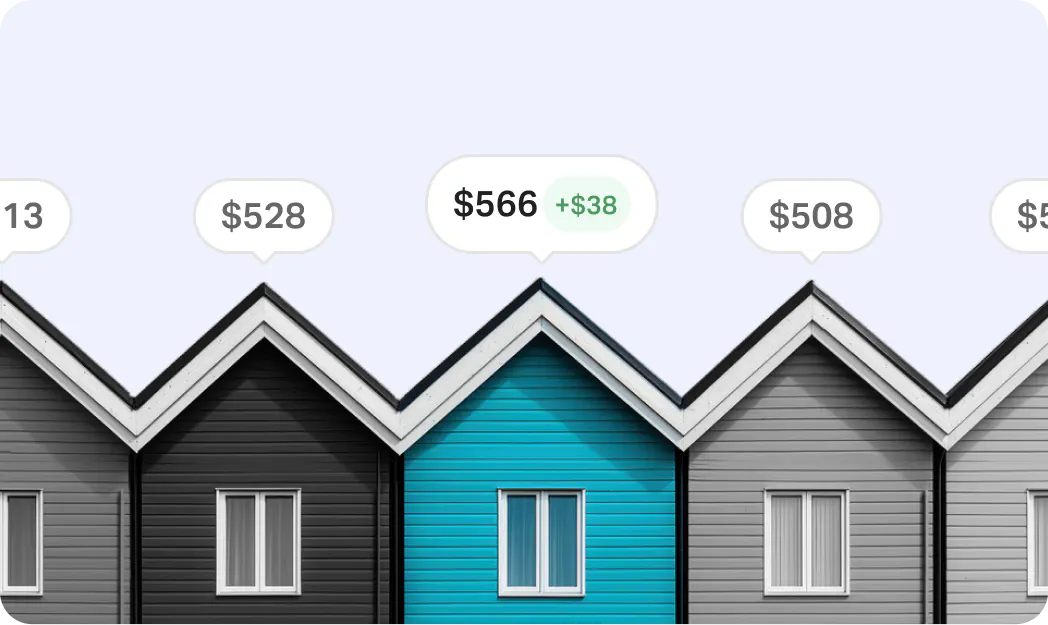
We analyze your market's data to recommend the best prices for your property. You'll know exactly what to charge to maximize your bookings.

Performance score
One easy-to-understand score that reflects:
- Daily occupancy rates
- Average Daily Rate (ADR)
- Revenue potential
- Booking lead times

Proactive market intelligence
Our market insights show you booking trends up to 180 days in the future. See when demand is spiking and how far in advance most bookings happen.

Multi-property dashboard
Have more than one listing? Connect 100+ properties and easily switch between them from a drop-down menu.

Customizable Benchmarking
Exercise complete control over which comparable properties inform your future performance insights. Use filters to build a custom comp set.
How It Works
Start improving your listing performance in three easy steps:
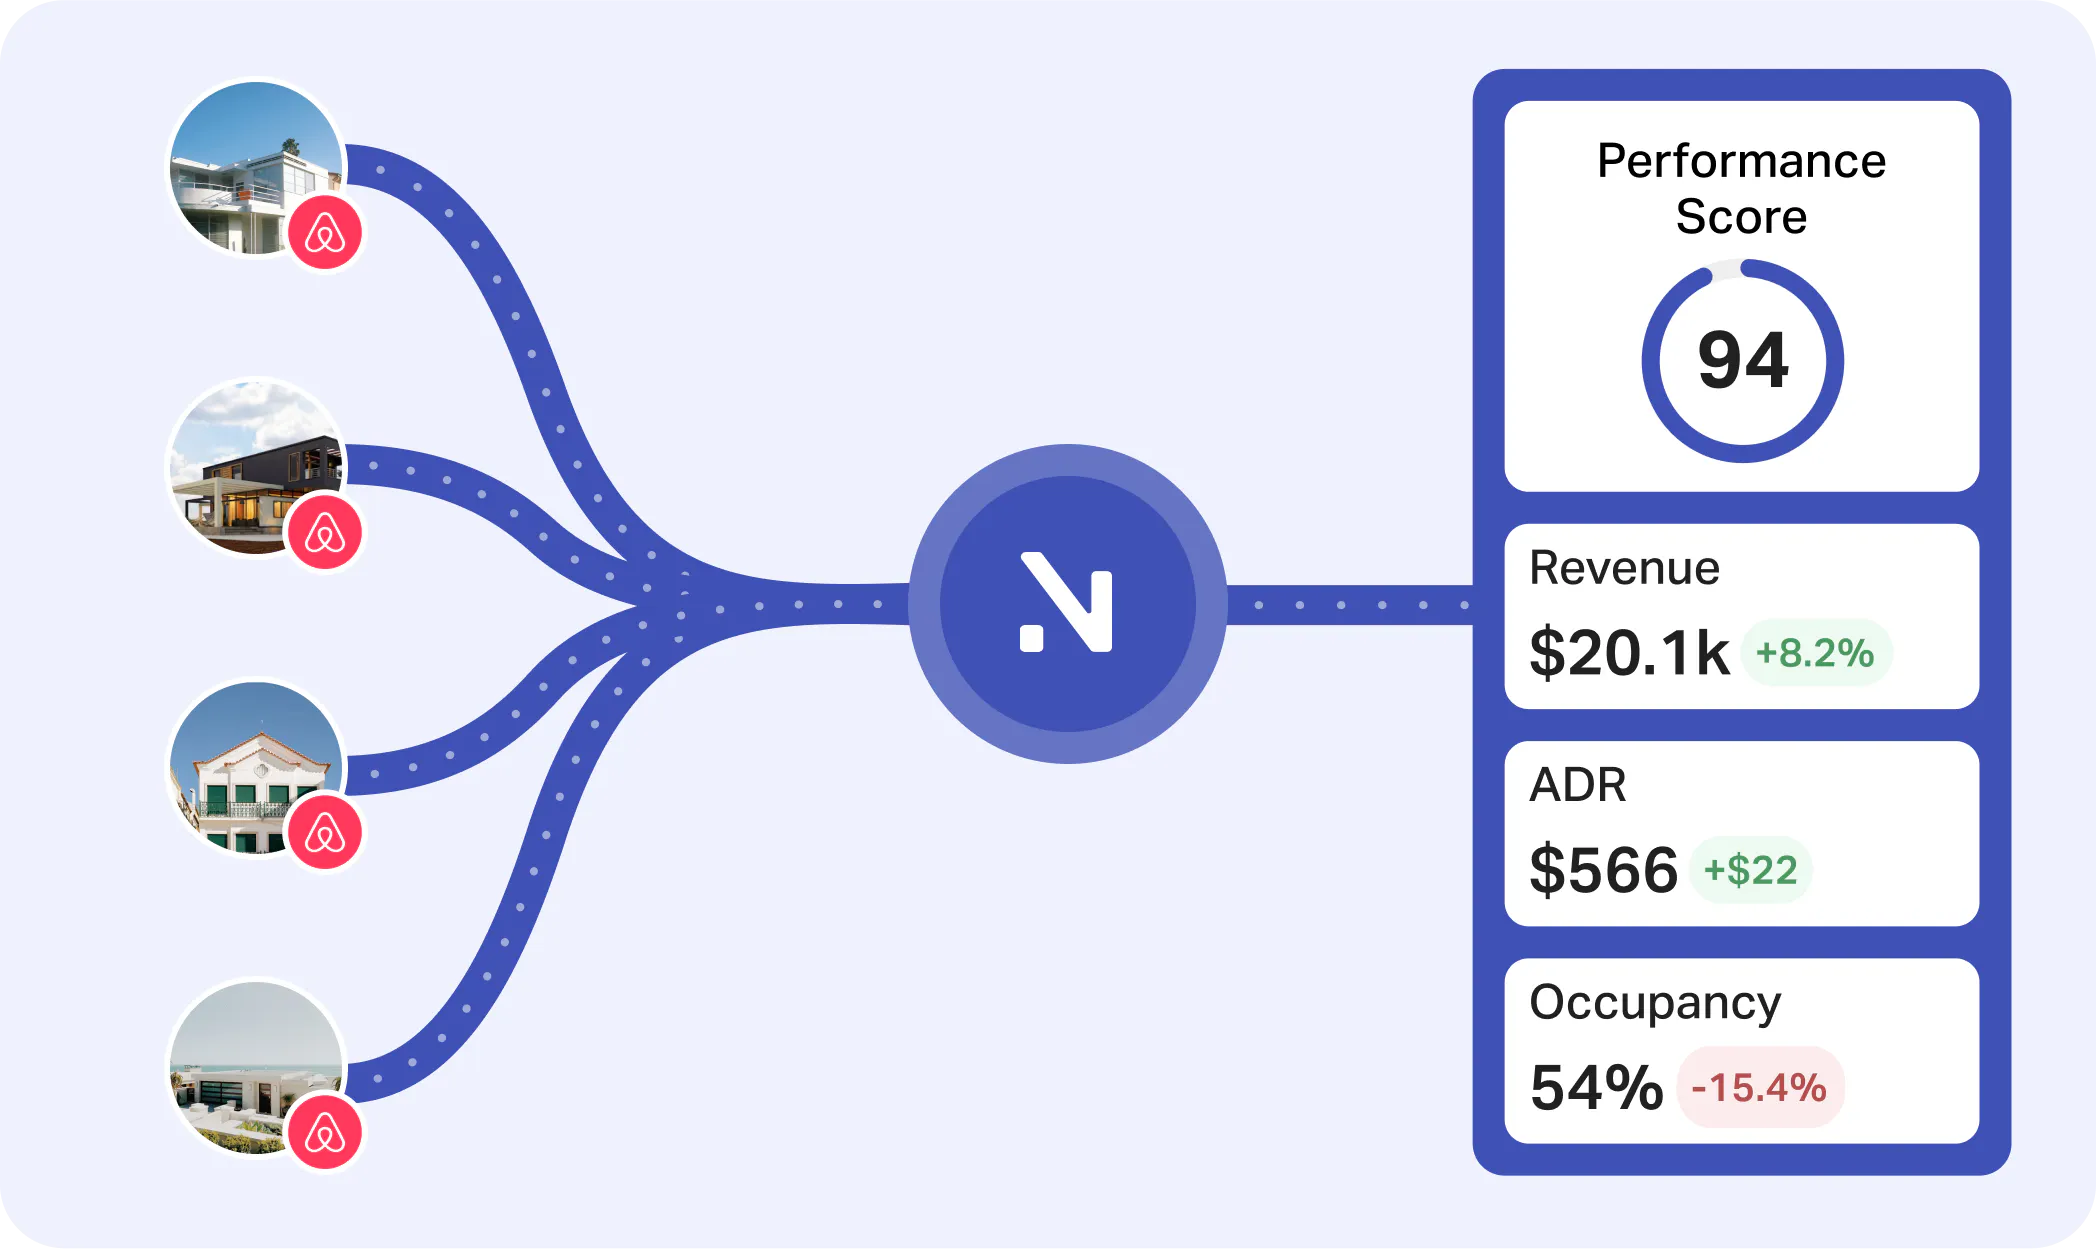
Review your performance score
Instantly compare your future bookings to market averages and similar listings. We give you a score between 10 and 100 for quick analysis, paired with graphs to help you understand your strengths and weaknesses. New to performance metrics? We guide you through the whole process to help you understand what matters most.
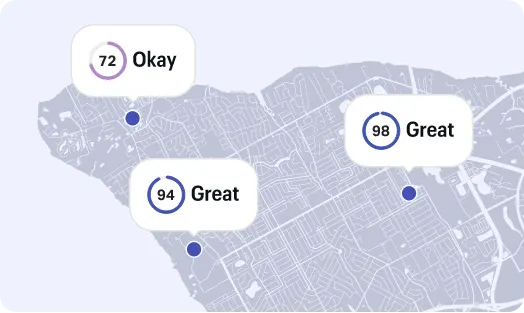
Make data-informed decisions
Get clear pricing guidance based on average booking lead times for similar listings—so you know when and how much to adjust your rates to improve your occupancy.
Don’t just take our word for it.
AirDNA has completely transformed how I manage my listings. The STR performance metrics have helped me increase occupancy and revenue significantly.
Sarah L, Airbnb Host
Being able to benchmark vacation rentals has been a game changer. AirDNA shows me exactly how to stay ahead of my competition.
Mark T, Real Estate Investor
Ready to boost your STR listing performance?
Running a successful short-term rental business doesn't have to be complicated. Join thousands of hosts who are using AirDNA to make data-driven decisions and grow their rental income with confidence.


Everything you need to know about performance benchmarking with AirDNA
The Performance Dashboard is a tool designed to help STR hosts track and improve their STR competitive analysis. Compare your listing performance to other active short-term rentals. We provide data on revenue, occupancy, pricing trends, cancellation rate, and booking lead times. Our goal is to offer actionable insights to boost your property performance.
When you're just getting started with short-term rentals, knowing how to optimize your listing can feel overwhelming. Our Performance Dashboard breaks down your STR listing performance into clear, actionable insights. You'll see your daily revenue and occupancy trends, how you compare to similar properties, and exactly what changes will make the biggest impact. Plus, we guide you through each metric with simple explanations and practical tips.
Think of performance benchmarking as having a window into what's working for successful properties like yours. Instead of guessing whether your listing is doing well, you can compare your STR performance data with similar properties in your area. We look at factors like your pricing, occupancy, and total revenue alongside properties that match your location, size, and amenities – giving you a clear picture of where you stand and where you could improve your property management.
When you can see what top-performing properties in your market are doing, you can make informed decisions about your own listing. Take your STR performance report and ask yourself some questions. Maybe similar properties are charging more during local events, or getting better occupancy with a different minimum stay requirement. Our benchmarking and performance measurement tools show you these opportunities, so you can adjust your strategy based on what's actually working in your market and not on gut feelings.
Start with the basics: your average occupancy rate and Average Daily Rate (ADR). These two numbers tell you how often your property is booked and how much you're earning per night. Our Performance Score combines these and other key metrics to show you where you stand compared to similar properties in your area.
AirDNA’s Performance Score rates your listing from 10 to 100 based on how it stacks up to similar properties in your area. This score reflects revenue, occupancy, and pricing metrics and provides you with a helpful benchmark for your STR listing performance that's easy to track over time.
Creating your comp set is all about finding your property's closest competitors. We help you identify listings that are similar to yours in terms of location, size, and amenities. This ensures you're comparing apples to apples when looking at performance. Our system automatically suggests relevant properties and puts together a comp set, but you can refine your selection to get the most accurate benchmarks for your market.