U.S. Review August 2026: Calendar Shift Hides a Stronger Market Underneath
Published: September 16, 2026
Last updated: October 22, 2026

Bram Gallagher
Key Takeaways
- RevPAR fell 0.6% year over year in August to $166, as a 2.7% rise in ADR wasn’t enough to offset a 3.3% drop in occupancy. The headline numbers look weak, but the cause is calendar timing, not softening demand.
- Labor Day fell in August in 2025 but shifts to September in 2026. Shifting the comparison window by just three days turns August’s 2.3% demand decline into a 3.3% increase, and turns the occupancy shortfall into a 2.2% gain, the largest of the year.
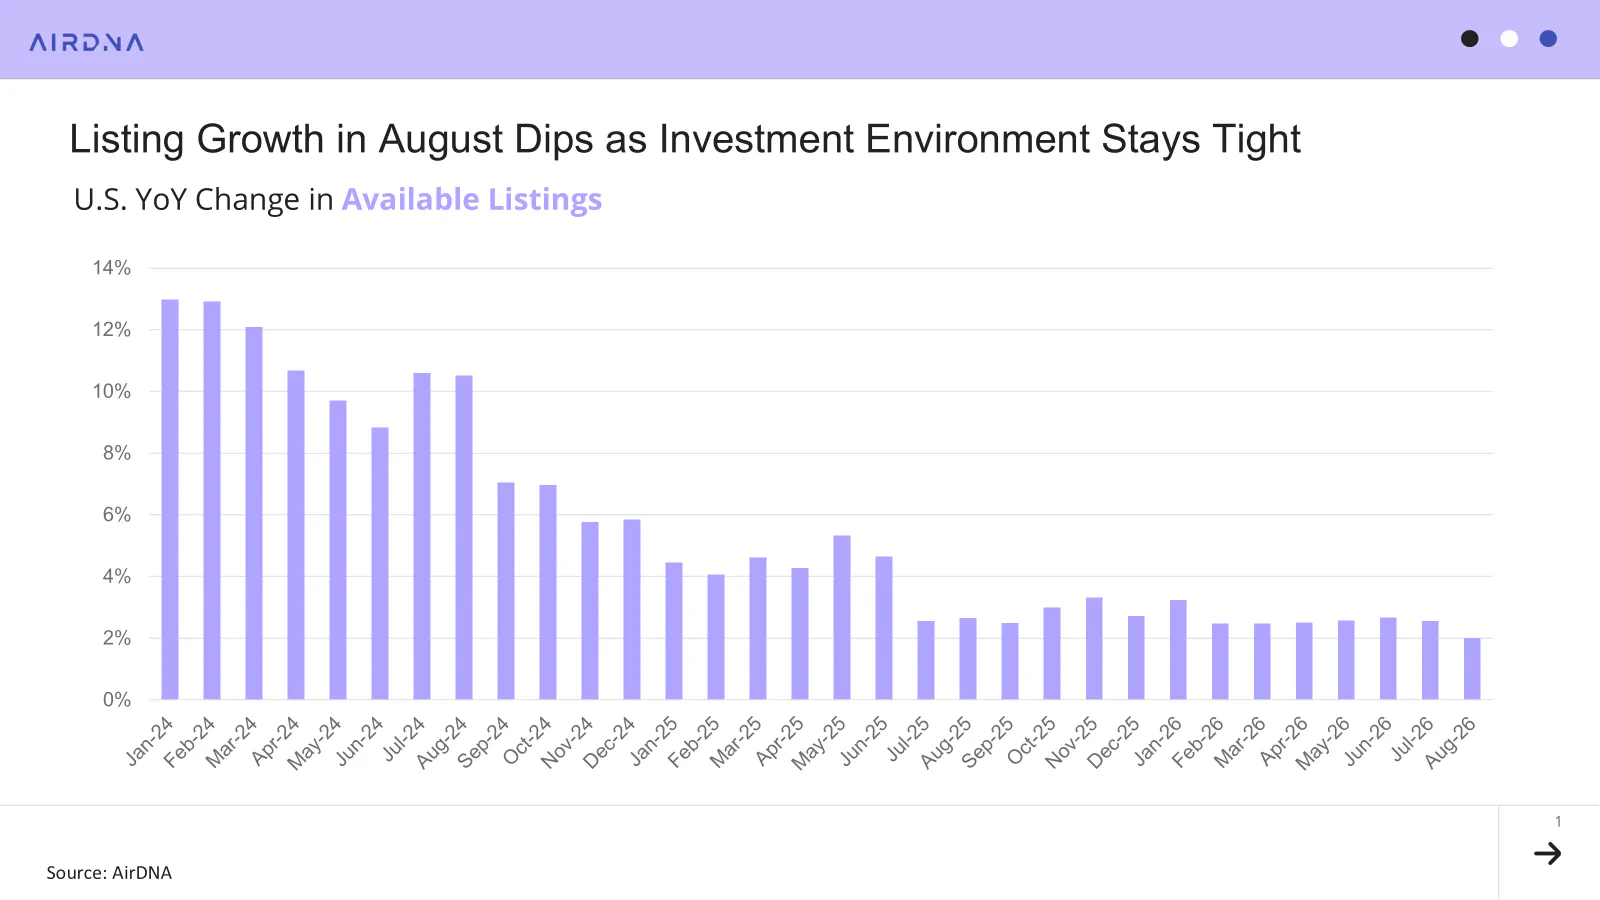
- Available listing growth slowed to 2.0% year over year, the second straight month of deceleration, as mortgage rates near 6.7% continue to restrain new supply, especially in coastal and urban markets.
August looked like a soft month for U.S. short-term rentals: RevPAR, demand, and occupancy all declined year over year. Nearly all of that decline traces back to a single quirk of the calendar. Labor Day weekend fell in August last year and moves into September this year, pulling a strong late-summer travel weekend out of the year-over-year comparison. Every single day in August 2026 saw meaningfully higher demand than the same day in 2025, until the comparison reaches Labor Day weekend itself.
Pricing tells a similar story. ADR growth cooled from 5.2% in July to 2.7% in August as World Cup host markets returned to more typical rate levels, while the Repeat Rent Index, which measures pricing among existing operators, actually accelerated to 5.2%. Looking ahead, pacing remains strong, with no future month tracking less than 9.0% ahead of 2025, and events like the Formula 1 Grand Prix in Austin are already delivering outsized revenue gains.
At a Glance: Key U.S. STR Performance Metrics for August 2026
- Revenue per Available Rental (RevPAR) declined 0.6% year over year to $166.01
- Available listings reached 1.76 million, a 2.0% increase YoY
- Demand nights declined 2.3% YoY
- Occupancy averaged 57.8%, down 3.3% YoY
- Average Daily Rates (ADR) climbed to $287.34, up 2.7% from last year
- The Repeat Rent Index (RRI) rose 5.2% YoY
- Total nights booked were up 2.5% from 2025
Economic Outlook
The U.S. economy continues to chug along despite several increasingly pressing crises. The August jobs report handily exceeded expectations, showing that the U.S. added 162,000 jobs, and the unemployment rate remained unchanged at 4.1%. Labor force participation increased in August for the first time in nearly a year, to 61.6%, up from 61.4% in July. This strong result is good news for consumer spending, but it has all but dashed hopes that the Federal Reserve will cut its benchmark lending rate.
Mortgage rates have remained stubbornly high, around 6.7% in August, since the U.S. war on Iran commenced in February, and recently renewed hostilities have sent oil prices back up to near $100 a barrel. Higher oil prices have affected not only gas prices at the pump, but have trickled through to food, energy, and transportation costs. Higher inflation expectations lead to higher long-term rates, since lenders need to be compensated for their loss of purchasing power.
U.S. fiscal deficits and the enormous capital demands of the AI infrastructure buildout are also driving rates higher, as demand for funds outstrips supply. Taken as a whole, financial conditions remain difficult for new investment in the near-to-mid-term. While this means supply growth will remain muted, existing operators, many of whom bought into the market at record-low rates, should continue to see the benefits of considerable barriers to entry.
Meanwhile, persistent inflation continues to erode consumer purchasing power, as wages fail to keep pace with prices. August CPI rose 3.4% year over year, well above the Fed’s 2% target, though still well below post-pandemic peaks. If inflation intensifies, further rate hikes could depress investment and loan activity, creating headwinds for travel spending. U.S. short-haul domestic travel looks appealing for the upcoming shoulder months, as do low-cost activities such as leaf-peeping and outdoor recreation.
Supply Growth Declines From an Already Low Level
Supply growth has been slowing for years as high interest rates and persistently high home prices have put the U.S. housing market in a deep freeze. The beginning of 2026 looked promising for investment, with mortgage rates briefly dipping below 6% in February, but the U.S. war on Iran and the subsequent energy crisis reignited inflation and interest rates. Mortgage rates stayed close to 6.7% in August and more recently have reached as high as 7%, the highest rate in over a year. AirDNA’s research suggests roughly a six-month lag between changes in mortgage rates and new listings, putting August at the end of the lower-interest-rate window.
At the same time, the World Cup and the summer travel season likely pressured hosts to list earlier, and a second straight month of declining supply growth backs that up. Available listings grew 2.0% year over year, down from 2.6% in July. There looks to be little hope for acceleration in the near term, as renewed hostilities in September will contribute to inflation for at least the next two months, according to the Trump administration.
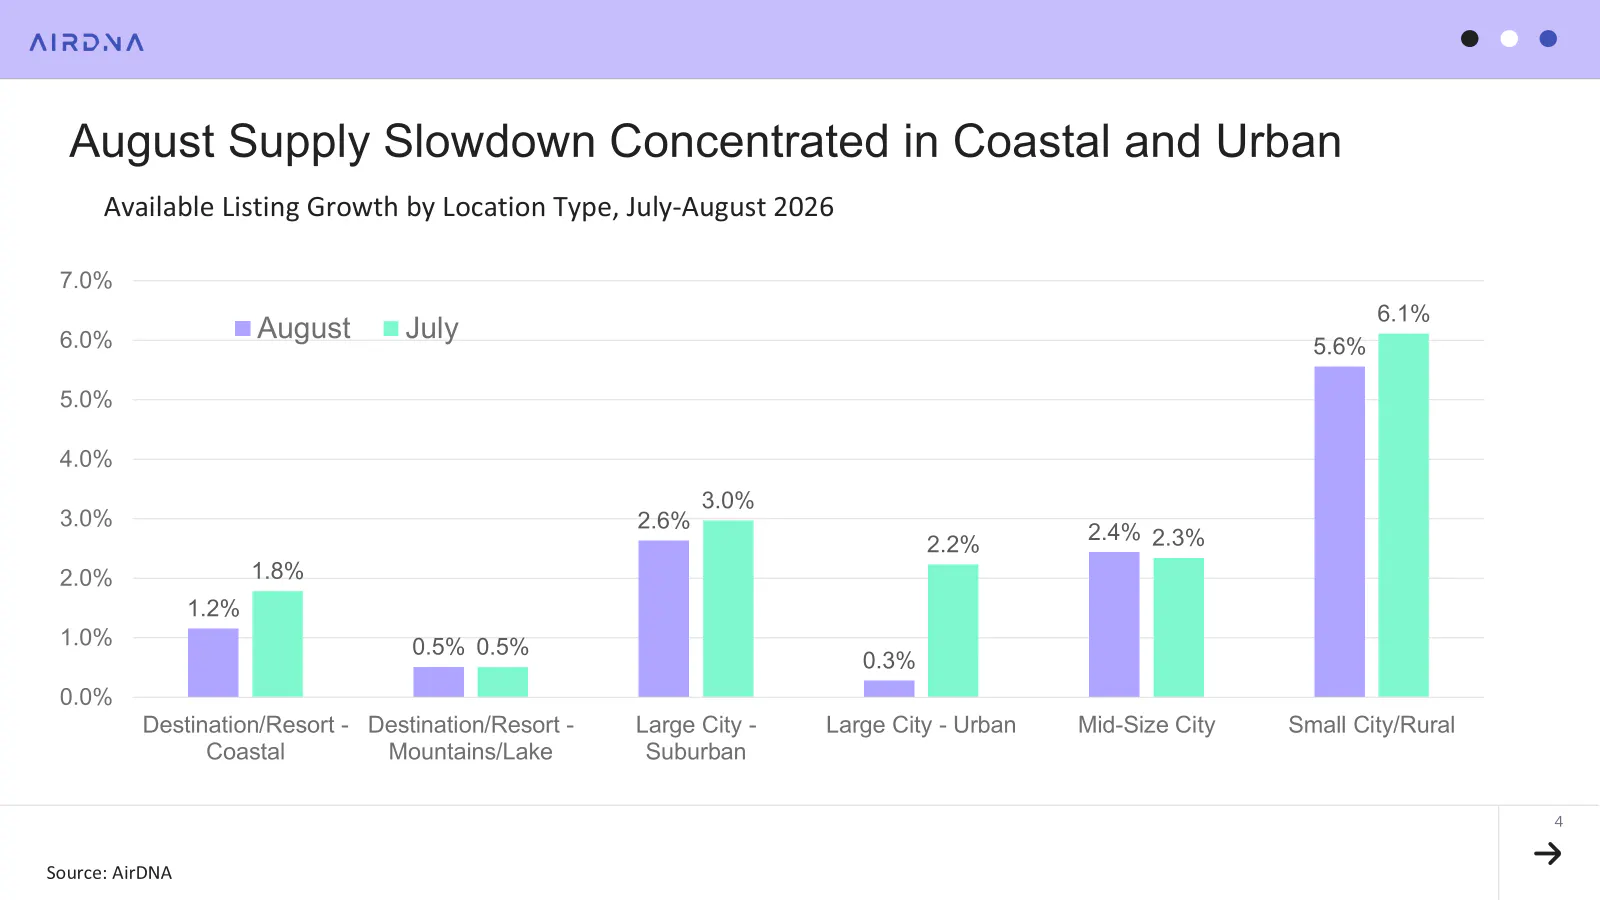
When examining locations, the most significant declines in supply growth occur in coastal and urban locations. Coastal location listing growth declined to 1.2% from 1.8% in July, while urban locations declined to 0.3% from 2.2% in July. Small city/rural locations maintained the fastest supply growth rate (+5.6%), but are a relatively small location type with limited effect on the total.
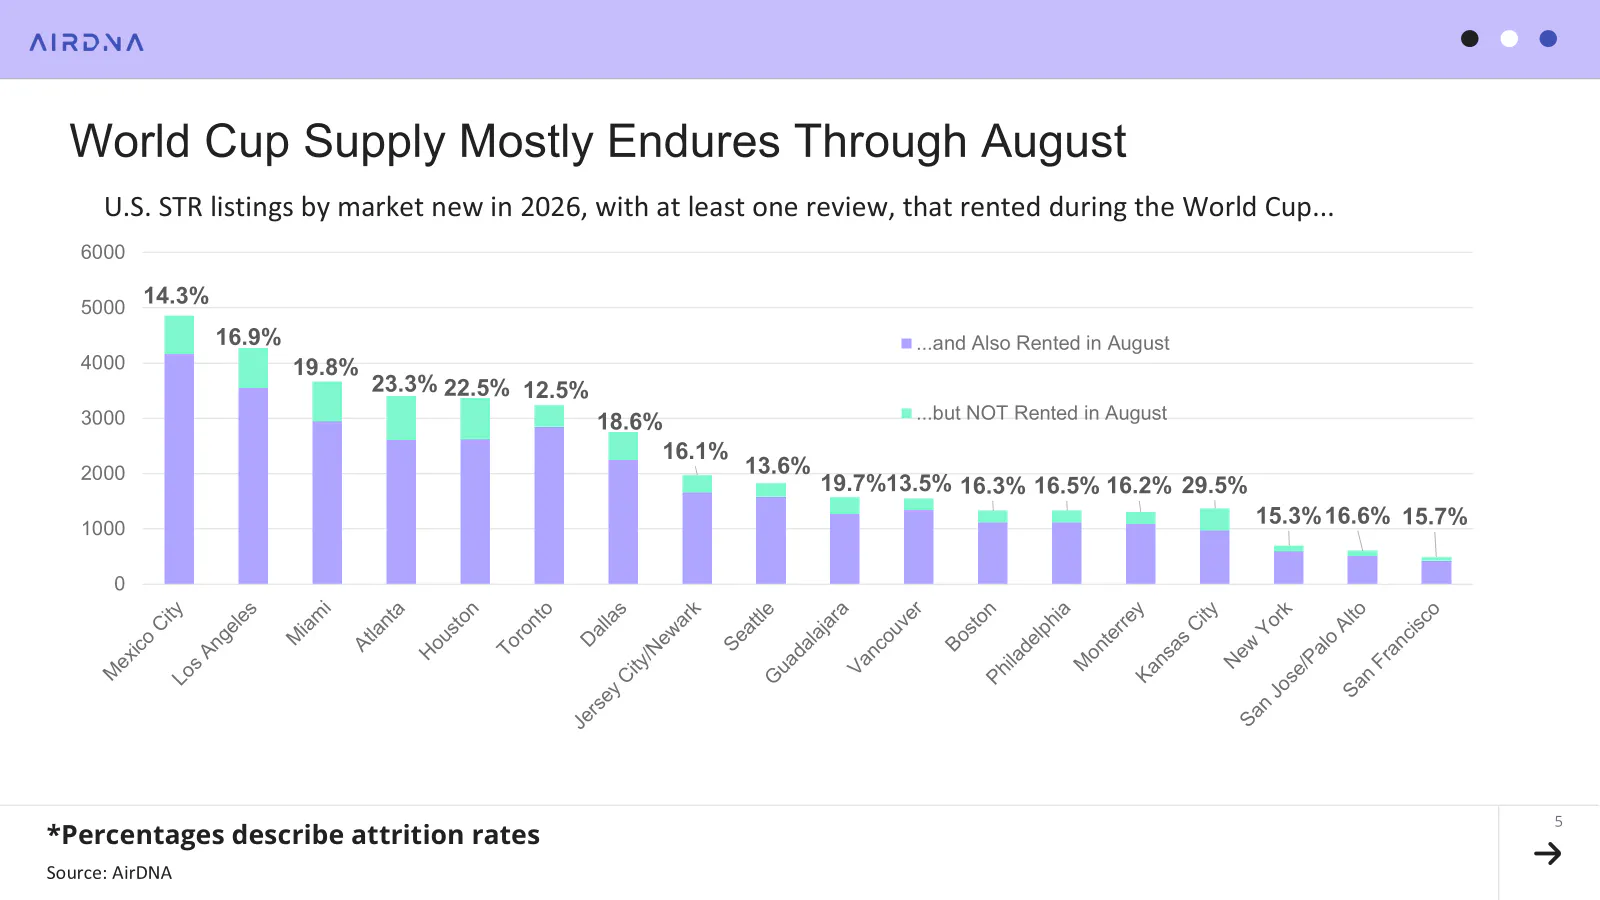
One interpretation of these figures is that urban locations increased supply for the World Cup and then shuttered those same listings in August. However, when looking at listings that were newly introduced in 2026 and were rented during the World Cup, the overwhelming majority of these listings also rented in August, suggesting considerable durability in listings introduced for the games. In fact, the 0.3% growth rate for urban locations in August falls to a 3.9% year-over-year loss when excluding listings in World Cup host markets.
Demand Growth in August Reflects a Calendar Shift, Not a Slowdown
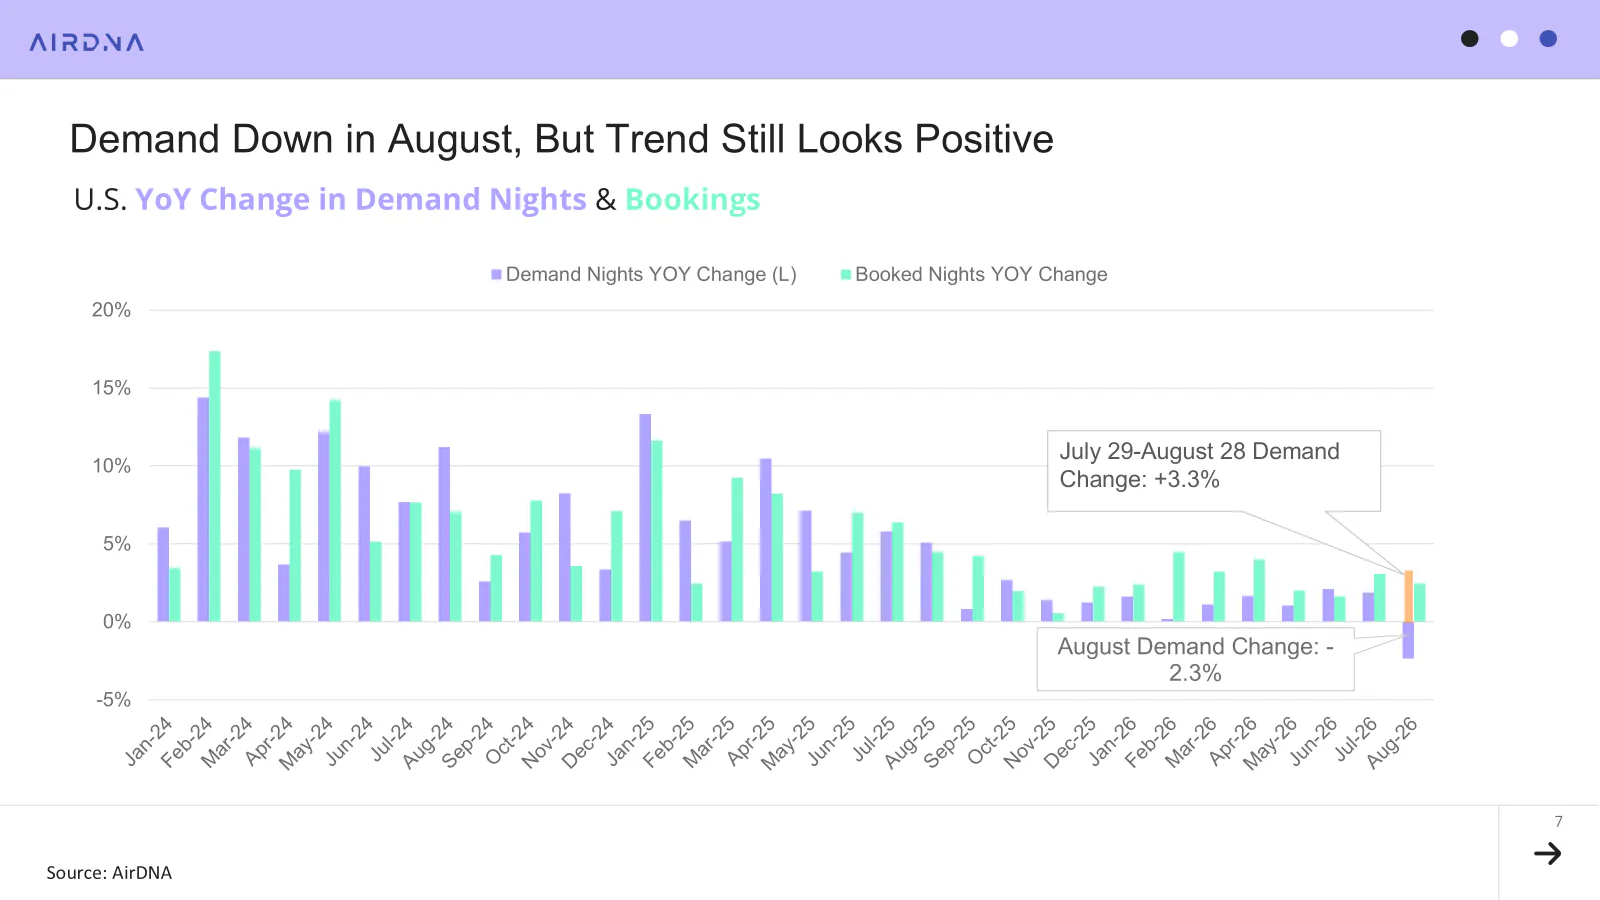
The headline demand number for August, -2.3% year over year, might lead a casual observer to conclude that summer demand momentum reversed. June (+2.1%) and July (+1.9%) had the two fastest demand growth rates of any month since October 2025 (+2.7%). A negative result in August sounds like a World Cup hangover, or perhaps consumers worried about energy prices. In fact, the loss stems entirely from Labor Day weekend shifting from August in 2025 to September in 2026.
Comparing this August to August 2025 shows that every single day in 2026 had meaningfully higher demand, until the comparison reaches the Friday of Labor Day weekend 2025.
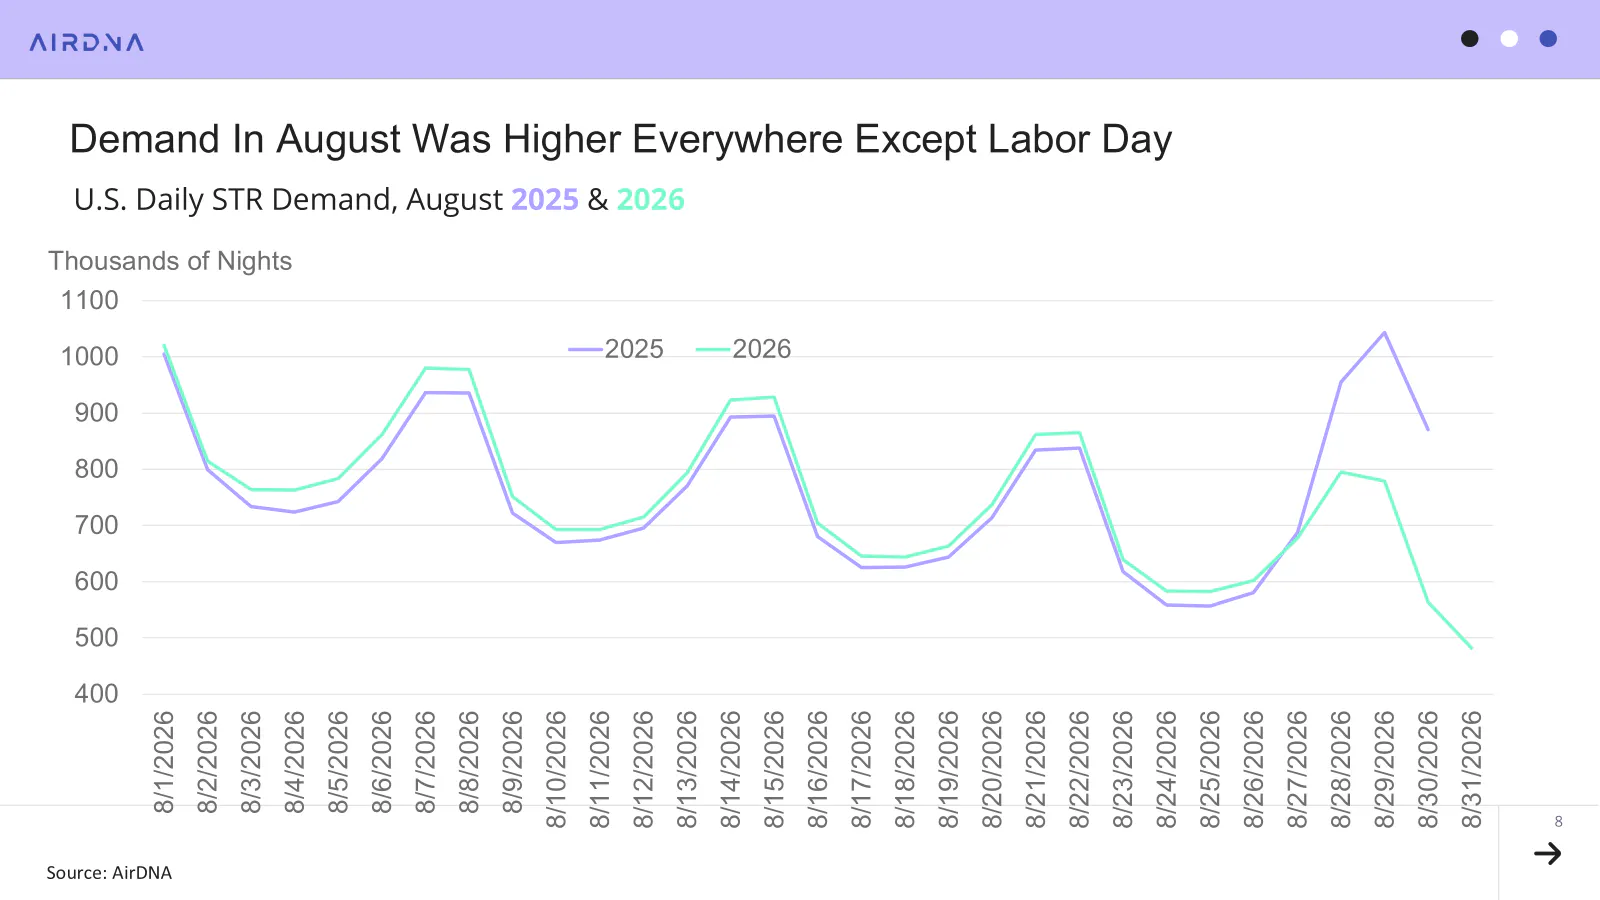
Shifting the comparison window back just three days changes the result substantially: demand nights for the period July 29 through August 28, 2026 were 3.3% higher than the corresponding period in 2025. Demand comps ease noticeably from September 2025 onward, meaning demand growth could accelerate meaningfully through the rest of the year. In fact, August 2025’s demand growth rate was higher than fundamentals would have suggested, but that year the calendar shift boosted August at September’s expense. This year, the opposite will happen, and September’s demand growth should see a meaningful incremental gain from the shift.
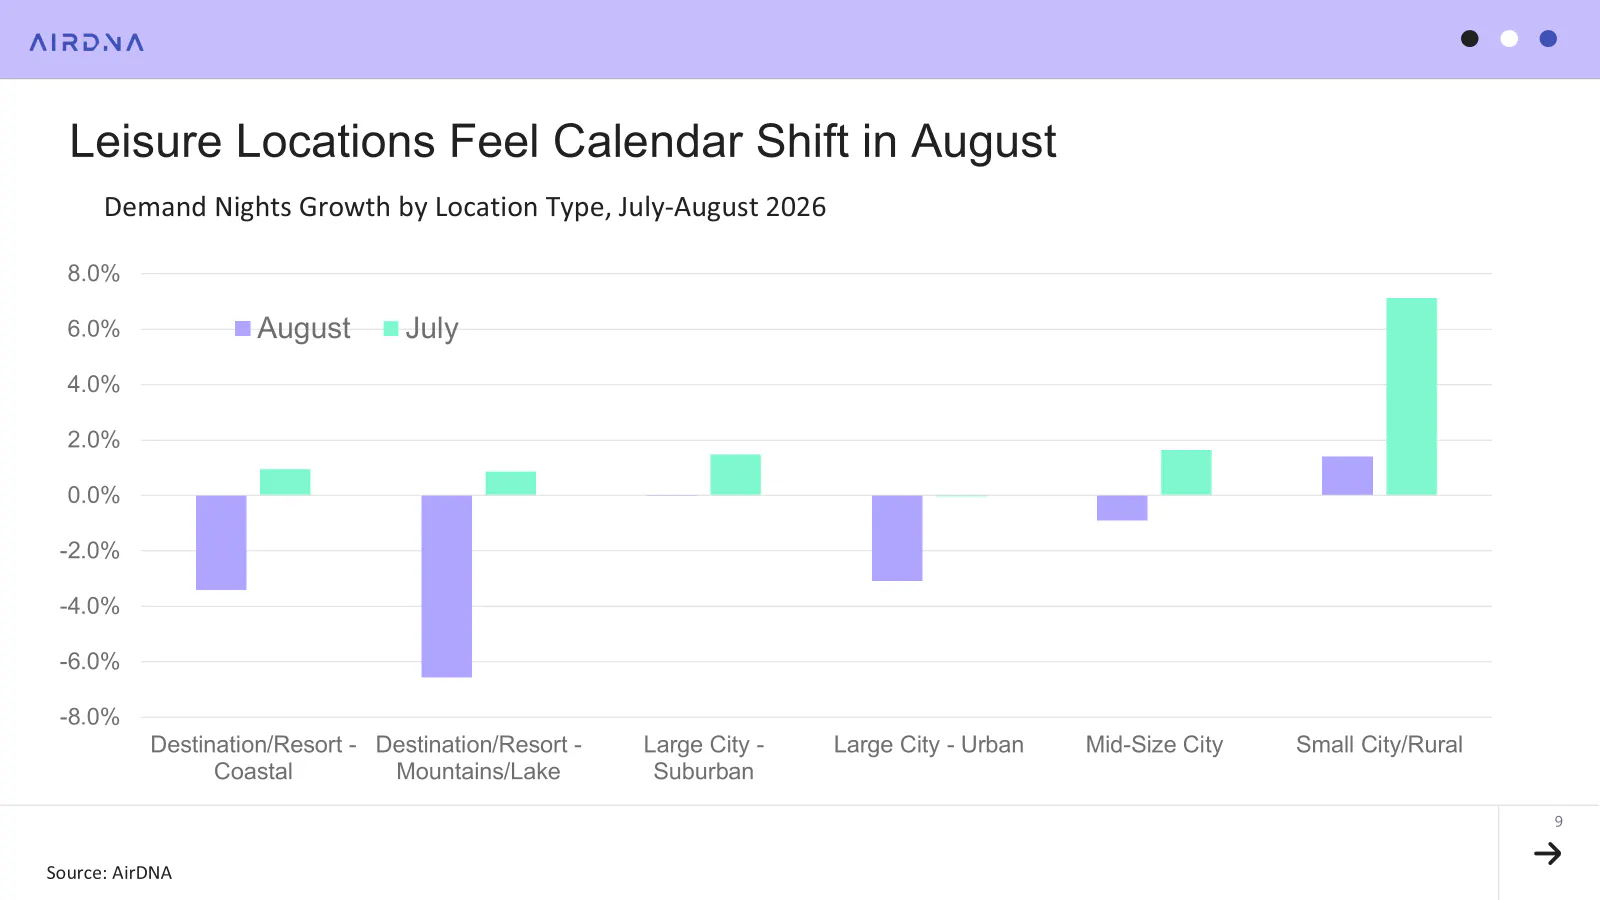
Location types back up this interpretation. Coastal, mountain/lake, and urban markets, the three types most closely associated with a long Labor Day weekend, show the sharpest demand drops, while small city/rural, suburban, and mid-size city locations remained essentially flat.
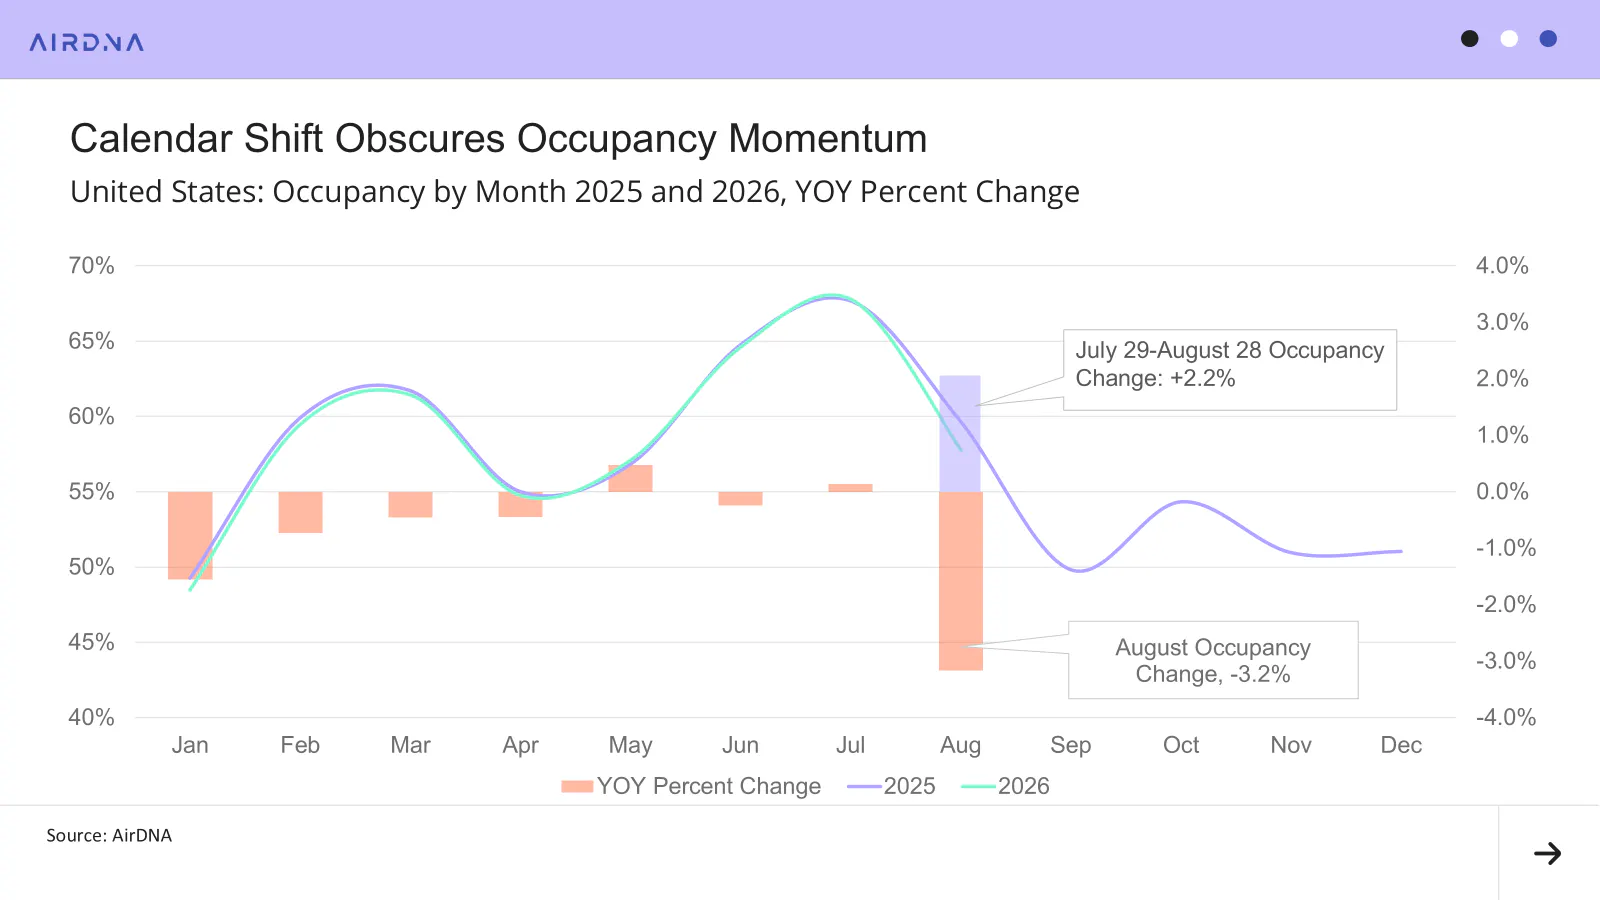
The calendar shift also obscures the advancing momentum in occupancy. The year started with January occupancy 1.6% lower than the previous year, due in part to the snow drought depressing ski travel. As the months progressed, the growth rate haltingly improved, reaching 0.1% by July. The rest of the year was poised to post gains on weak H2 2025 comparisons, as described above, but the calendar shift produced the largest occupancy shortfall of the year, 3.2% lower than in August 2025. Shifting the time frame by three days reverses this to a 2.2% gain, the largest occupancy gain of the year.
ADR Growth Slows as World Cup Cities Return to Normal
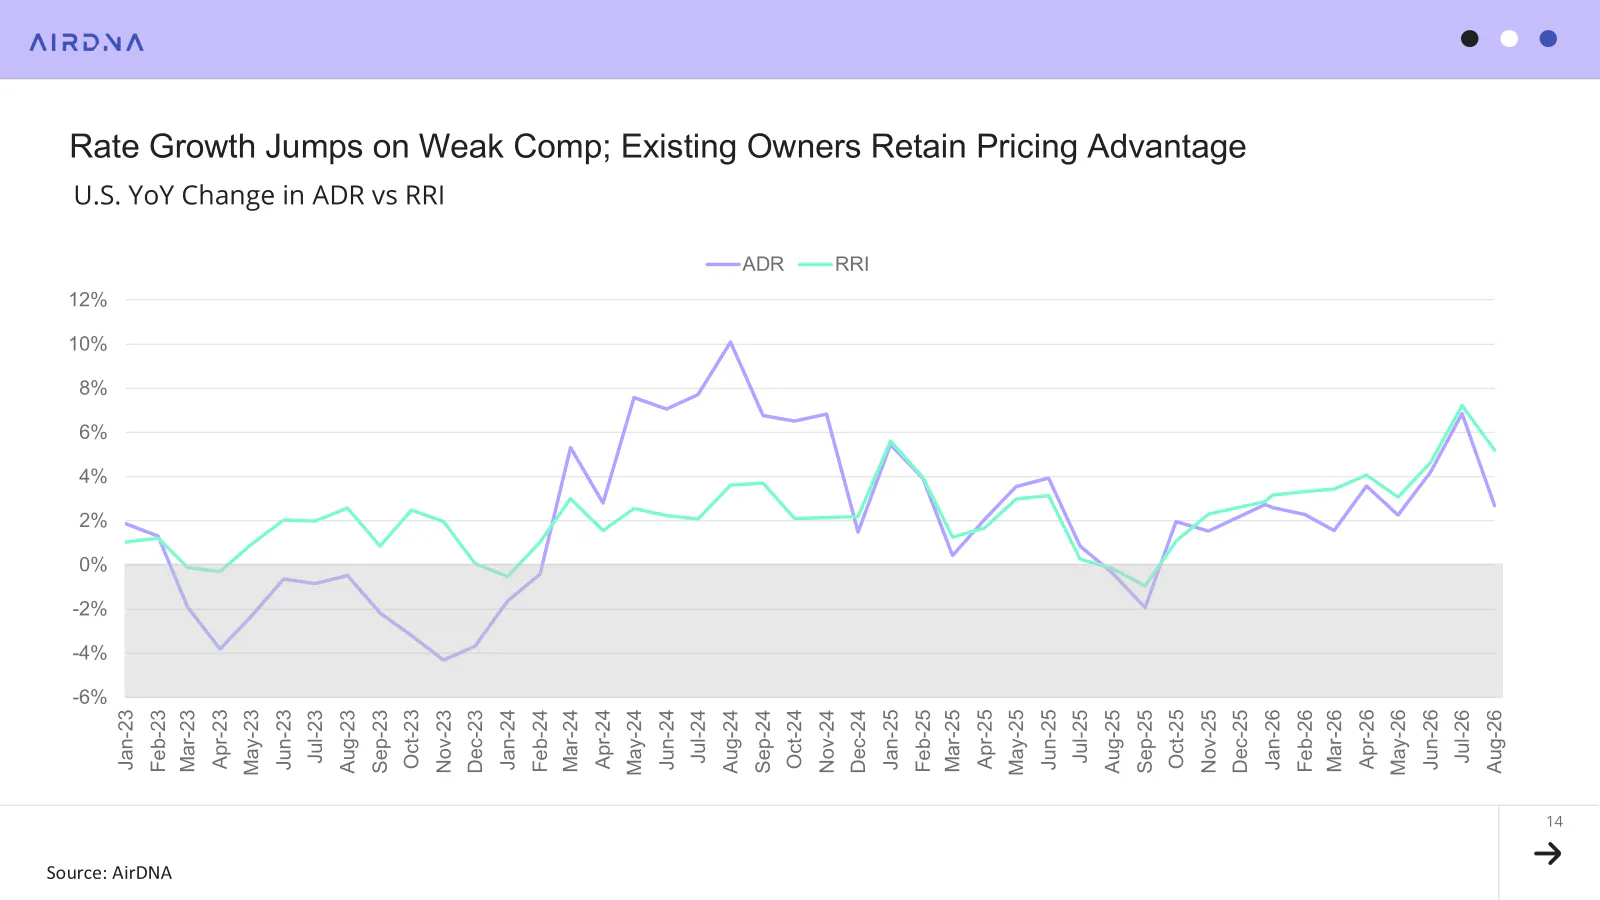
If interest rates and calendar shifts explain the supply and demand slowdowns rather than a World Cup hangover, what about prices? ADR growth cooled noticeably, from 5.2% in July to 2.7% in August. This puts August’s rate much closer to the pre-World Cup (January through May) ADR growth rate in 2026 of +2.4%. The AirDNA Repeat Rent Index (RRI), which strips out changing listing composition to show how existing operators are actually changing prices, held up better in August at 5.2%. That gap suggests rented supply shifted toward lower-priced, potentially smaller listings compared with July, even as the owners who did rent raised prices substantially.
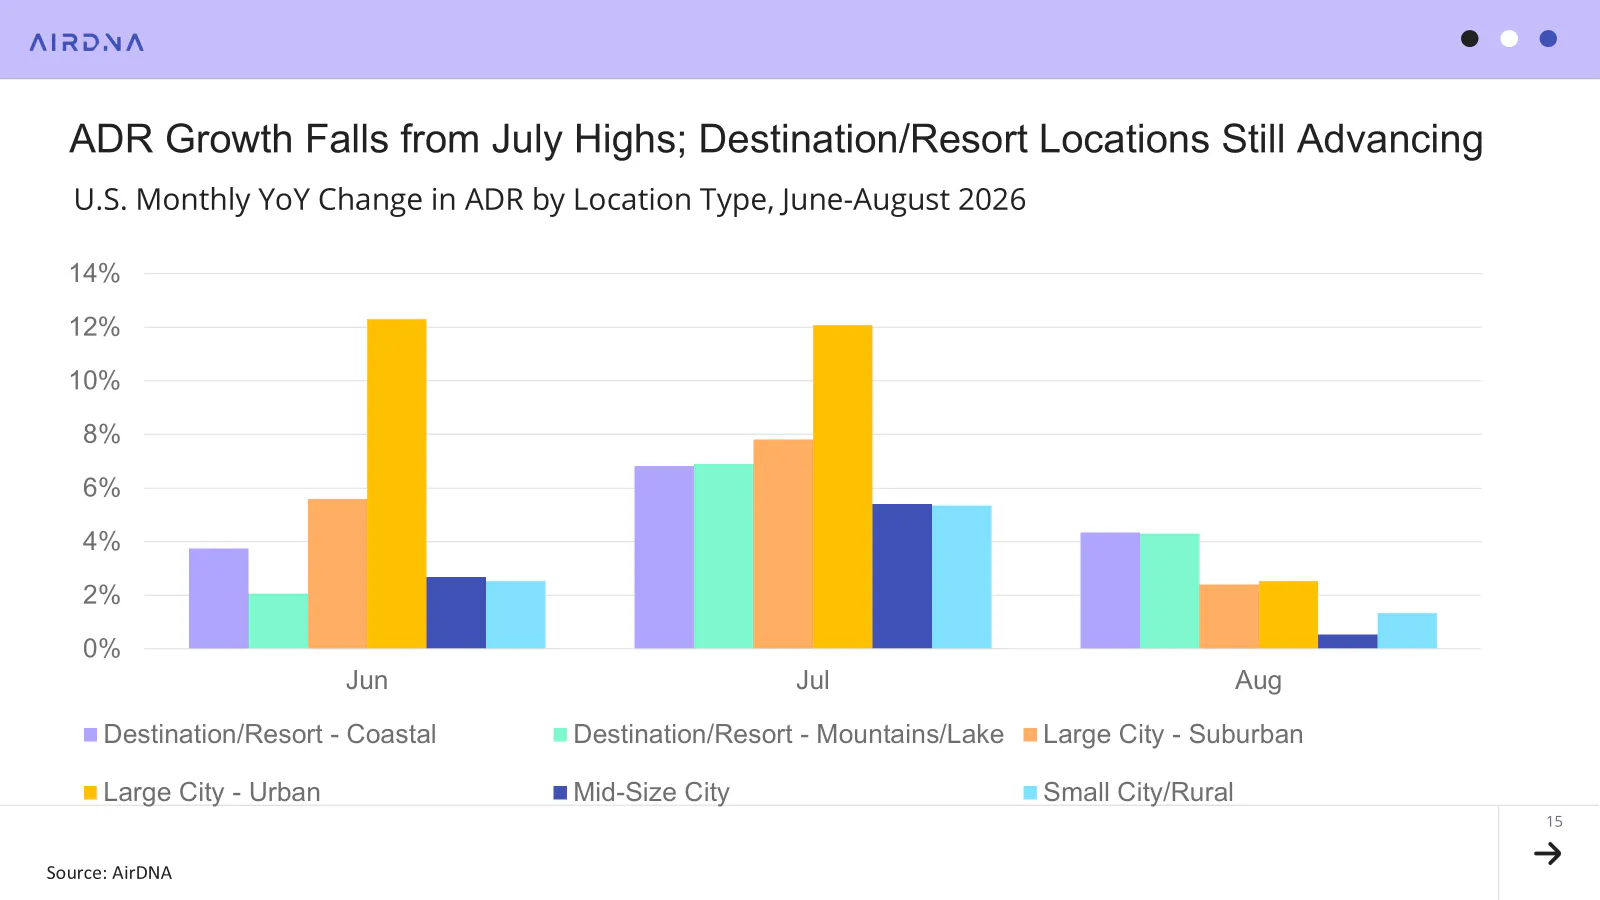
Looking at locations, the remarkably high rate increases in June and July ceased in August as World Cup demand gave way to more traditional, end-of-season travelers. Coastal and mountain/lake resort locations both grew ADR 4.3% year over year, lower than their 6.8% and 6.9% rates in July but still the fastest-growing location types for rate. Meanwhile, urban ADR growth dropped from +12.1% to just +2.5%. Small city/rural (+1.3%) and mid-size city (+0.5%) locations also saw significant ADR drops, even though these location types were only marginally tied to World Cup demand.
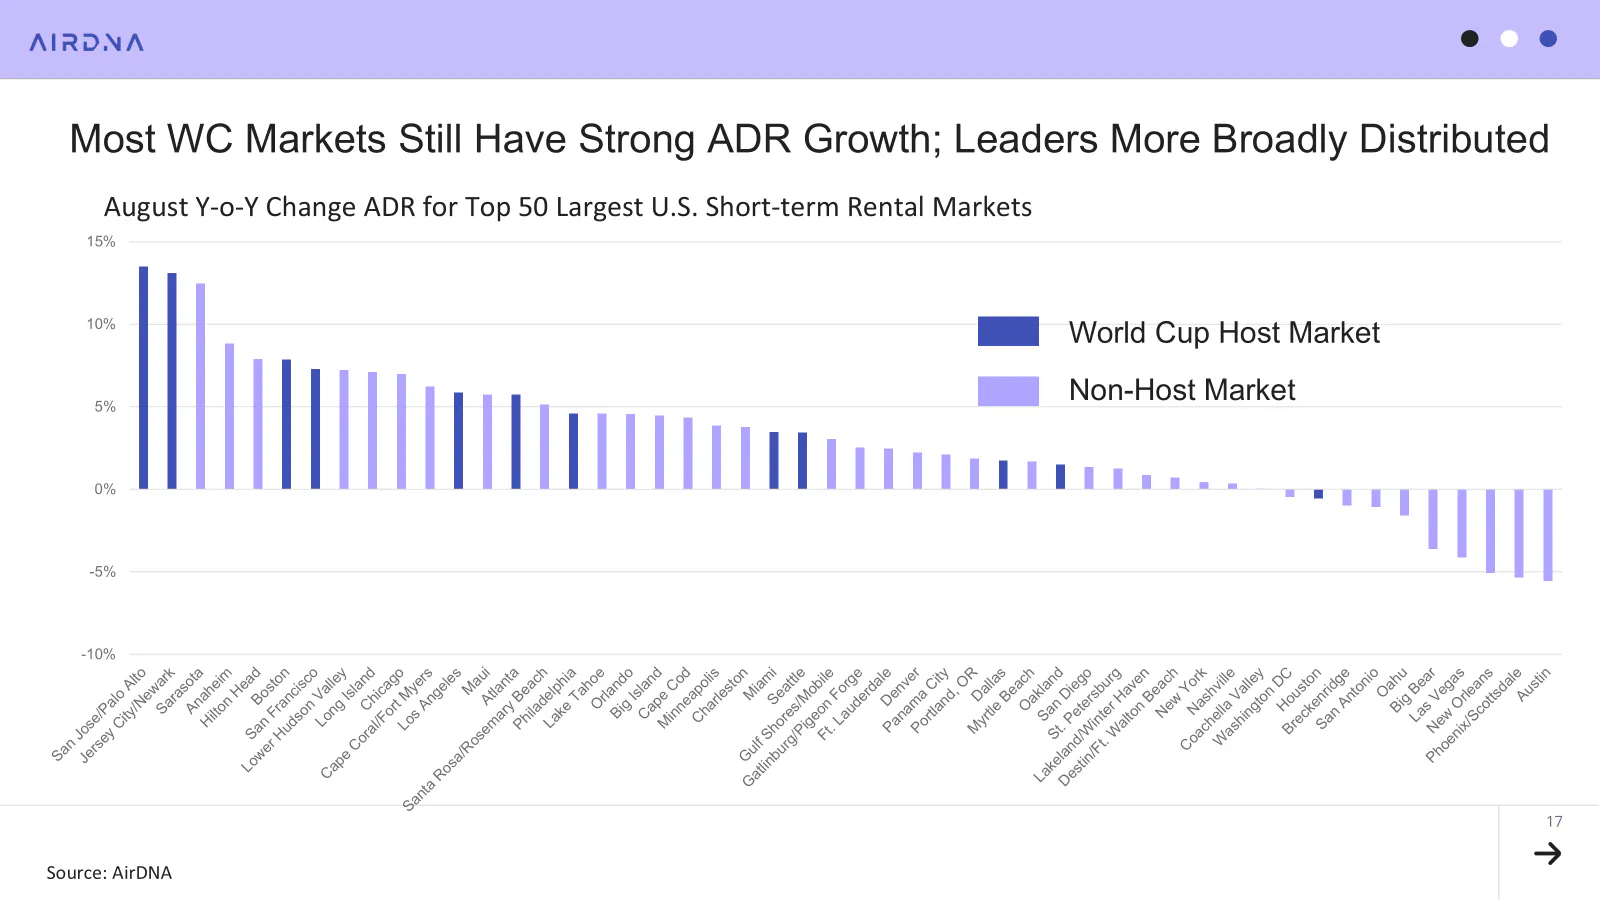
The top two ADR growth markets among the 50 largest U.S. markets were San Jose/Palo Alto (+13.5%) and Jersey City/Newark (+13.1%). They were followed by Sarasota (+12.5%) and Anaheim (+8.8%), two sunny summer leisure markets with no real connection to World Cup demand. In other words, while most World Cup markets had strong ADR growth, so did most of the top 50 markets overall, marking August as a transition from event-fueled ADR gains to more fundamental performance.
Pacing Points to a Robust Second Half and Into 2027
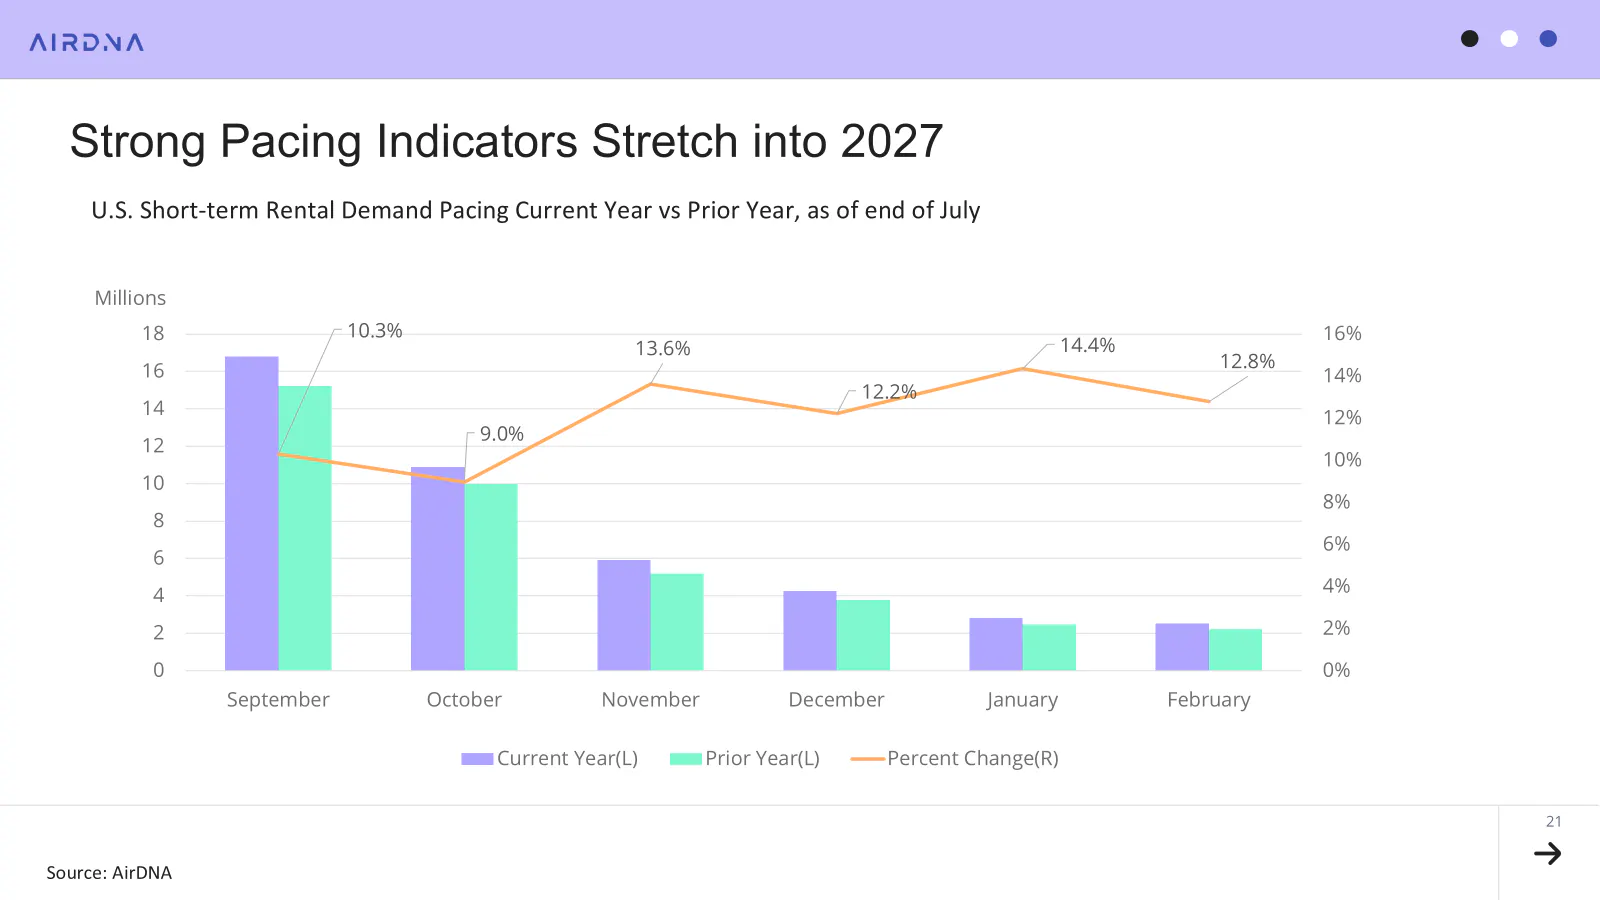
A proper read of recent performance has to account for the calendar shift swamping the August and September signals, but the broader trend looks like an improvement on last year. Pacing backs that up: no future month is tracking less than 9.0% ahead of 2025. Higher energy prices and softening consumer sentiment could still dent some last-minute bookings, but current pacing lines up well with rising travel momentum and weak comparisons from 2025, and, frankly, from the first two months of 2026 as well. January and February 2026 both underperformed as an intense snow drought all but erased a season from many Western destinations.
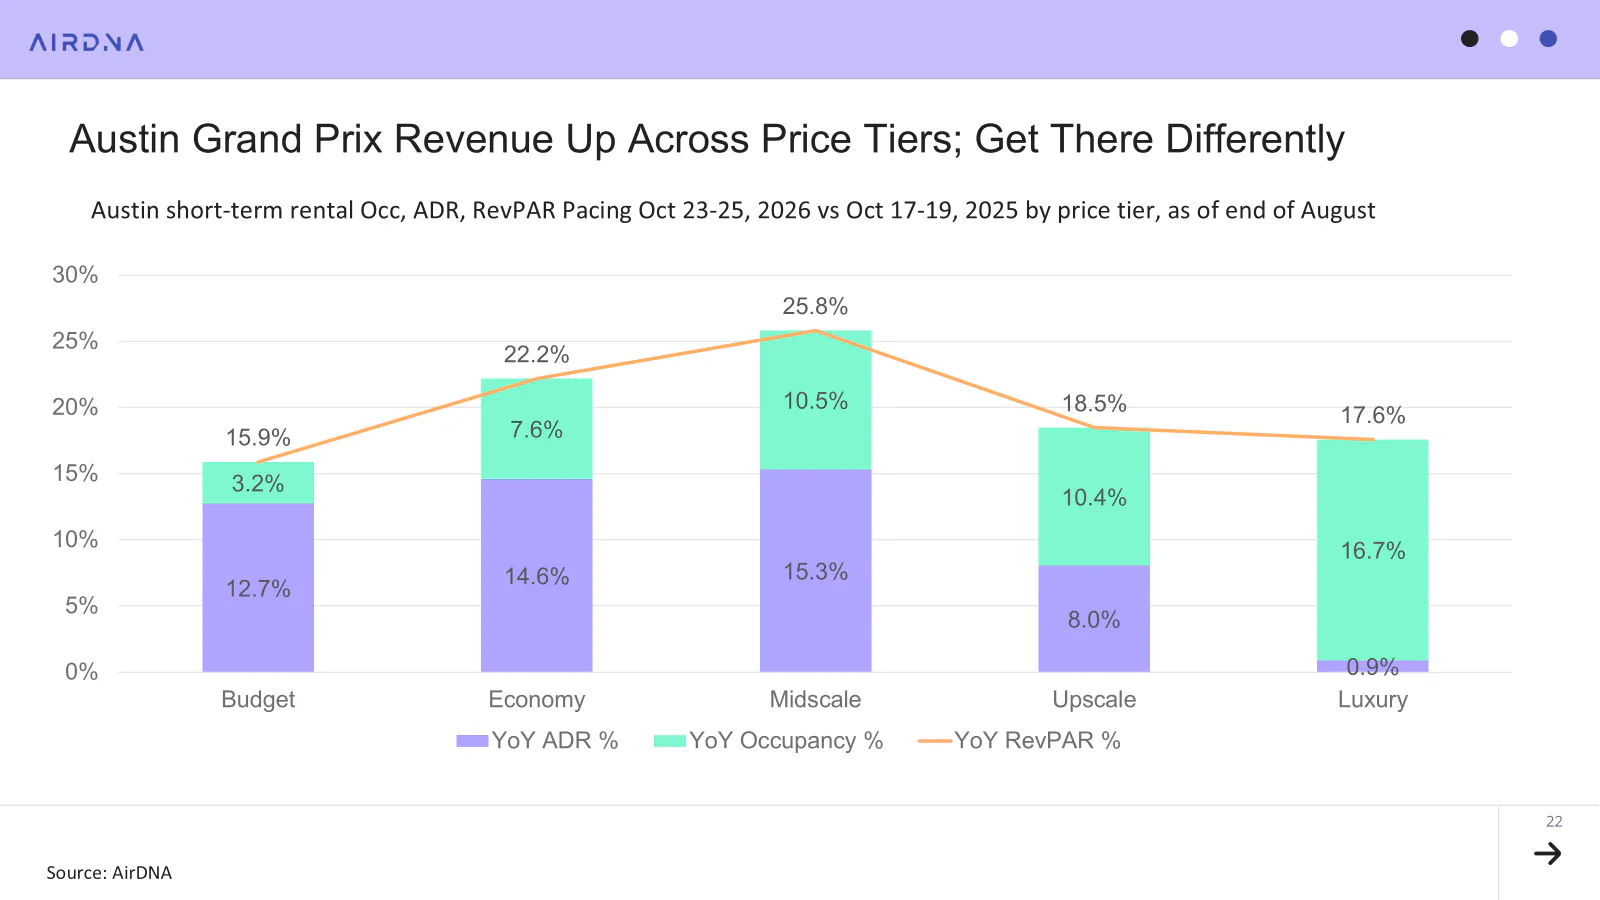
Austin is gearing up for the Formula 1 Grand Prix, coming to the Circuit of the Americas in October. Practice sessions start October 23, and the main race runs October 25. Comparing this year’s event to last year’s race, held October 17-19, 2025, shows short-term rentals expecting solid revenue gains over the event weekend, even better than last year. Revenue for the event is pacing +20.1% over 2025. Formula 1 events attract a variety of fans, but one common stereotype is the wealthy international traveler. AirDNA examined pacing by price tier to see what trends emerge.
Midscale STRs see the biggest RevPAR change, at +25.8%, a balance of 10.5% higher occupancy and 15.3% higher rate. Moving up or down the tiers from midscale delivers similar RevPAR boosts, but not all tiers get there the same way. Budget STRs raised RevPAR +15.9%, almost entirely through rate (+12.7%) rather than occupancy (+3.2%). The opposite happens in luxury-tier properties, where nearly all the gain comes from occupancy (+16.7%) and little from rate (+0.9%). Rather than dividing the market into haves and have-nots, this race looks like it’s drawing tiers together, as lower-priced listings raise rates much faster than higher-priced ones.
FAQs
Why did U.S. RevPAR fall in August 2026 despite ADR growth?
RevPAR fell 0.6% year over year because a 3.3% drop in occupancy outweighed a 2.7% rise in ADR. Most of that occupancy drop is a calendar effect: Labor Day weekend fell in August in 2025 but shifts into September in 2026, so August 2026 is being compared with an unusually strong August 2025.
Is the August 2026 demand decline a sign of a slowdown?
No. Shifting the comparison window by just three days, to line up the two Labor Day weekends, turns August’s 2.3% demand decline into a 3.3% increase. June and July 2026 had the two fastest demand growth rates of any month since October 2025.
Is U.S. short-term rental supply growth slowing?
Yes. Available listing growth slowed to 2.0% year over year in August, down from 2.6% in July and the second straight month of deceleration, as mortgage rates near 6.7% continue to restrain new supply, particularly in coastal and urban markets.
How is the Formula 1 Grand Prix affecting Austin’s short-term rental market?
Revenue for the October Formula 1 Grand Prix weekend is pacing 20.1% ahead of 2025. Midscale properties see the largest RevPAR gain, at 25.8%, while budget properties gain mostly through rate and luxury properties gain mostly through occupancy.
ARTICLE SUMMARY
The U.S. short-term rental market’s August dip in RevPAR and demand is largely a calendar illusion: Labor Day’s shift from August to September masks real strength in ADR, bookings, and fall pacing.
Bram Gallagher
AirDNA Director of Economics and Forecasting
Bram Gallagher is an Economist at AirDNA, specializing in uncovering insights that drive smarter short-term rental decisions. He put his Ph.D. in Economics from the University of Georgia to work researching and forecasting hotel data with CBRE prior to joining AirDNA, as well as teaching economics at a number of universities. In his spare time, Bram enjoys making wooden furniture with hand tools.