European Review August 2026: Strong RevPAR Performance is Driven by ADR Gains
Published: September 15, 2026
Last updated: October 22, 2026

Camilo Schmid Rivas
Key Takeaways
- RevPAR growth reflects rate increases, which are now widespread. In August, Europe’s RevPAR increased 4.3% to €113, driven entirely by a 7.5% rise in ADR to €160, despite occupancy declining 2.1 percentage points to 70.4%. All top 20 markets saw year-over-year ADR growth, and 18 out of 20 markets increased RevPAR. Only two saw any occupancy gains.
- Europe’s demand decline affects two countries primarily. In August, demand nights dropped 3.1%, and over the entire summer they fell 2.0%. Spain contributed 69% of the summer shortfall, with Germany accounting for an additional 31%. Excluding these two countries, overall European demand remains stable. Spain’s decline is linked to its regulatory delisting program, while Germany’s is due to a domestic pullback from its own coast.
- The biggest operators are experiencing the largest declines across all metrics. Hosts managing 100 or more units account for a quarter of European revenue but are responsible for 79% of the summer demand decrease, losing 2.8 percentage points in occupancy and increasing RevPAR by just 2.5%. In contrast, single-unit hosts are performing better, increasing ADR 9.5% and RevPAR 7.9%.
In August, Europe’s short-term rental market maintained its rate discipline but experienced a decline in volume. Supply increased 1.7%, staying within the narrow range it has maintained since spring, while demand nights fell 3.1%. Occupancy dropped slightly to 70.4%, absorbing the gap. Pricing remained strong, with ADR rising 7.5% and the Repeat Rent Index increasing 6.1%, indicating that most of this growth stems from hosts raising their prices rather than changes in booking patterns. Regionally, growth shifted away from Spain, Germany, and the largest portfolios toward mid-sized professional operators, the Nordics, and the eastern Adriatic.
Looking ahead, forward bookings appear stronger than recent booking numbers suggest. Europe has booked 78 million nights from September to December, a 2.3% rise from the same period last year, with September up 2.4% and October up 4.9%. Out of 42 markets, 31 are growing. Nights booked for August fell 7.3%, but that’s largely because autumn bookings were made earlier this year than last. The share of European reservations made in January and February has also risen every year since 2022, now reaching 25.9%.
At a Glance: August 2026 STR Performance in Europe
- Available listings reached 4.25 million, an increase of 1.7% YoY
- Demand nights declined 3.1% YoY to a total of 66.4 million
- Average daily rates (ADR) increased 7.5% YoY to €160.1
- Average occupancy rate fell to 70.4%, down 2.1pp
- Revenue per Available Rental Night (RevPAR) increased 4.3% YoY to €112.7
August 2026 Key Metrics
| Metric | August 2025 | August 2026 | YoY Change |
|---|---|---|---|
| Available Listings | 4.18 Million | 4.25 Million | 1.5% |
| Demand Nights | 68.5 Million | 66.4 Million | -3.1% |
| ADR | €148.95 | €160.10 | 7.5% |
| Occupancy | 72.50% | 70.40% | -2.1pp |
| RevPAR | €108.06 | €112.74 | 4.3% |
August’s data indicates the market retains pricing power, despite fewer nights being booked. Supply increased 1.7%, maintaining the narrow range seen since spring, but demand nights decreased 3.1%, with occupancy filling that gap. Rates continued to rise, with ADR up 7.5% and the Repeat Rent Index increasing 6.1%. The closeness of the two metrics means that the rate increase was mainly driven by hosts raising their prices rather than changes in booking preferences. The overall picture can be misleading: Spain and Germany account for almost all of Europe’s demand decline, but excluding them, the continent’s demand is flat. A more positive sign lies in future bookings. From September to December, bookings are 2.3% ahead, with 31 of 42 markets showing positive growth.
Summer 2026 Key Metrics
| Metric | Summer 2025 | Summer 2026 | YoY Change |
|---|---|---|---|
| Available Listings | 4.12 Million | 4.19 Million | 1.7% |
| Demand Nights | 178.5 Million | 174.9 Million | -2.0% |
| ADR | €145.84 | €157.16 | 7.8% |
| Occupancy | 68.30% | 66.90% | -1.4pp |
| RevPAR | €99.67 | €105.19 | 5.5% |
The State of the European Economy
The European Central Bank (ECB) decided at its July 23 meeting to keep the three key interest rates stable, after raising rates by 25 basis points on June 17, with a 2% medium-term inflation target still in place. In August, inflation increased slightly to 3.3% in the Euro Area, up from 2.9% in July and its highest level since August 2023. Energy inflation, including electricity, gas, liquid fuels, and fuels for personal transport, stood at 14.3% in August, its highest level since January 2023.
The Economic Sentiment Indicator, which tracks economic activity across five key sectors, and the Employment Expectations Indicator, which measures business managers’ outlook for hiring, both remain below their long-term averages, though both have been recovering steadily from the lows seen in April, when the conflict in the Middle East first weighed on sentiment.
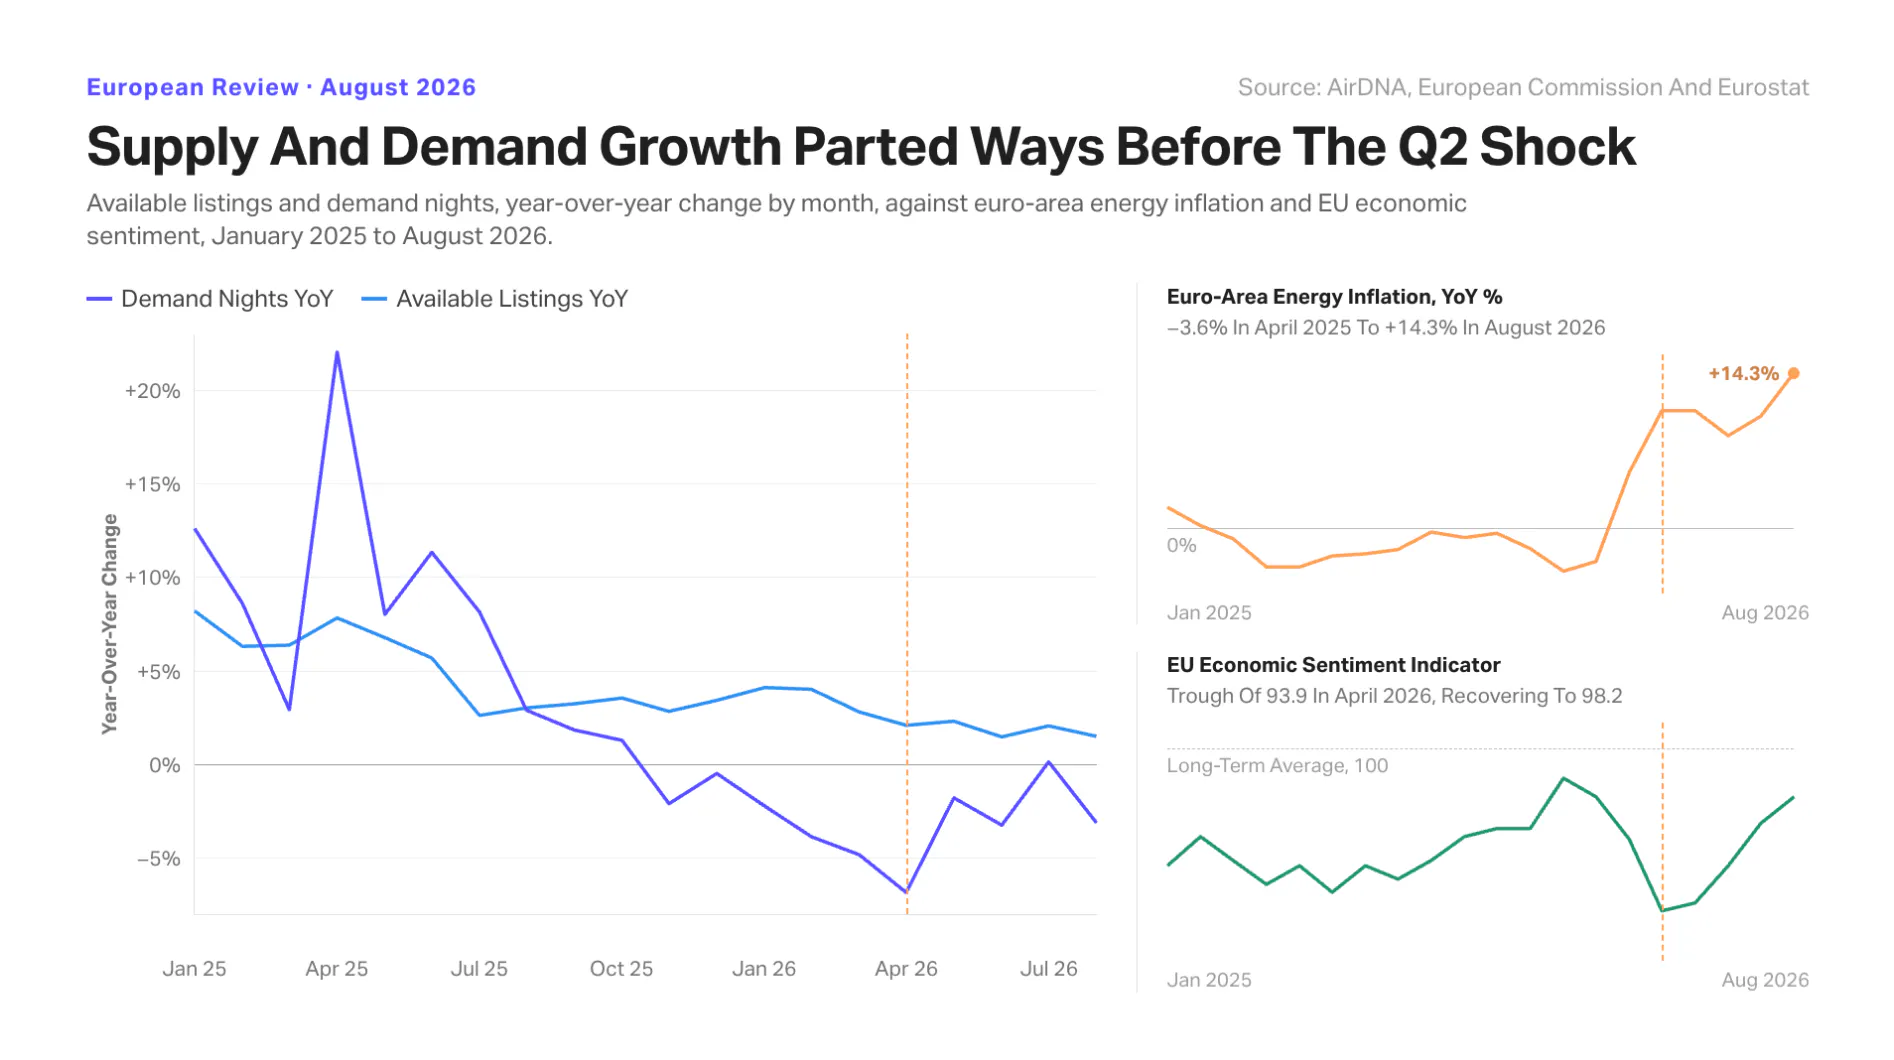
European STR growth occurred in two sequential, non-competing phases. Supply growth steadily declined from 8.2% year over year in January 2025 to about 1.5-2% by mid-2026, while demand night growth turned negative in November 2025. These shifts predate any 2026 shocks, indicating a market normalizing after exceptional growth in 2024 and 2025, rather than a response to interest rates or energy prices.
The Q2 2026 shock then added to this trend. In April 2026, European sentiment dropped sharply as energy inflation shifted from -3% to +11% year over year. Demand and occupancy reached their lowest points of the year, down 6.9% and 5.0 percentage points, respectively. Into summer, the effect continued at a lower level, with occupancy declining 1.4 percentage points from June to August and 2.1 percentage points in August. Rates tracked inflation closely, but moved contrary to sentiment, suggesting hosts raised nightly rates to cover higher costs rather than guests competing for limited inventory. This created a divergence: occupancy fell while RevPAR stayed positive, as rate increases offset volume declines.
Supply Growth Remains Moderate, With Bigger Listings Growing Stronger
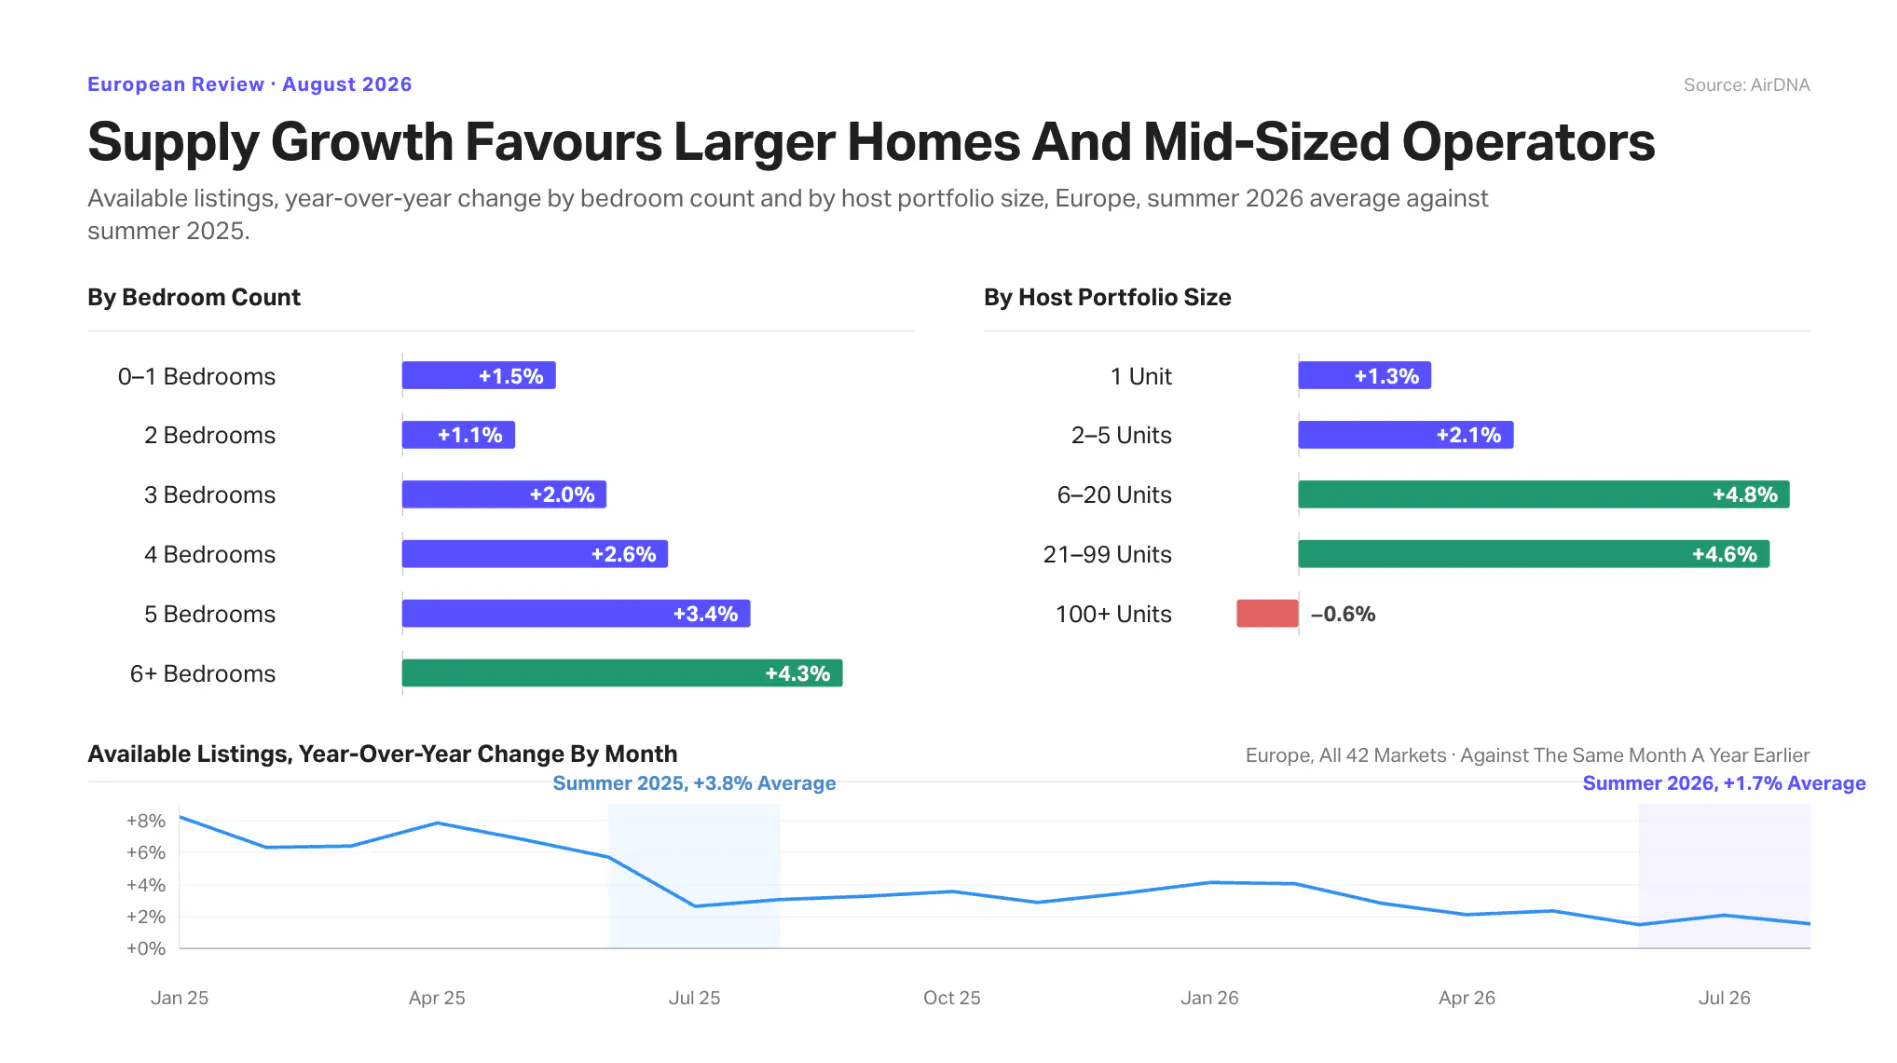
In August, Europe’s supply increased 1.65% year over year, with the summer (June-August) average rising slightly more, at 1.71%. A noticeable reallocation is occurring beneath this overall growth. Smaller, less mature markets are driving most of it: Finland (+11.4% in August, +11.2% for the summer), Albania (+9.6% and +9.4%), Poland (+8.6% and +7.9%), Norway (+8.1% and +8.0%), and Sweden (+7.6% and +8.4%) led the gains. Meanwhile, larger, more mature markets such as France (+2.6% and +3.2%), Italy (+3.6% and +3.8%), the UK (+3.3% and +3.5%), and Germany (+2.2% and +2.7%) grew more slowly. Spain was an exception, declining 8.9% in August and 10.7% over the summer, attributable to delistings that began in summer 2025.
The same reallocation is evident when considering property size and host type. The figures below use summer data to smooth out variability from individual months. Growth favors larger homes. Listings with six or more bedrooms increased 4.3% over the summer, compared with 3.4% for five-bedroom units, 2.6% for four-bedroom, 2.0% for three-bedroom, and just 1.1-1.5% for two-bedroom and studio or one-bedroom units. Despite this, small units with 0-1 bedrooms still account for nearly half of the total supply, indicating that this shift is happening at the margin rather than rapidly changing the overall mix. In terms of host scale, growth was strongest among mid-sized professional operators during the summer. Hosts with 6-20 units increased 4.8%, and those with 21-99 units grew 4.6%, while solo hosts grew just 1.3% and the largest operators, those with over 100 units, declined slightly, down 0.6%.
Spain was the European country to experience the largest available-listing contraction this summer. Supply in Spain remained stable until mid-2025, then declined monthly from September 2025 to a low point in February 2026, before partially rebounding, ending around 10% below the previous summer’s level. This decline coincides with a regulatory delisting order issued around June-July 2025, with removals gradually phased in over subsequent months rather than occurring all at once.
This trend wasn’t isolated to Madrid and Barcelona. Around 75% of Spain’s municipalities saw listings decline this summer, and even the largest cities together account for just around 10% of the total decrease, indicating a widespread, nationwide pullback rather than a local policy affecting specific cities.
In terms of which listings disappeared, it wasn’t merely the cheapest ones. The properties that exited had lower rates and occupancy than those that remained, but this pattern spanned most price segments, not just the lowest. The removed listings were generally weaker performers spread throughout the market, predominantly involving smaller, less-established hosts, rather than a straightforward removal of budget inventory.
| Cluster | Country | Summer 2026 | YoY % |
|---|---|---|---|
| Top 5 | France | 1,097,438 | 3.2% |
| Italy | 579,060 | 3.8% | |
| United Kingdom | 413,164 | 3.5% | |
| Spain | 393,532 | -10.7% | |
| Germany | 367,242 | 2.7% | |
| >75 Thousand Available Listings | Croatia | 177,348 | -2.9% |
| Greece | 160,615 | -2.1% | |
| Portugal | 123,557 | 3.9% | |
| Poland | 89,982 | 7.9% | |
| Denmark | 79,928 | 5.5% | |
| >50 Thousand Available Listings | Norway | 74,760 | 8.0% |
| Sweden | 67,521 | 8.4% | |
| Austria | 63,999 | 1.9% | |
| Netherlands | 54,827 | 0.7% | |
| Switzerland | 54,029 | 3.1% | |
| >28 Thousand Available Listings | Belgium | 41,023 | -3.3% |
| Romania | 36,792 | 4.6% | |
| Albania | 32,848 | 9.4% | |
| Finland | 30,152 | 11.2% | |
| Ireland | 29,453 | 3.6% |
Spain and Germany Drive Decline in Demand Nights
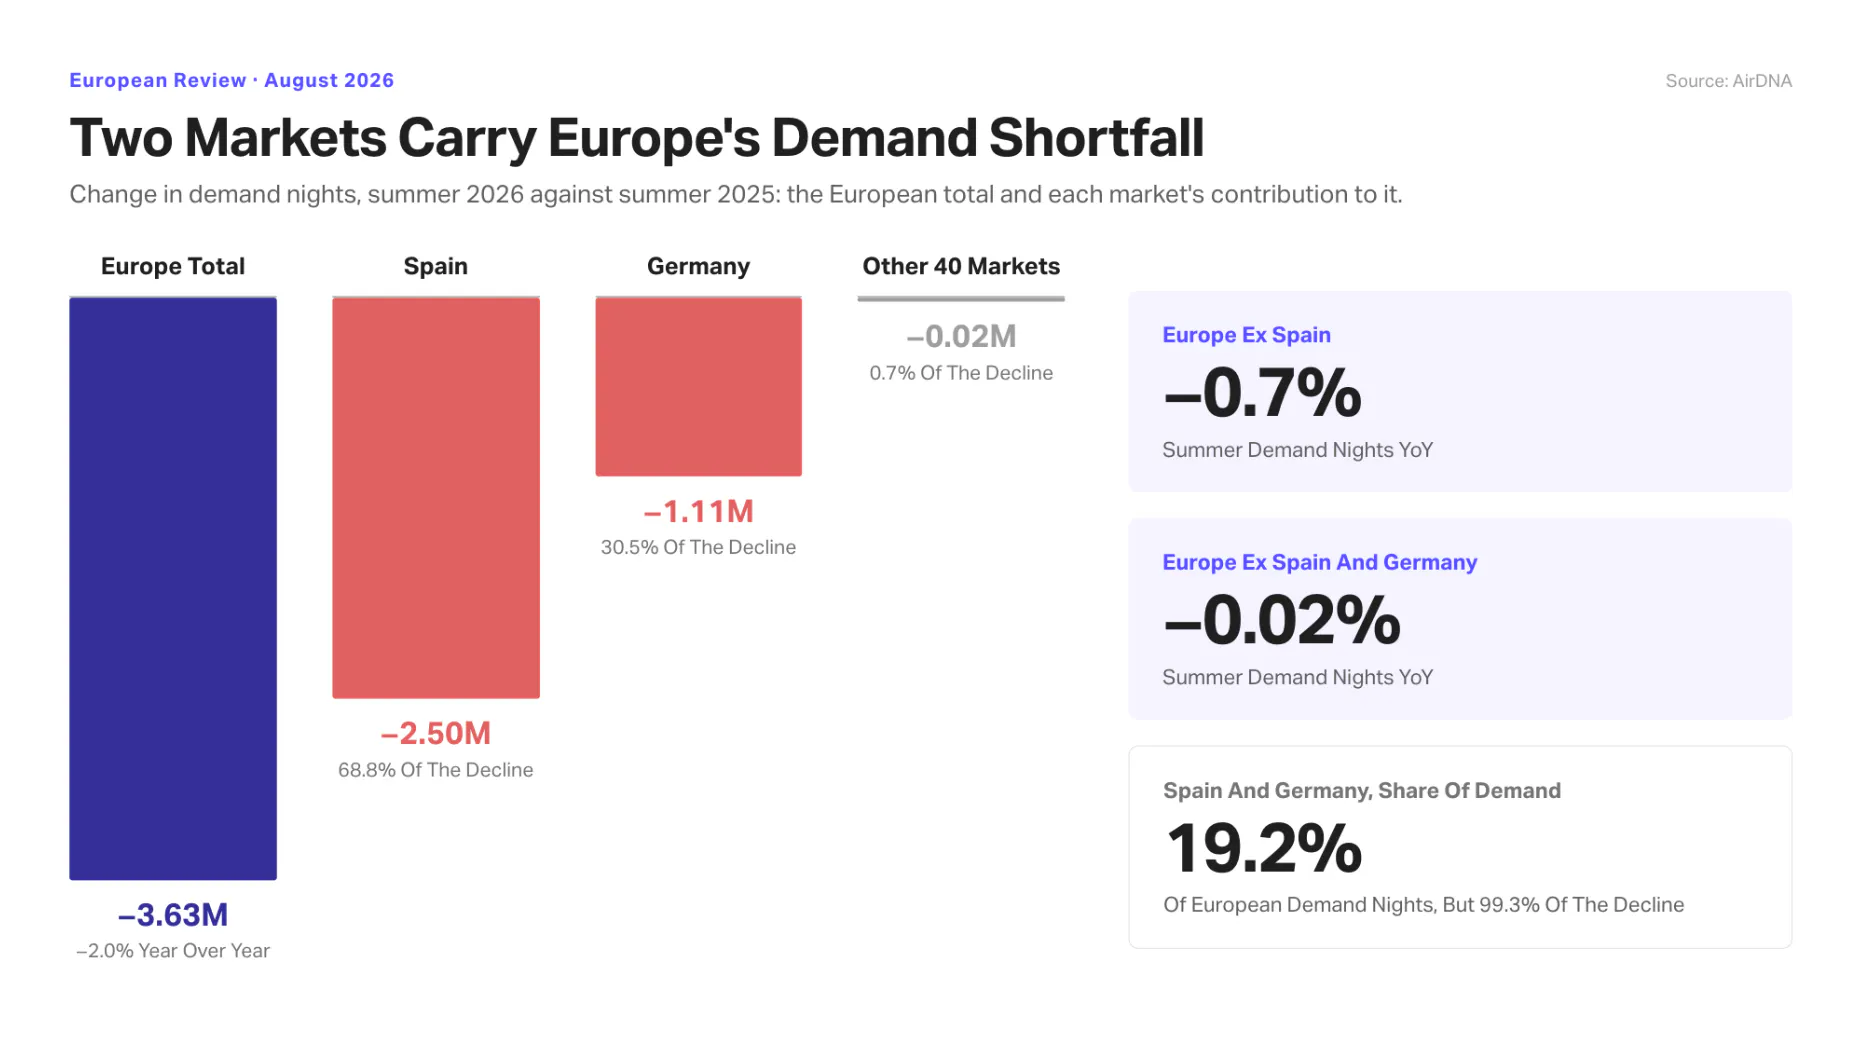
Demand nights across Europe totaled 66.4 million in August, a 3.1% decrease year over year. The summer period (June to August) summed to 174.9 million nights, down 2.0%. Meanwhile, available listings increased 1.7% in both the August and summer periods. This divergence, more listings competing for a slightly smaller demand pool, explains the occupancy decline: a 2.1 percentage point drop in August to 70.4%, and a 1.4 percentage point decrease for the summer to 66.9%. During the summer, eleven markets representing 42.6% of European demand saw an increase in supply but a drop in demand; that expanded to fourteen markets and 58.7% of demand share in August.
The apparent headline decline is much narrower than it seems. Spain alone accounts for 68.8% of Europe’s 3.6 million-night summer shortfall, with Germany contributing an additional 30.5%. Removing Spain from the figures reduces the summer decline across the continent to just 0.7%. Removing Germany as well brings European demand to a nearly stable -0.02%. Although August shows a slightly larger decline, excluding both markets still results in just a 1.3% drop. During the summer, 23 of Europe’s 42 markets experienced demand growth while 19 contracted. Spanish demand fell 12.5% over the summer and 14.3% in August, closely mirroring its regulatory supply reduction, while Croatia saw a summer decline of 9.6%. In contrast, Italy (+0.8%) and the UK (+1.6%) grew, while France declined (-1.4%). Smaller, frontier markets performed strongly: Albania (+19.7%), Sweden (+7.8%), Poland (+6.4%), and Norway (+5.0%).
Demand by bedroom count mirrors supply. Two-bedroom listings were Europe’s weakest segment, declining 3.2% over the summer. Combined with studios and one-bedroom listings, they represent around 90% of the continent’s decline, as they account for 80% of demand. Listings with five or more bedrooms were almost unchanged, falling just 0.2% and 0.3%, but these segments experienced the fastest supply growth, at 3.4% and 4.3%. Despite stable demand, this increased supply caused the steepest occupancy drops, 1.8 and 2.4 percentage points, compared with 1.2 percentage points for smaller units. Larger-scale hosts, with 100 or more units, control 17.3% of European demand but contributed to 79% of the summer decline, with demand down 8.7% and supply nearly steady, 0.6% lower. Occupancy dropped 2.8 percentage points, nearly triple the 1.0 percentage point decrease seen with single-unit hosts. Mid-scale operators, with 6-20 and 21-99 units, increased demand 2.4% and 1.4%, respectively.
Digging Deeper Into Germany’s Demand Decline
Germany was the second-largest contributor to Europe’s summer shortfall, with demand nights falling 6.5% from June to August and 5.6% in August alone. Unlike Spain, this decline isn’t due to supply leaving the market. German available listings increased 2.7% over the summer and grew across all bedroom categories, with occupancy dropping 2.5 percentage points during the summer and 3.1 percentage points in August. Two-bedroom listings remained the weakest segment, with demand falling 10.0%, accounting for half of Germany’s overall decline.
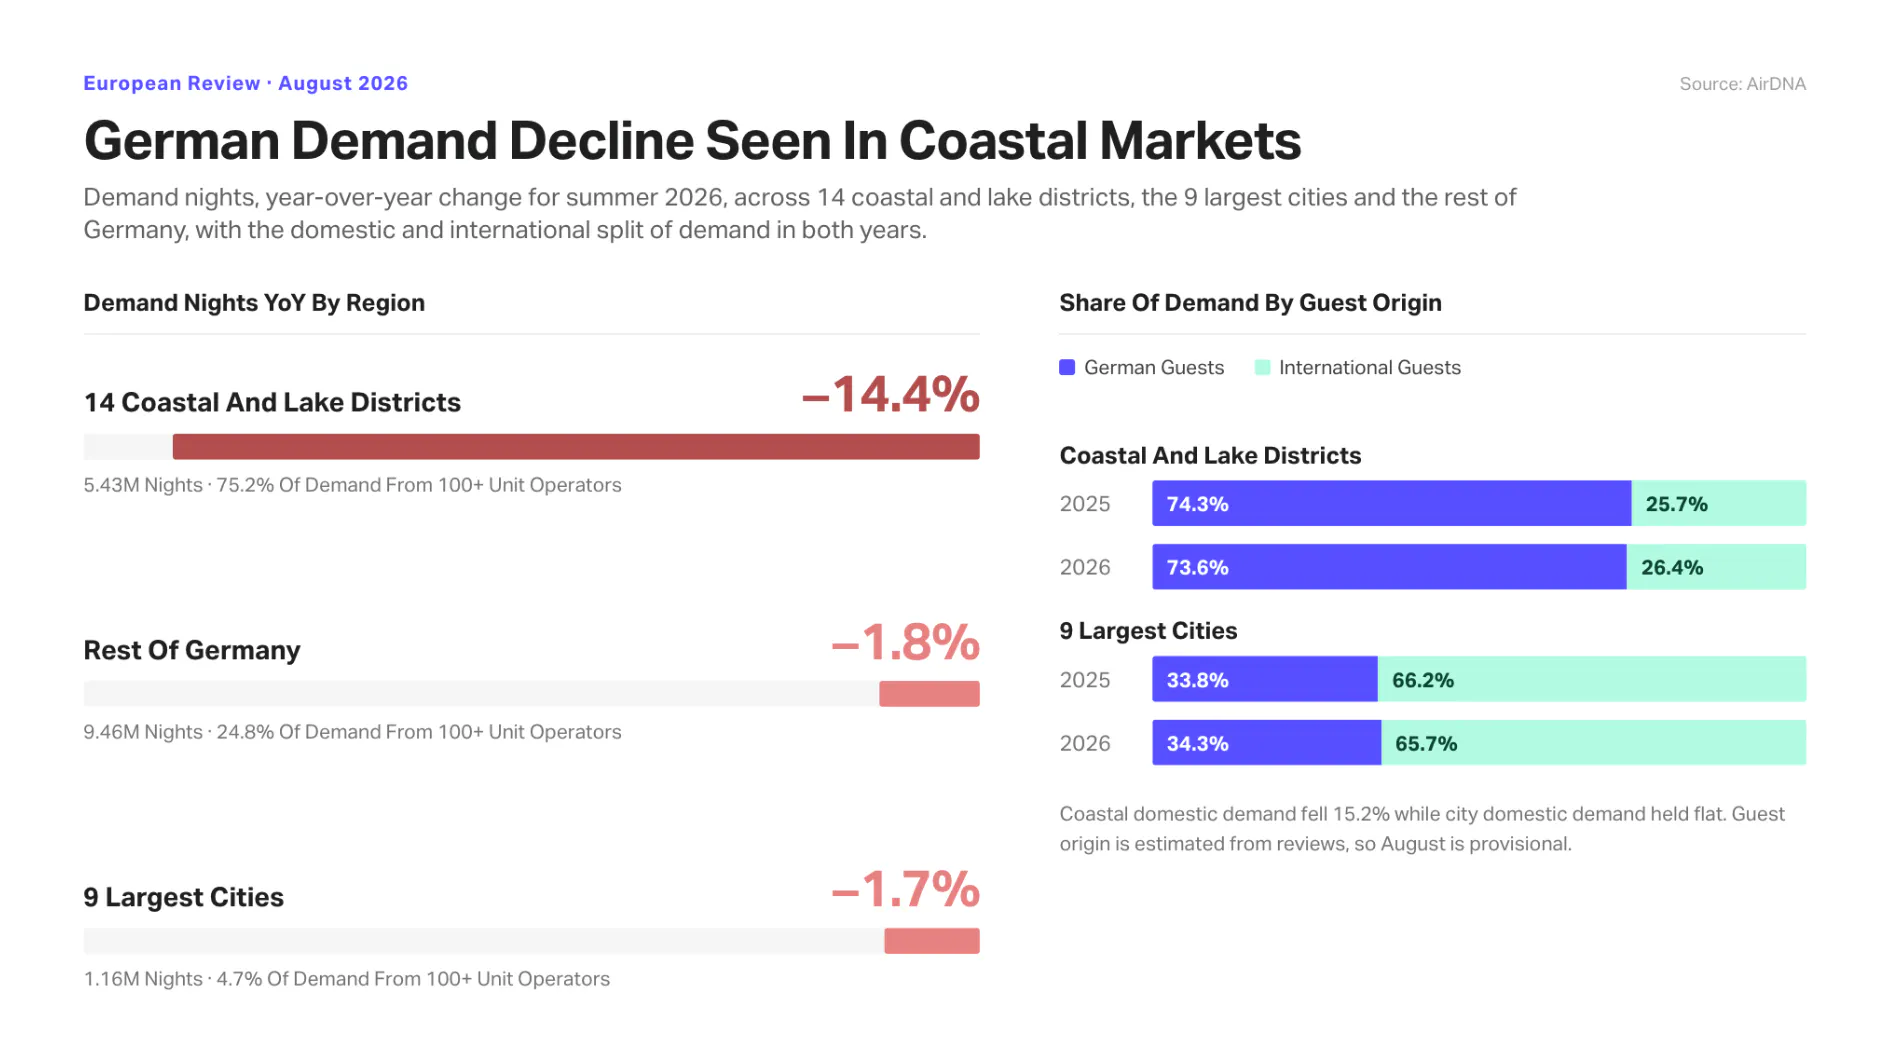
The decline, broken out by region, is nearly exclusively coastal. Across fourteen holiday districts by the Baltic, North Sea, and lakes, demand fell 14.4% over the summer. Landkreis Vorpommern-Rügen, the largest, declined 14.5% despite a 1.0% increase in supply, while Kreis Nordfriesland fell 14.7% with 1.6% supply growth. Further along the coast, declines steepen: Landkreis Wittmund (-28.8%), Landkreis Friesland (-26.8%), and Kreis Dithmarschen (-26.4%).
In contrast, Germany’s nine largest cities saw minor declines in demand of 1.7%, with Berlin increasing 1.1% and Hamburg nearly flat at a 0.5% decrease. In August, Berlin grew 3.3% and Hamburg 7.5%. More markets saw demand increase than decrease, 216 versus 186. This pattern reflects a localized retreat, primarily in seaside and lake regions where Germans vacation, and closely correlates with operator scale. Coastal districts depend on operators with 100 or more units for 75.2% of their demand, compared with just 4.7% in major cities. Demand for large operators fell 17.3% along the coast and 19.3% across the rest of Germany, but held flat in the major cities, at 0.1% growth.
Guest origin confirms what geography suggests. German guests reduced their domestic travel 8.7% over summer, while international demand into Germany dropped just 3.1%, raising the international share of German demand 1.4 percentage points to 41.3%. Coastal districts, which rely 73.6% on German guests, saw a 15.2% decline in domestic demand. In major cities, domestic demand remained stable at 34.3%, with two-thirds of visitors international. The largest decreases among international sources came from Germany’s nearby neighbors: Austria (-14.6%), Switzerland (-13.0%), and Denmark (-12.8%). The Netherlands was the only major market to grow, by 6.2%. Guest origin data, based on reviews arriving weeks after checkout, makes August’s figures provisional. However, June and July show similar trends, with domestic demand down 9.0% and coastal domestic demand down 15.7%.
Rate Growth Broadens Across Europe
In August, average daily rates (ADR) in Europe hit €160, marking a 7.5% increase year over year, with the summer period averaging €157, up 7.8%. Since March, monthly rate growth has consistently ranged from 5.7% to 8.3%. The Repeat Rent Index, which accounts for the same listings over time to exclude market entry or exit effects, grew 6.1% in August and 5.6% over the summer.
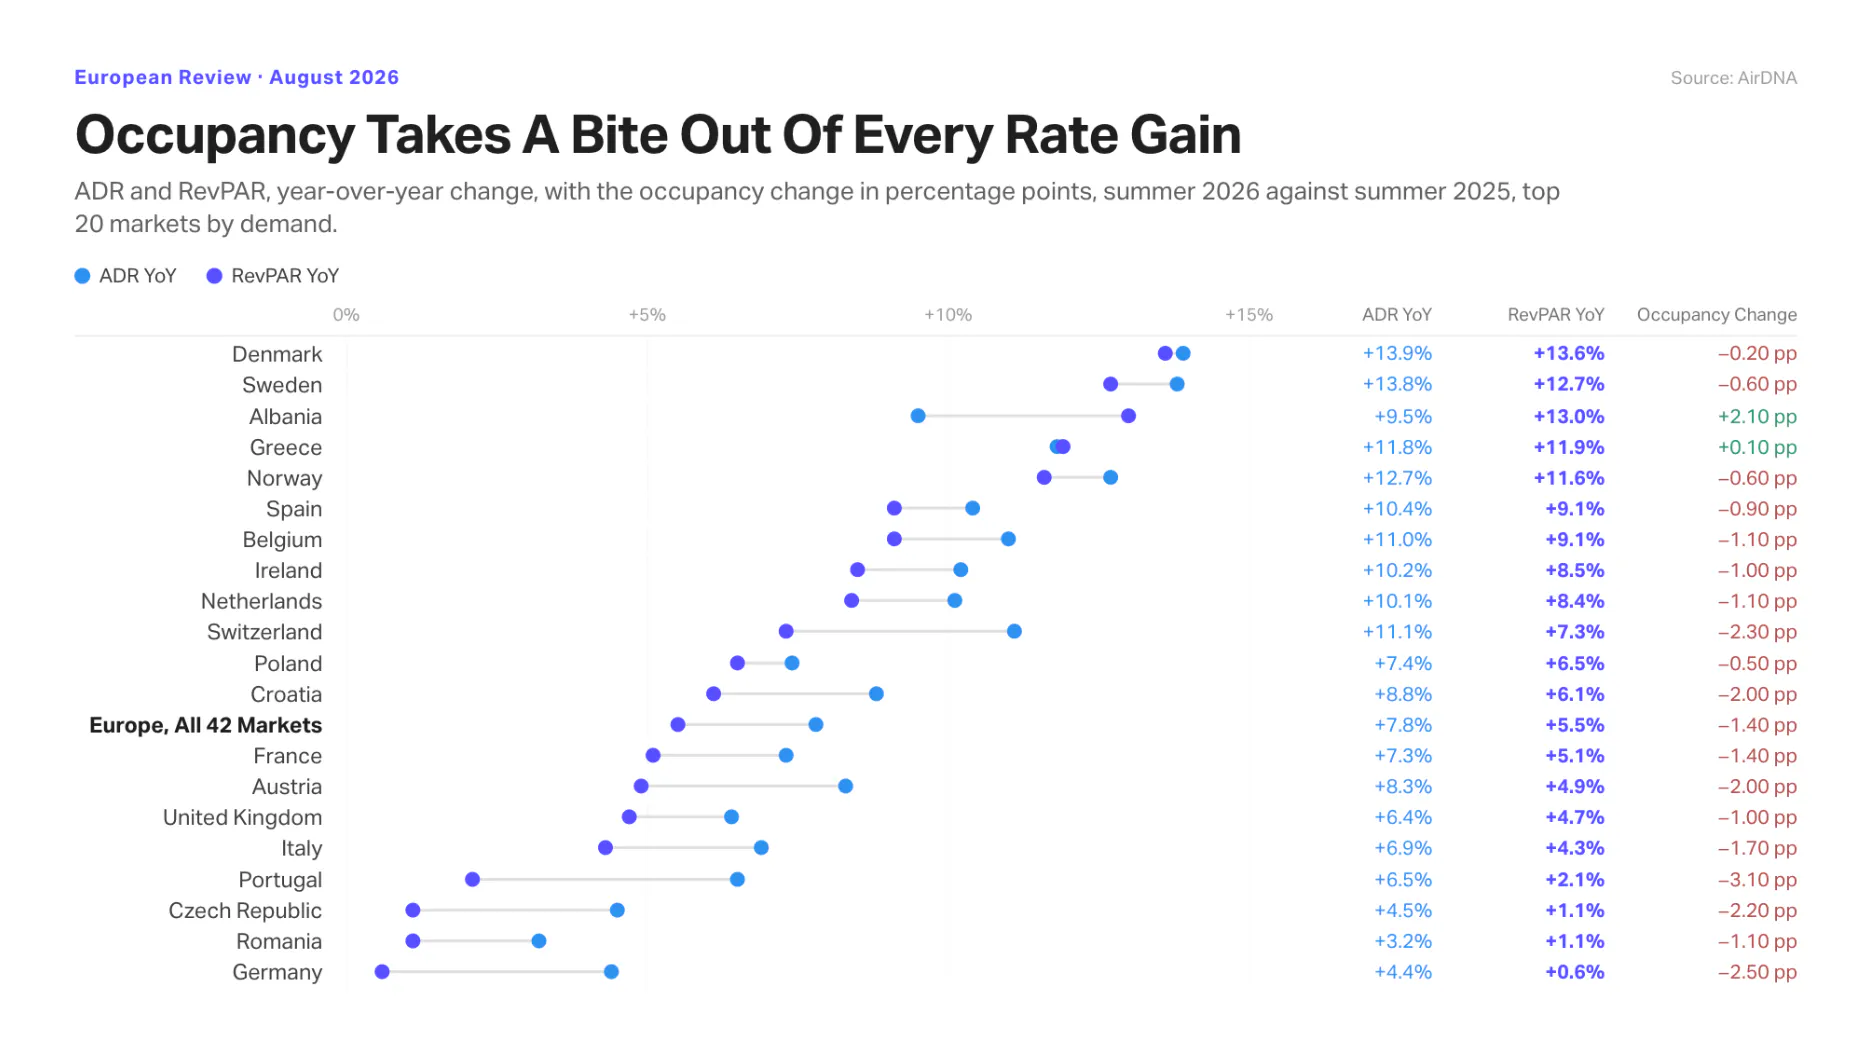
This summer’s strength was widespread: all 20 of Europe’s largest markets recorded year-over-year ADR growth in both August and the summer, suggesting rate growth is now a continent-wide phenomenon affecting both markets with rapid supply growth and those with shrinking inventories.
RevPAR Gains Are Rate Gains, With Occupancy Working Against Them
In August, RevPAR hit €113, marking a 4.3% increase year over year, while over the summer it was €105, up 5.5%. Both periods showed a similar pattern: in August, ADR added 7.5 percentage points to growth, but occupancy fell 2.1 percentage points to 70.4%. During the summer, the difference was smaller but followed the same trend, with a 7.8% rate increase and a 1.4 percentage point drop in occupancy to 66.9%. Nearly two-fifths of Europe’s rate growth was lost to fewer bookings before it translated into higher revenue.
The mechanism is the supply and demand balance discussed earlier. Listings increased 1.7%, while demand nights fell 3.1% in August and 2.0% over the summer, resulting in more properties competing for fewer nights. Occupancy absorbed this imbalance and was affected almost everywhere: among Europe’s top 20 markets, just Albania saw a significant rise, up 2.1 percentage points, while Greece was nearly unchanged, at 0.1. All other major markets saw occupancy decline compared with last year and relied on higher rates to maintain revenue. Nearly all succeeded, with RevPAR rising across all 20 markets during summer, although August’s tightening caused two to fall into negative territory.
Rate Growth Rises With Property Size, and So Does the Cost in Occupancy
Across different property sizes, rate growth consistently increased with the number of bedrooms, from 6.5% for studios and one-bedroom listings to 7.7% for two-bedroom, 8.2% for three-bedroom, and 11.6% for homes with six or more bedrooms, the highest growth among European segments. The occupancy penalty also rose steadily, from 1.2 percentage points at the smallest size to 2.4 percentage points at the largest, reaching 3.0 percentage points for the biggest homes in August. Consequently, a 5.1 percentage point rate-growth advantage translates into just a 2.1 percentage point RevPAR advantage. Larger homes in Europe enjoy the strongest rate increases but occupy fewer nights, especially as supply expands most rapidly in segments with the softest demand.
Germany Is the One Market That Could Not Price Its Way Out
August’s two declining markets in terms of RevPAR were Romania, down 0.3%, and Germany, down 0.5%. Germany, which has the greater scale, experienced the weakest rate growth among major European markets, with a 4.4% increase over summer and 3.9% in August, less than half the growth of Spain (10.4%) or Greece (11.8%). It also faced the largest occupancy decrease among the top five markets, with a 2.5 percentage point drop in summer and 3.1 percentage points in August. This resulted in German RevPAR rising just 0.6% during summer before turning negative in August, compared with Spain (+9.1%), France (+5.1%), the UK (+4.8%), and Italy (+4.3%).
Nights Booked Falling Faster Than Demand Nights
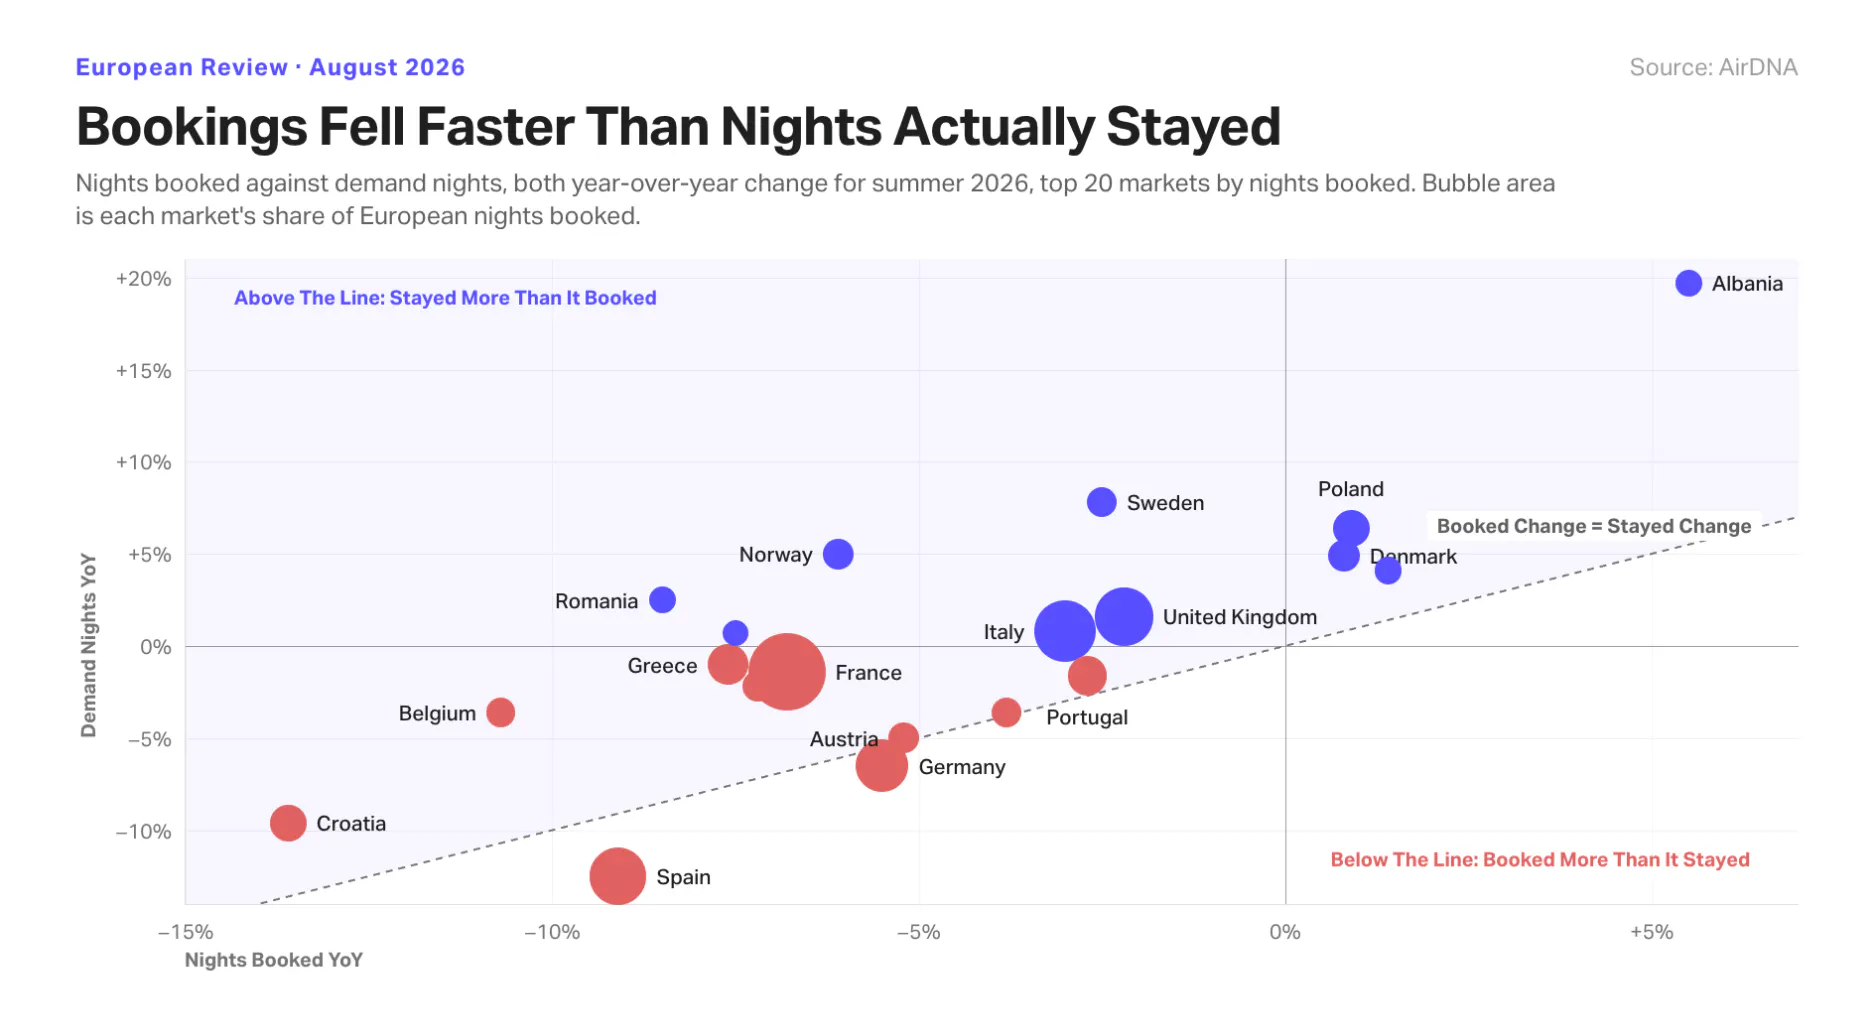
Adjusted nights booked, which counts reservations written during a month for any future stay date, fell 7.3% in August and 5.2% across the summer. Across January to August the series is down 5.0%. That is roughly two and a half times the decline in nights actually stayed, which fell 2.0% over the summer, so forward commitment is weakening faster than realized travel. Just four of the top 20 markets grew bookings over the summer, narrowing to two in August alone.
France accounts for 31.9% of Europe’s summer booking shortfall on 24.2% of volume, and Spain a further 19.6% on 10.8%, so those two markets carry over half the continental decline between them. Croatia is the weakest market in Europe on this measure, down 13.6% for the summer and 21.2% in August, and it is one of just two large markets where forward bookings fall faster than realized demand. Spain runs the other way, with bookings down 9.1% against demand down 12.5%.
The clearest structural signal is that bookings keep moving earlier in the year. The share of European bookings written in January and February has risen every year since 2022, from 23.3% to 25.9%.
Pacing & Shoulder Season Travel
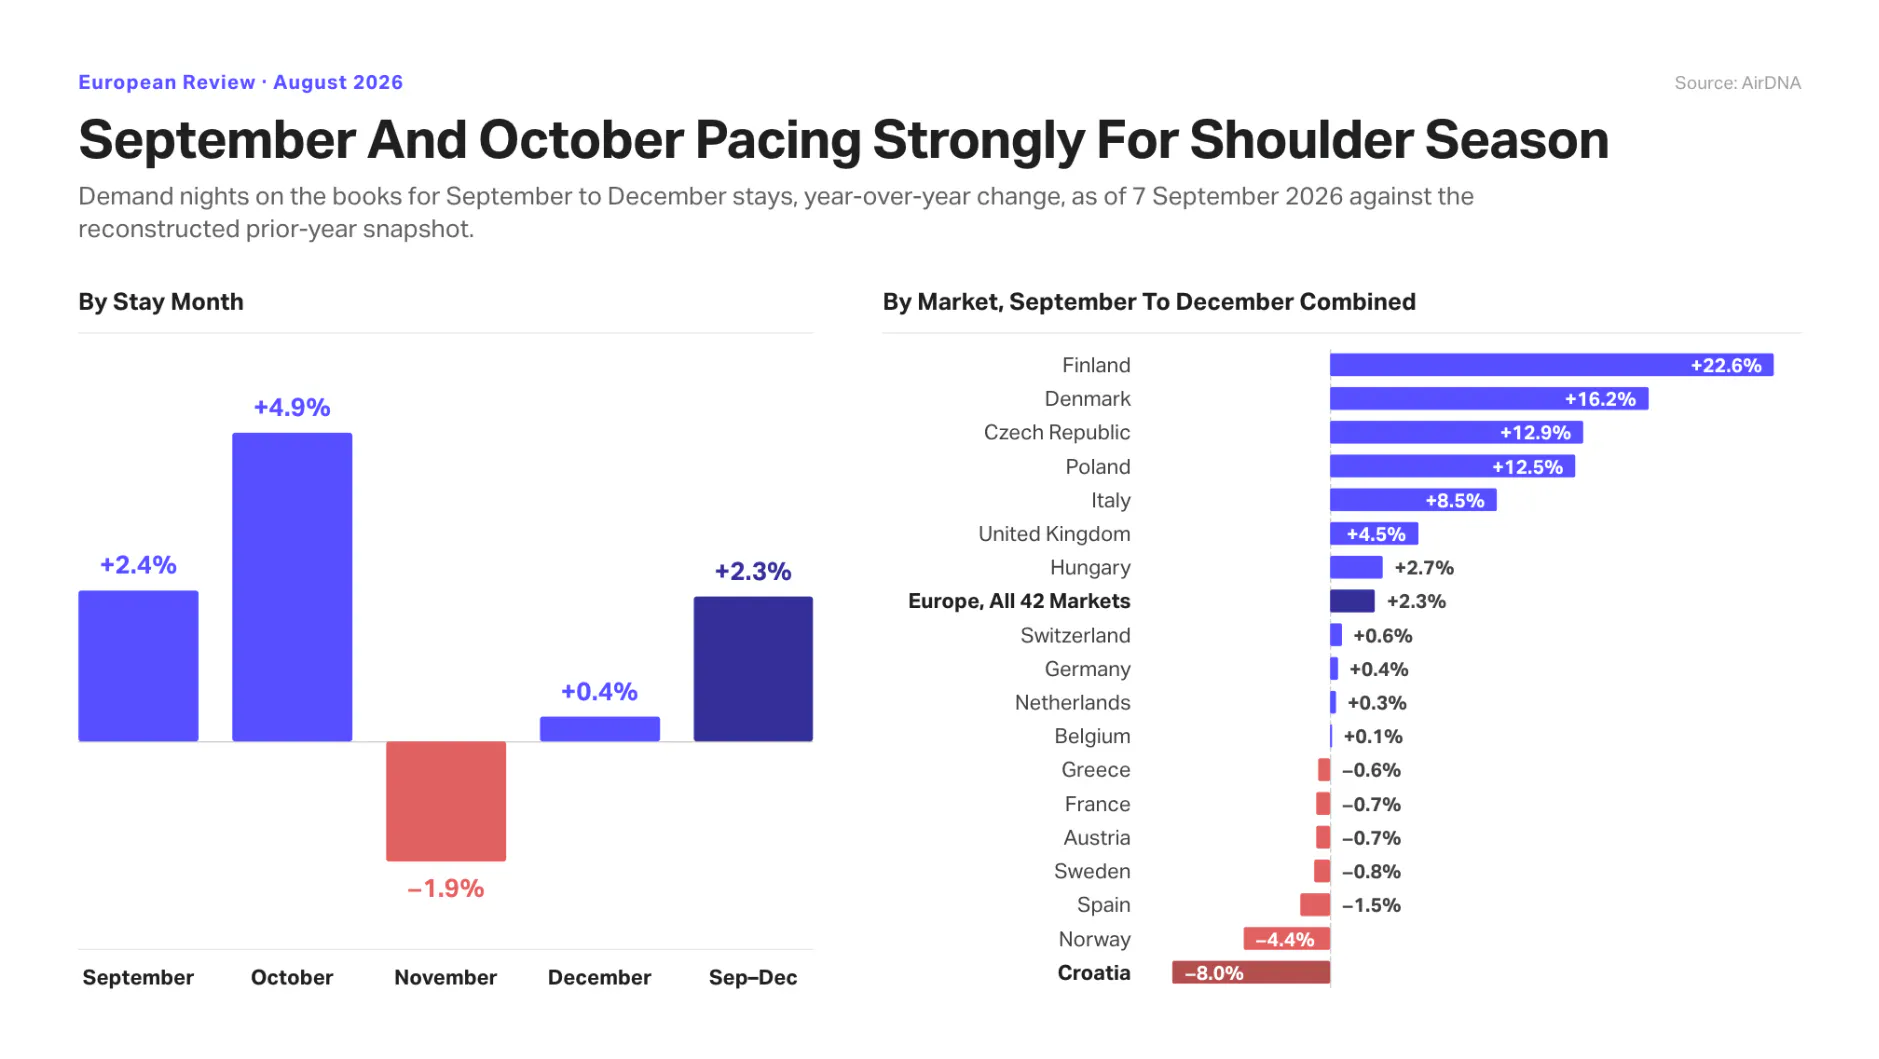
Europe’s demand nights total 77.9 million from September to December, a 2.3% increase compared with last year. September is 2.4% ahead, and October is 4.9% ahead, while November trails by 1.9%, and December remains almost flat, with a 0.4% change. Out of 42 markets, 31 are ahead. Since November and December each account for around 20% of September’s booking volume and are still early in the booking cycle, they will likely fill up significantly between now and the end of September.
The forward book generally follows the same geographic pattern as realized summer demand. Finland leads (+22.6%), followed by Denmark (+16.2%), the Czech Republic (+12.9%), and Poland (+12.5%). Among the larger markets, Italy shows the strongest growth (+8.5%), while the UK grows 4.5%. France, Spain, Germany, Austria, and Greece all hover close to flat growth, within one percentage point of zero. Croatia remains the weakest link, with an 8.0% shortfall, reflecting ongoing contraction in both its realized demand and bookings.
Seasonal Concentration Increases, With July Making Up For a Higher Share of Demand
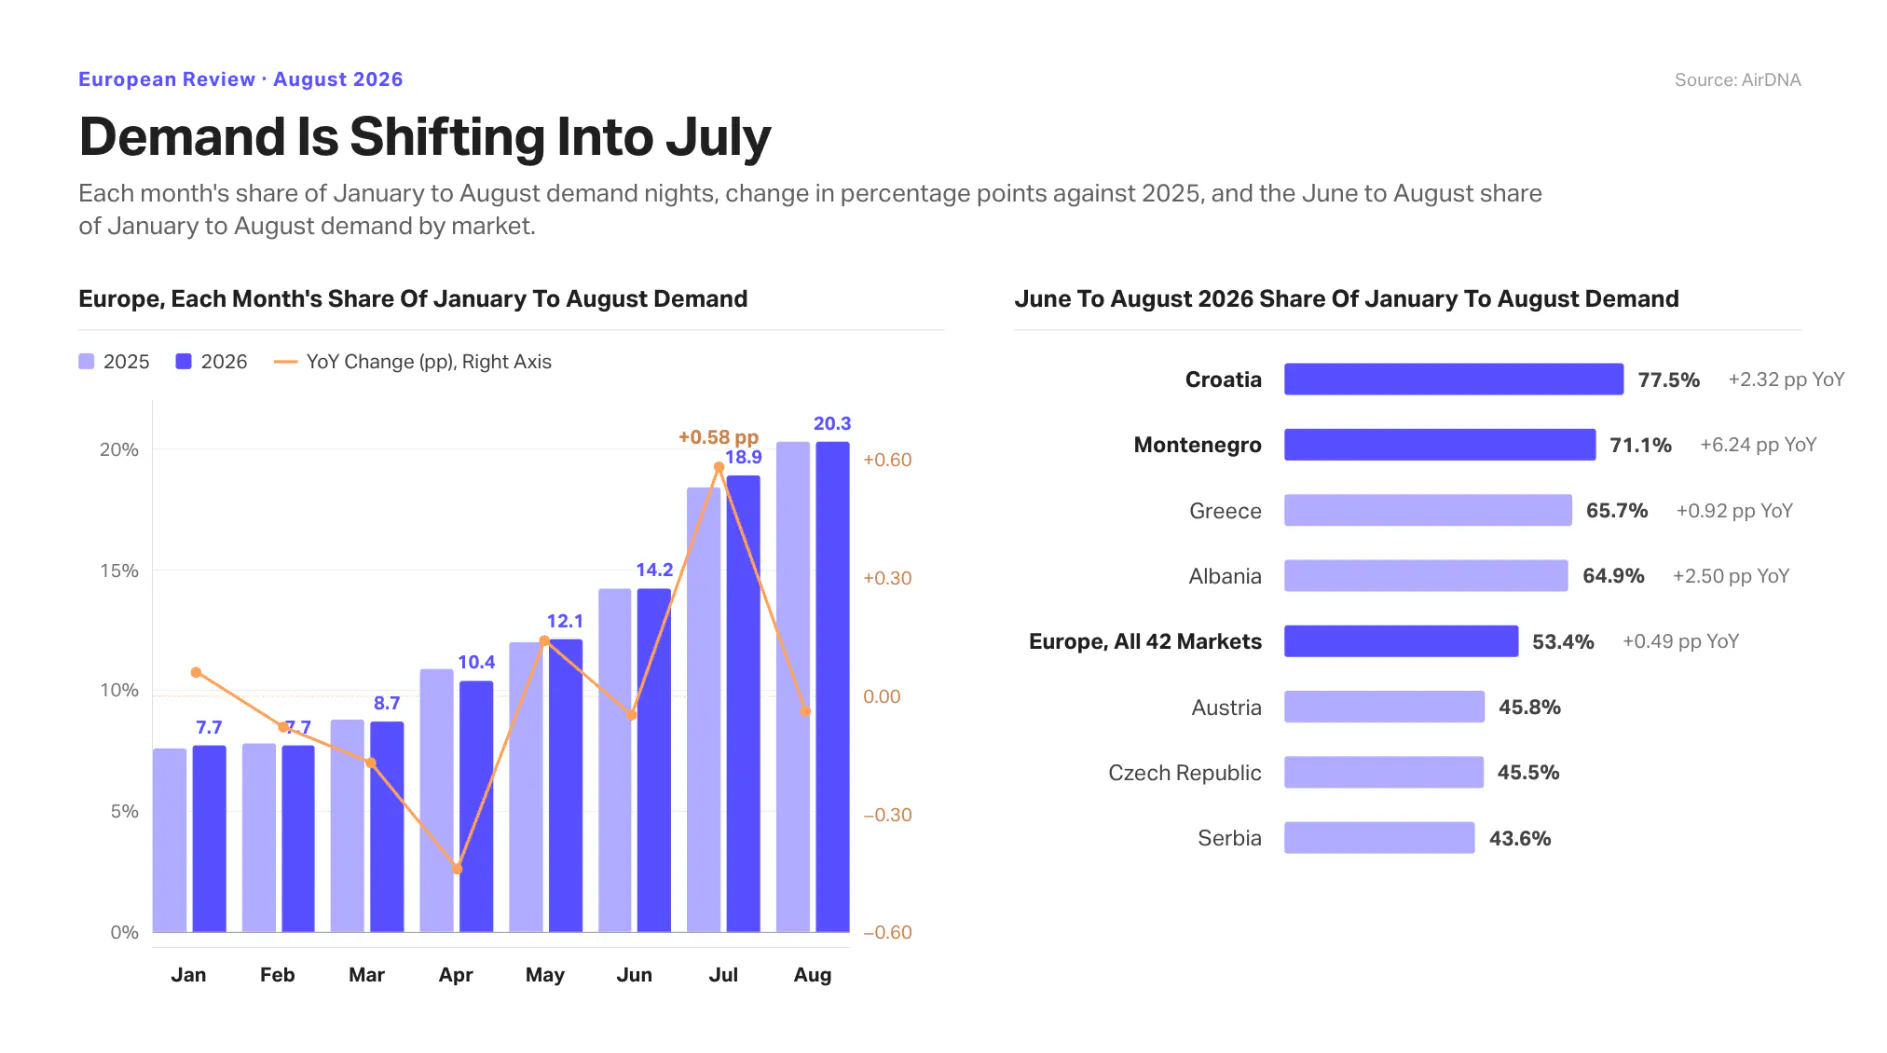
Europe realizes 53.38% of its demand from January to August during the three summer months, up from 52.89% last year. August remained unchanged at 20.25%, close to last year’s 20.30%, while July gained 0.58 percentage points and June slipped 0.05 percentage points. All 20 of the largest markets saw July’s share rise, with gains ranging from 0.31 percentage points in Germany to 2.03 in Sweden. This unanimous shift suggests the seasonal peak is moving about a month earlier.
Concentration levels across Europe vary significantly beyond the continental average. Croatia has the highest demand concentration in June-August (77.48%), the most concentrated market of its size, followed by Montenegro (71.11%), Greece (65.70%), and Albania (64.89%). Conversely, the Czech Republic (45.50%), Austria (45.78%), and Serbia (43.56%) have flatter demand shares. This difference shapes how a weak August affects each market: a sluggish August drags down a larger share of Croatia’s annual demand than Austria’s.
Most increases in concentration occur in smaller markets, with a few exceptions. Montenegro’s rise of 6.24 percentage points marks the largest shift in Europe, followed by Iceland (+2.61), Albania (+2.50), and Bosnia-Herzegovina (+1.64). Sweden and Denmark also gain 2.81 and 2.48 percentage points, respectively, concentrated mostly in July, which alone accounts for 2.03 and 1.70 percentage points. Among larger markets, smaller but steady increases appear: the UK gains 1.00 percentage point, Greece 0.92, and France 0.83.
Croatia is the exception: its summer share rises 2.32 percentage points to the highest in Europe, even as its total demand declines 9.6% over the same period. This means its rising share reflects faster contraction in the shoulder and off-peak seasons, not August strength.
Coolcation Trends
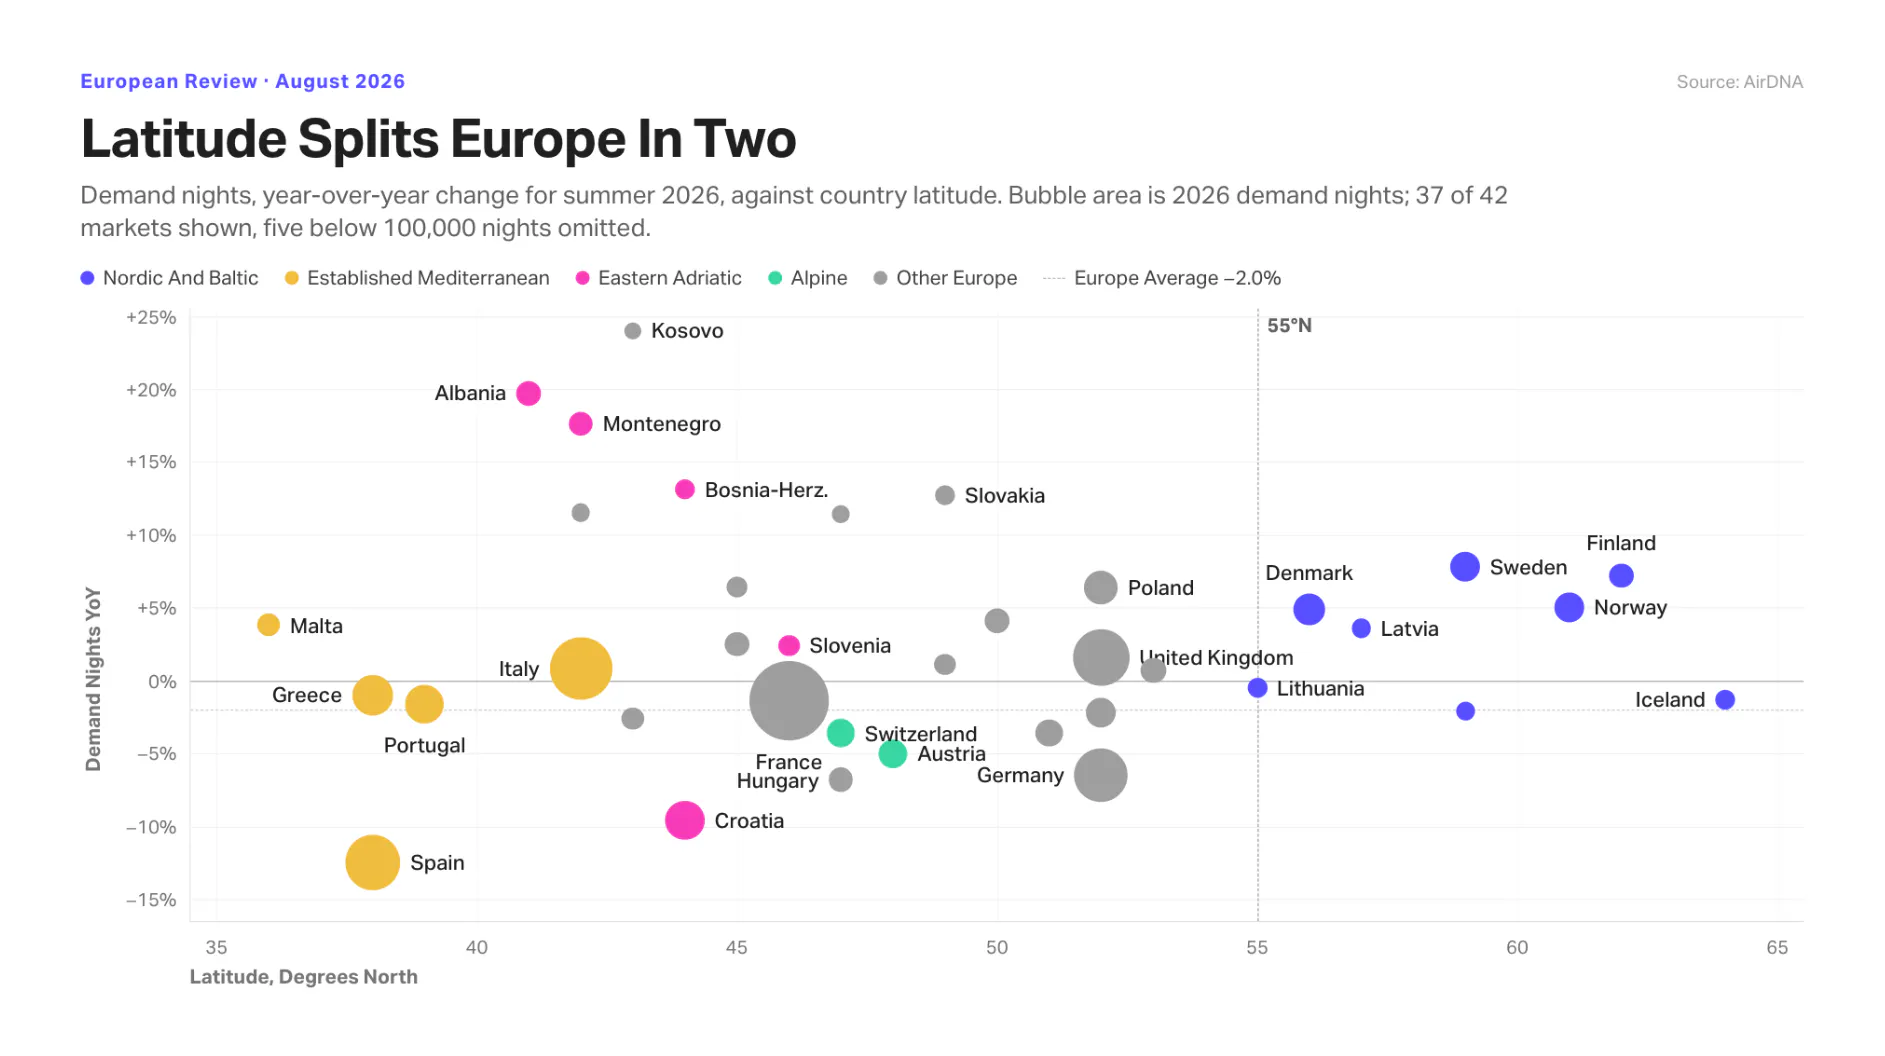
The eight markets located at or above 55 degrees north experienced a 5.2% increase in demand this summer, compared with a 2.5% decline in all other areas below that latitude. These northern markets also saw a smaller occupancy decline, 0.78 percentage points versus 1.44 elsewhere.
The decline in the far south looks worse than it is. Excluding Spain, the sub-40 degree band shows a -1.0% change rather than -7.6, and excluding Croatia, the 40 to 44-degree band turns positive, at +2.2%. Removing both countries, all areas below 55 degrees decline just 0.7%. The northern region is diverse: Sweden (+7.8%), Finland (+7.2%), Norway (+5.0%), and Denmark (+4.9%) grow, while Iceland (-1.3%) and Estonia (-2.1%) decline.
The fastest growth in Europe, though, occurs not in the north but along the eastern Adriatic coast, where Albania (+19.7%) and Montenegro (+17.6%), both at 41 and 42 degrees latitude, outpace every market above 55 degrees. These four eastern Adriatic markets (excluding Croatia) collectively grew 14.8% and added 1.80 percentage points to occupancy. Croatia’s weak headline numbers mask this internal shift. As Croatia loses roughly 0.7 million nights, its four neighboring markets gain around 0.4 million, meaning around 61% of Croatia’s demand loss reappears nearby.
FAQs
Why did Europe’s RevPAR rise in August 2026 if occupancy fell?
RevPAR rose 4.3% because ADR grew 7.5%, more than enough to offset a 2.1 percentage point drop in occupancy. Hosts raised rates rather than relying on more nights booked, so the gain is a pricing story, not a demand story.
Which countries are driving Europe’s demand decline?
Spain and Germany. Spain alone accounts for 68.8% of Europe’s summer demand shortfall and Germany for another 30.5%. Excluding both, European demand nights are nearly flat for the summer.
Is the slowdown in German demand tied to lost supply?
No. German available listings actually grew 2.7% over the summer. The demand decline is concentrated in coastal and lake districts, down 14.4%, driven mainly by an 8.7% drop in domestic German travel.
How are September and October pacing compared with last year?
Both months are ahead: September demand nights are pacing 2.4% ahead of last year and October 4.9% ahead, with 31 of 42 markets showing growth for the September-to-December period.
ARTICLE SUMMARY
Europe’s short-term rental market held its pricing power in August 2026, with RevPAR up 4.3% year over year even as occupancy softened. ADR gains, not stronger bookings, drove the growth, while Spain and Germany accounted for nearly all of the region’s demand decline.
Camilo Schmid Rivas
Senior Research Analyst
Camilo Schmid Rivas is a Senior Research Analyst at AirDNA who brings a uniquely well-rounded perspective to short-term rental analytics. With a background that spans investment, real estate, and business analysis—including roles at Stayery and Sollers Consulting—Camilo has worn many analyst hats, each sharpening his ability to turn complex data into clear, actionable insights. A graduate of École hôtelière de Lausanne, he now channels his multidisciplinary expertise into uncovering trends that drive smarter STR decisions. In his free time, he enjoys playing tennis or scuba diving in or around Barcelona.