

 Calculate Revenue
 Research Markets
 Find For Sale Properties
 Compare My Listing
 STR Revenue Calculator
 Custom Comp Sets
 Submarket Insights
 Custom Search Filters
 Rate Recommendations
 Performance Benchmarking
 Competitor Comparison
 Owner Contact Details
 Property-level performance data
 Tourism Insights
 Real Estate Investment Analytics
 About Us
 Sales
Sales Support
 Press
PressEuropean Review September 2026: Europe Earns More From Fewer Nights
Published: October 8, 2026

Camilo Schmid Rivas
Key Takeaways
- RevPAR rose 9.1% to €78.1, driven by ADR. ADR increased 8.9% to €141.0 while occupancy held flat at 55.4%, and the Repeat Rent Index rose 6.5%, so most of the gain came from existing hosts charging more.
- Demand nights fell 1.2%, with Spain accounting for 77% of the net loss. Excluding Spain, European demand nights were almost flat (-0.3%), and Italy added 236,000 nights.
- Hot-summer cities had a stronger September than summer. In the ten strongest shoulder markets, led by Seville, Munich and Turin, average daily demand nights in September ran 24.6% above June to August, and ADR rose 12.4% on September 2025.
In September, Europe’s short-term rental market earned more from fewer nights. Supply grew just 0.4%, its weakest September for supply growth since 2021, demand nights fell 1.2% and occupancy held at 55.4%, while ADR rose 8.9% and RevPAR 9.1%. Spain drove the volume loss as licensing rules shrank its supply, while Italy, Poland and the UK grew. Looking ahead, nights on the books stood 1.1% above last year for October and 3.8% below for November. Early bookings have run ahead of final results all year, so November will likely finish somewhat weaker, in line with this year’s run of declines.
At a Glance: September 2026 STR Performance in Europe
- Available listings reached 4.04 million, an increase of 0.4% YoY
- Demand nights declined 1.2% YoY to a total of 46.4 million
- Average daily rates (ADR) increased 8.9% YoY to €141.0
- Average occupancy rate rose to 55.4%, up 0.1pp
- Revenue per Available Rental Night (RevPAR) increased 9.1% YoY to €78.1
September 2026 key metrics
| Metric | September 2025 | September 2026 | YoY Change |
|---|---|---|---|
| Available Listings | 4.02 Million | 4.04 Million | 0.4% |
| Demand Nights | 46.9 Million | 46.4 Million | -1.2% |
| ADR | €129.49 | €141.02 | 8.9% |
| Occupancy | 55.3% | 55.4% | +0.1pp |
| RevPAR | €71.55 | €78.06 | 9.1% |
The State of the European Economy: Inflation Rose to 3.8%
Euro area inflation rose for a third consecutive month, to 3.8% in September from 3.2% in August, with energy inflation being the main driver. Energy prices were up 18.8% year over year, from 14.3% in August, as the Middle East conflict kept oil and gas above pre-conflict levels, while core inflation held at 2.5% and services at 3.2%. The ECB answered with a second 25 basis point rise, after June’s first increase since 2023, taking the deposit rate to 2.50% on 10 September, while mortgage borrowing costs had already edged up to 3.60% in August, the latest month published.
Households turned more cautious. The European Commission’s Economic Sentiment Indicator, which combines business and consumer confidence across five sectors, slipped to 97.9 and its Employment Expectations Indicator, which measures managers’ hiring plans, fell 1.3 points to 97.5. Both indices are set so that 100 is their long-term average, so both now sit slightly below normal, reversing a recovery that began in May. Consumer confidence dropped a point to -16.5, three points below a year earlier, as households grew gloomier about their finances, the wider economy and big-ticket purchases.
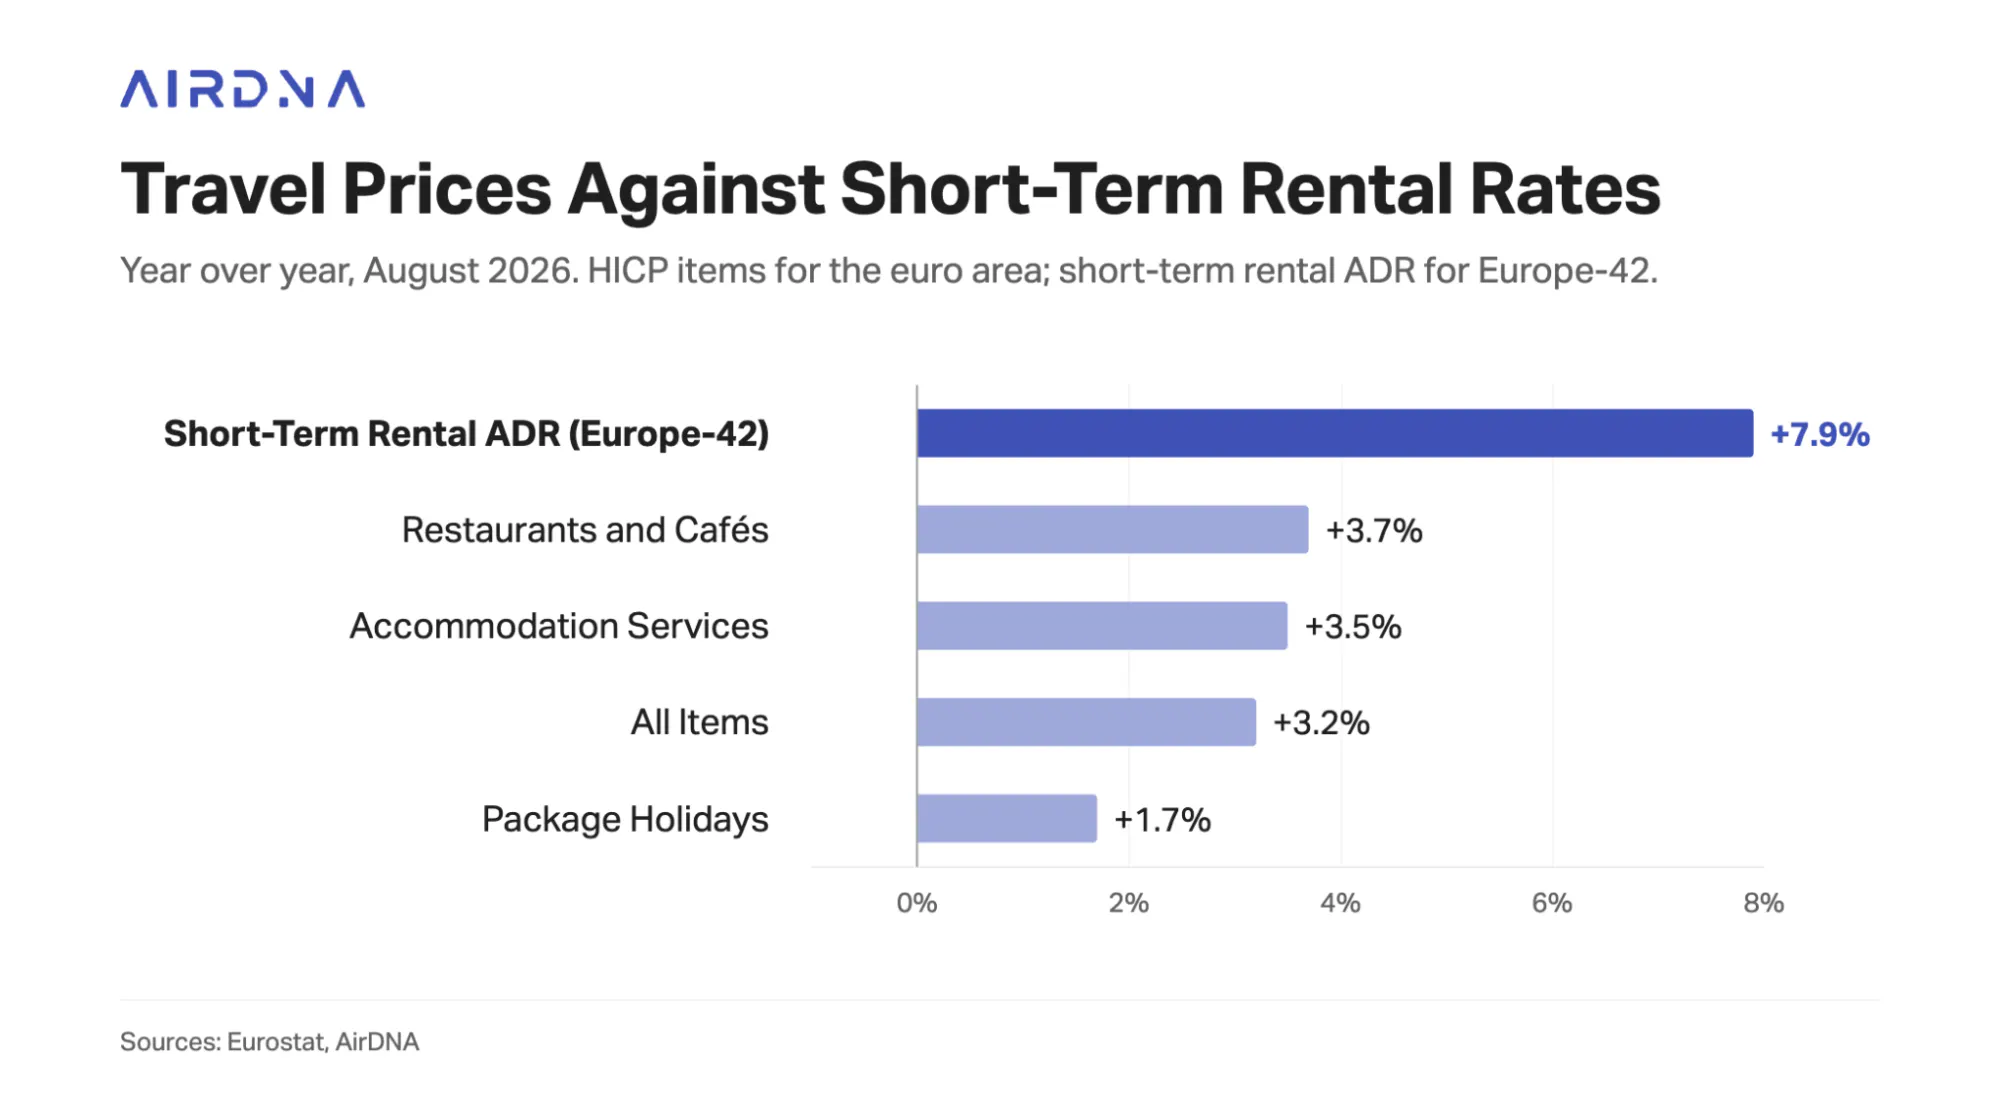
Short-term rental hosts nonetheless priced ahead of the wider travel market. Looking back a month, accommodation services in the euro area’s consumer price index rose 3.5% in August and package holidays 1.7%, while short-term rental ADR grew 7.9%, more than twice the pace of official accommodation prices and well above headline inflation.
The slowdown in supply growth owed little to interest rates. Available listings across the 42 European countries AirDNA tracks grew close to 16% in 2023, when mortgage rates were near 3.9%, and growth was down to 0.4% this September after slowing throughout 2025 even as borrowing costs fell. The correlation between supply growth and mortgage rates a year earlier was effectively zero, pointing to a maturing market, most visibly in the largest cities, rather than financing costs as the brake on new listings.
Check Your Market Score
Every market gets a 1-100 score based on rental demand, revenue growth, and investability. See where yours lands.
Supply Growth Flattens as Spain Continues Contraction
Supply growth faded month after month in 2026. Available listings across the 42 countries were 4.2% above the previous year in January, 2.1% in April, 0.8% in August and just 0.4% in September, the weakest September since 2021. Spain explained much of the slowdown: Spanish supply, squeezed by tighter licensing rules, fell 7.7% in September, or 31,800 listings, after declines of 10% to 14% earlier in the year. Without Spain, European supply grew 1.4% in September, still down from 5.9% in January but adding about 48,500 listings rather than 16,700.
Europe’s top 50 cities hit a ceiling. They lost 2.9% of their supply in September and only 12 of them grew; their listings sat at 98% of the 2019 level, having recovered to almost exactly that mark by 2024 and gone no further, even though their demand was 13% above 2019. Outside of the top 50 cities, the rest of Europe kept growing, by 1.0% in September (1.9% excluding Spain), and its supply stood 35% above 2019.

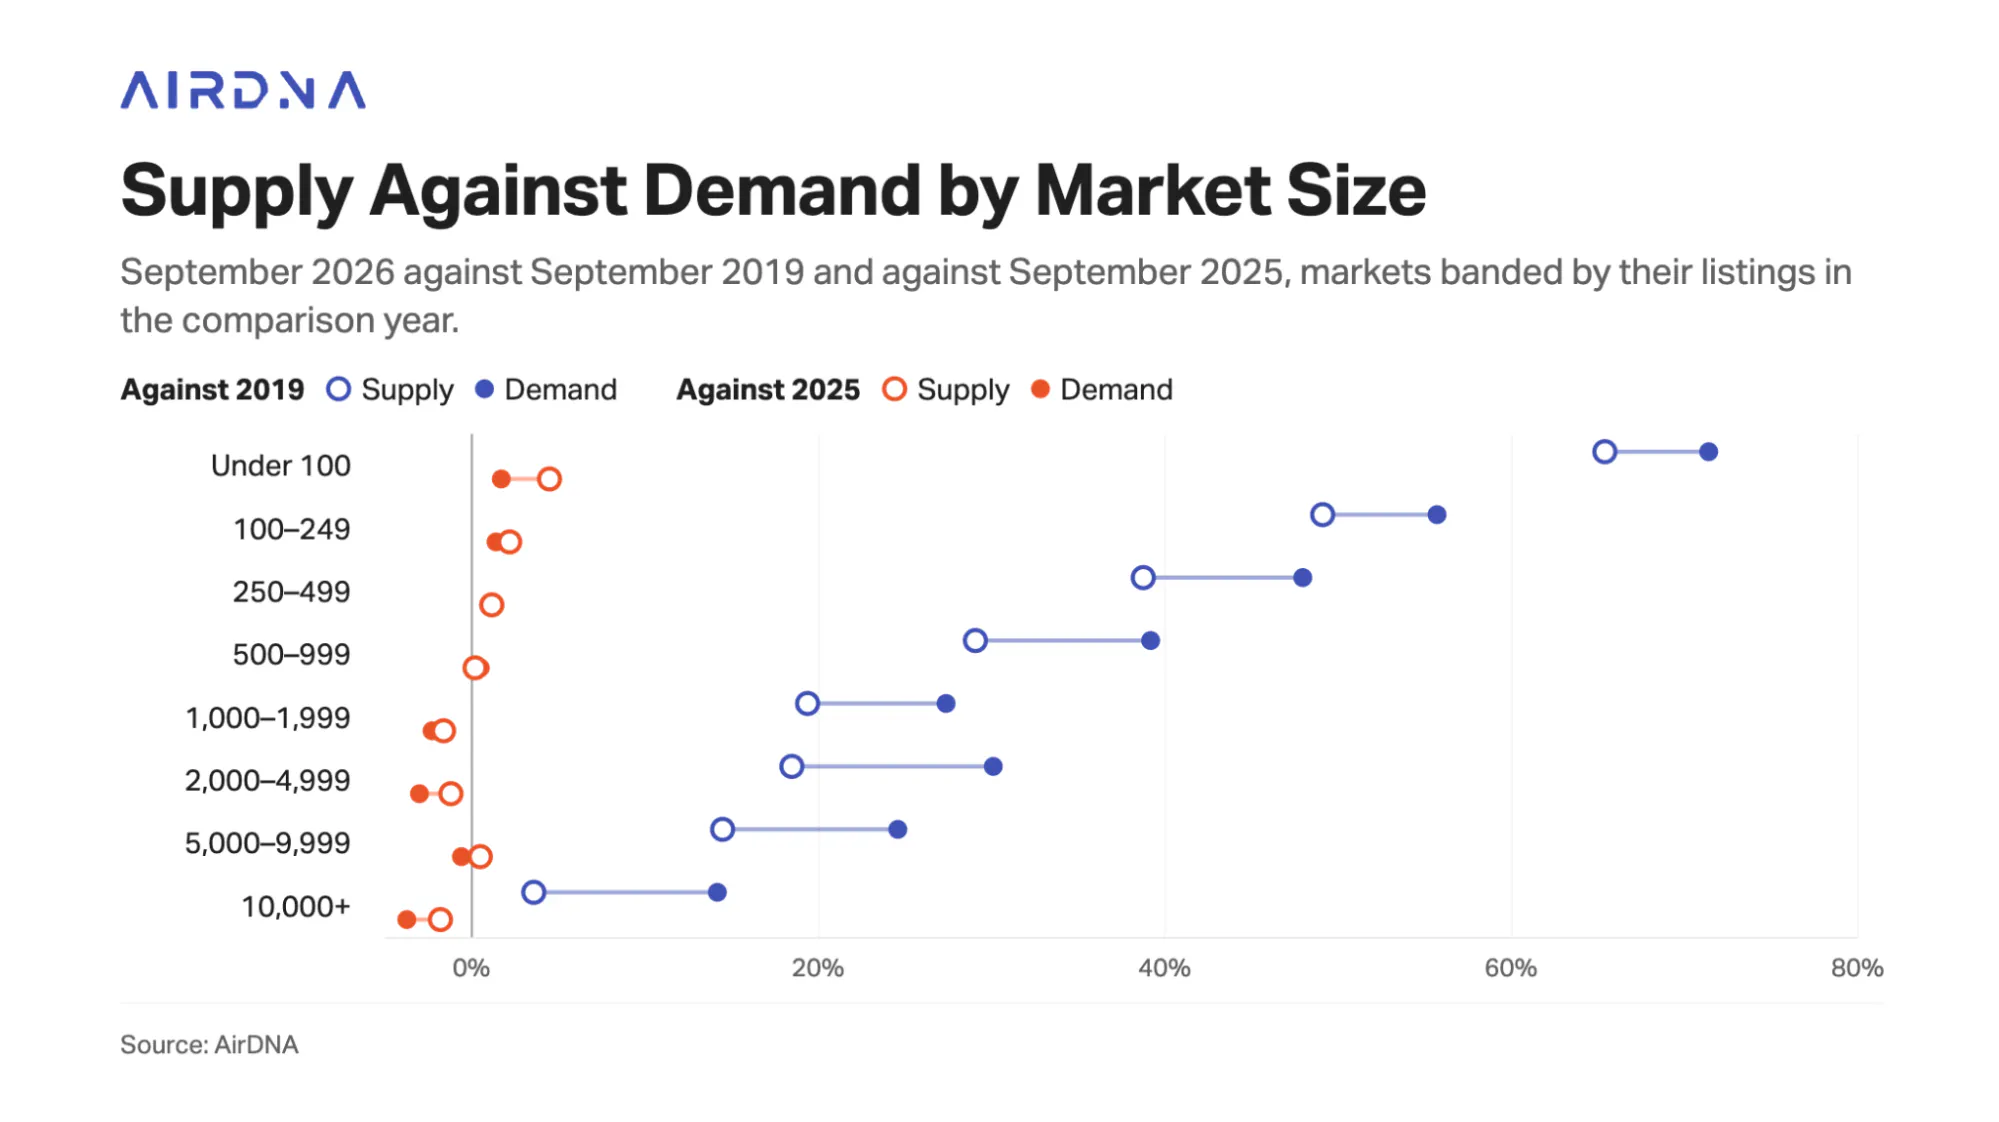
Growth moved to the smallest markets, a pattern that pointed to capacity limits in the larger ones. Supply growth fell with market size, from 4.5% in markets under 100 listings and 2.2% in those of 100 to 249 to flat or falling in every band above 1,000. Since 2019, growth ranges from 65% in the smallest markets to 3.5% in those above 10,000 listings, yet demand outgrew supply in every band, highlighting constrained entry rather than poor returns.
First-time listings fell 6% in the smallest markets this year and 13% to 21% in every band above 500. This September, though, demand softened as well: demand nights per listing fell in every band except markets of 500 to 999 listings, by 2.8% in the smallest markets and by 1% to 2% in those above 2,000 listings.

Demand Decline Narrows, but Spain Keeps Europe Negative
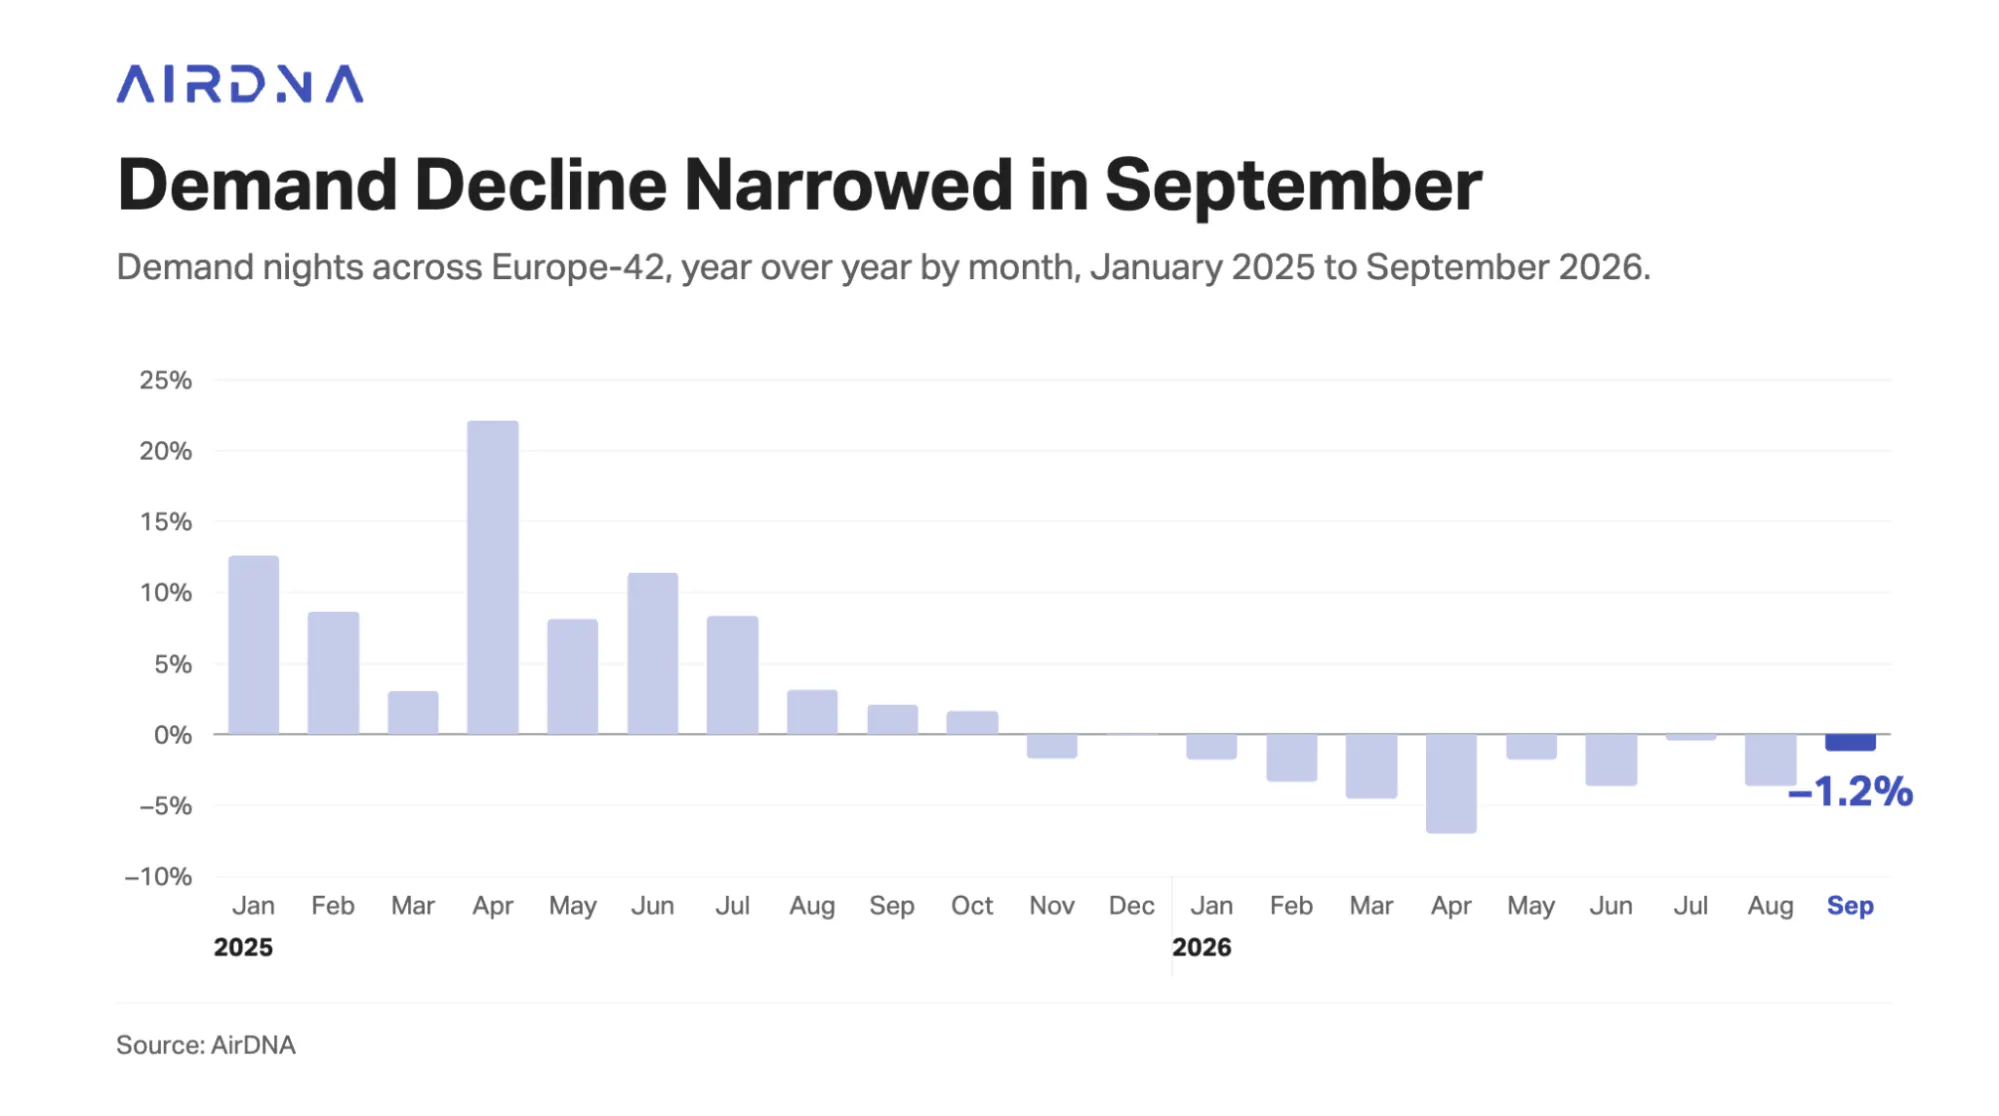
Demand nights fell 1.2% in September to 46.4 million and have not grown since October 2025, though the decline narrowed from -3.7% in August. Spain accounted for most of the loss: its demand nights fell 8.1% in September, or 431,500 nights, equal to 77% of Europe’s net decline of 562,000 nights, as licensing rules kept shrinking its supply. Occupancy in Spain even rose slightly, showing the country can still fill the listings it has. Croatia (-11.4%, or 166,000 nights), Germany (-3.3%, 161,000) and France (-1.5%, 158,000) also lost ground, while Italy added 236,000 nights (+3.5%), offsetting 42% of the decline, and Poland (+7.8%), the UK (+1.0%) and Albania (+16.7%) grew as well. Excluding Spain, European demand nights were almost flat (-0.3%).
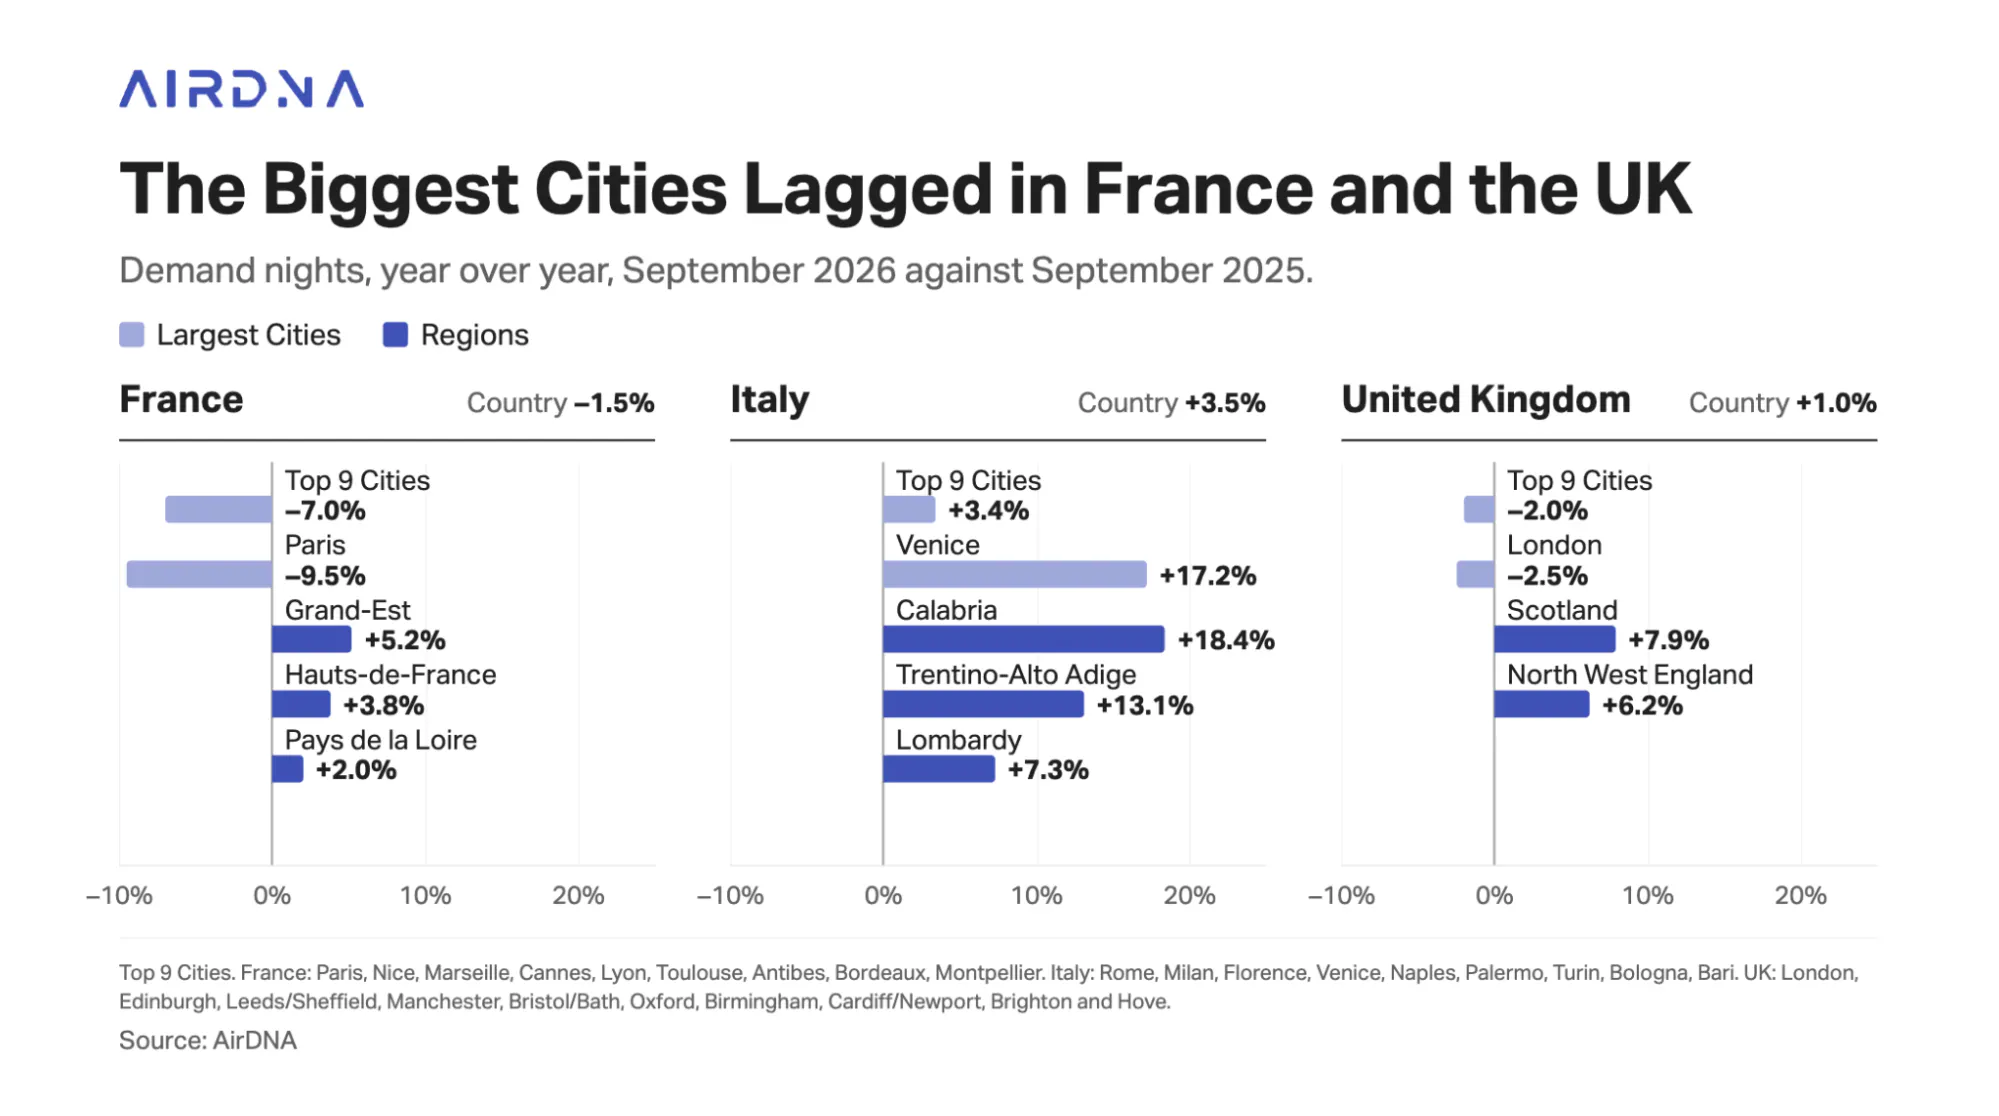
The biggest cities lagged in France and the UK. France’s demand nights fell 1.5%, and its nine largest cities dropped 7.0%, led by Paris (-9.5%), accounting for three quarters of the national loss, while Grand-Est (+5.2%) and Hauts-de-France (+3.8%) grew. In the UK the nine largest cities fell 2.0%, with London down 2.5%. Meanwhile Scotland (+7.9%) and the North West (+6.2%) drove a 1.0% net national gain. Italy’s 3.5% rise was the broadest: its nine largest cities grew 3.4%, led by Venice (+17.2%), while outside those cities Calabria (+18.4%), Trentino-Alto Adige (+13.1%) and Lombardy (+7.3%) were the fastest-growing regions.
Bookings told a weaker story still. Adjusted nights booked, which count reservations by the date they were made and mark down recent bookings for expected cancellations, fell 13.5% in September after an 8.5% drop in August, the steepest decline of a year in which every month has been negative. All 20 of the largest countries booked fewer nights, from Albania (-1.5%) and the Czech Republic (-5.0%) to Croatia (-24.8%), and even Italy, where demand nights grew 3.5%, booked 13.2% fewer nights.
Hosts Pushed September Rates Harder Than Summer’s, Most of All in the Cities
ADR rose 8.9% in September to €141.02, faster than its 8.2% growth over June to August, and with occupancy flat after a 1.4-point fall over those three months, RevPAR grew 9.1% against 5.9%. AirDNA’s Repeat Rent Index (RRI), which removes the effect of changing composition and shows how existing operators are actually changing their prices, rose 6.5% in September after 5.4% over the summer, its fourth straight monthly acceleration. Part of the September acceleration in ADR was an easier comparison: September 2025 ADR had fallen 1.2%, and compared to 2024, September ADR growth (7.6%) only matched summer ADR growth (7.8%).
The countries that drew most from the shoulder season combined faster ADR growth with higher occupancy. In the Czech Republic, ADR growth rose from 3.8% over the summer to 6.5% in September as occupancy swung from a 2.2-point decline to a 1.4-point gain, lifting RevPAR growth from +0.3% to +9.0%. Switzerland (ADR growth +10.7% to +12.8%, occupancy -2.3 to +1.7 points) and Italy (ADR growth +7.7% to +9.9%, occupancy -1.6 to +1.6 points) also followed the September acceleration pattern. In the Czech Republic and Switzerland, the ADR acceleration also held against 2024, so it was more than an easy comparison, while Italy’s gains partly reflected weak ADR in September 2025.

Croatia and Spain also accelerated ADR growth sharply, from 8.9% over the summer to 13.4% in Croatia and from 11.9% to 14.5% in Spain, but both did so on falling demand, with demand nights down 11.4% in Croatia and 8.1% in Spain. Against 2024, Spain’s September ADR growth was no faster than its summer ADR growth.
ADR growth slowed from summer to September in six of the 20 largest countries, led by Portugal (from 7.1% to 5.0%), with Poland, Ireland, Austria, France and the UK also easing. In Poland and Austria, slower ADR growth came with higher occupancy, up 1.2 points from September 2025 in each, while Portugal combined slower ADR growth with occupancy down 1.9 points.
The clearest shoulder gain came in the cities. Across the top 50 cities, ADR growth rose from 6.7% over the summer to 9.4% in September. Occupancy rose 0.9 points after falling 1.3 points over the summer. Unlike the Europe-wide acceleration, the cities survived the comparison with 2024: city ADR was 5.3% above September 2024 but only 0.7% above summer 2024. Madrid (ADR +25.6%), which hosted its first Formula 1 Grand Prix in mid-September, led, while ADR growth in Venice, Paris, Rome, Milan and Athens ran roughly five to eight points faster than over the summer.
Fastest ADR growth, September 2026
| Rank | Market | ADR YoY | Supply YoY |
|---|---|---|---|
| 1 | Madrid, Spain | +25.6% | -2.5% |
| 2 | Budapest, Hungary | +22.0% | -16.2% |
| 3 | Seville, Spain | +18.8% | -0.6% |
| 4 | Barcelona, Spain | +17.4% | -12.1% |
| 5 | Valencia, Spain | +17.3% | -7.1% |
| 6 | Medulin, Croatia | +16.8% | -8.9% |
| 7 | Grad Split, Croatia | +13.7% | -6.1% |
| 8 | Venice, Italy | +13.1% | +0.5% |
| 9 | Málaga, Spain | +13.1% | -4.6% |
| 10 | Hvar, Croatia | +12.9% | -3.9% |
Slowest ADR growth, September 2026
| Rank | Market | ADR YoY | Supply YoY |
|---|---|---|---|
| 1 | Lyon, France | +0.2% | -3.7% |
| 2 | Vienna, Austria | +1.9% | -4.7% |
| 3 | Lisbon, Portugal | +2.3% | -2.9% |
| 4 | Montpellier, France | +2.9% | -9.5% |
| 5 | Porto, Portugal | +3.5% | +1.2% |
| 6 | Grad Zadar, Croatia | +3.7% | -6.4% |
| 7 | Dublin, Ireland | +3.9% | -7.6% |
| 8 | London, United Kingdom | +3.9% | -1.9% |
The pattern points to pricing power moving into the months after the peak, where cities and markets such as the Czech Republic and Switzerland combined faster ADR growth with higher occupancy. Croatia and Spain accelerated ADR growth sharply but on falling demand nights, so their September gains came from higher prices on less volume rather than from a stronger shoulder season.
Stop Guessing Your Nightly Rate
Most hosts price on gut feel. Adapt prices every night on real demand, real competition, and what drives bookings.
Early Bookings Flatten Pace as November Looks Soft
In the US, lead times lengthened through 2026 as fewer guests booked at the last minute, so early pacing overstated final demand. Europe showed a narrower version of the same shift. Nights on the books 300 days before each stay month from January to September 2026 ran 28% to 66% ahead of 2025, but that early layer was thin; the median lead time by booking month barely moved. Bookings made within six days of arrival held their share of September check-ins (25.1% against 24.7%).
Lead times in Europe did not shorten; they stretched at the far end. For September stays, 25.0% of bookings were made more than three months ahead, up from 23.3% a year earlier, while bookings made one week to three months out lost share and last-minute bookings held steady. The average lead time rose from 62 to 68 days. By the start of each month, however, the share of nights already booked was only half a point higher than in 2025, so guests changed when they booked more than how much they booked. Spain and Croatia moved bookings forward the most, while Germany and Portugal booked later.
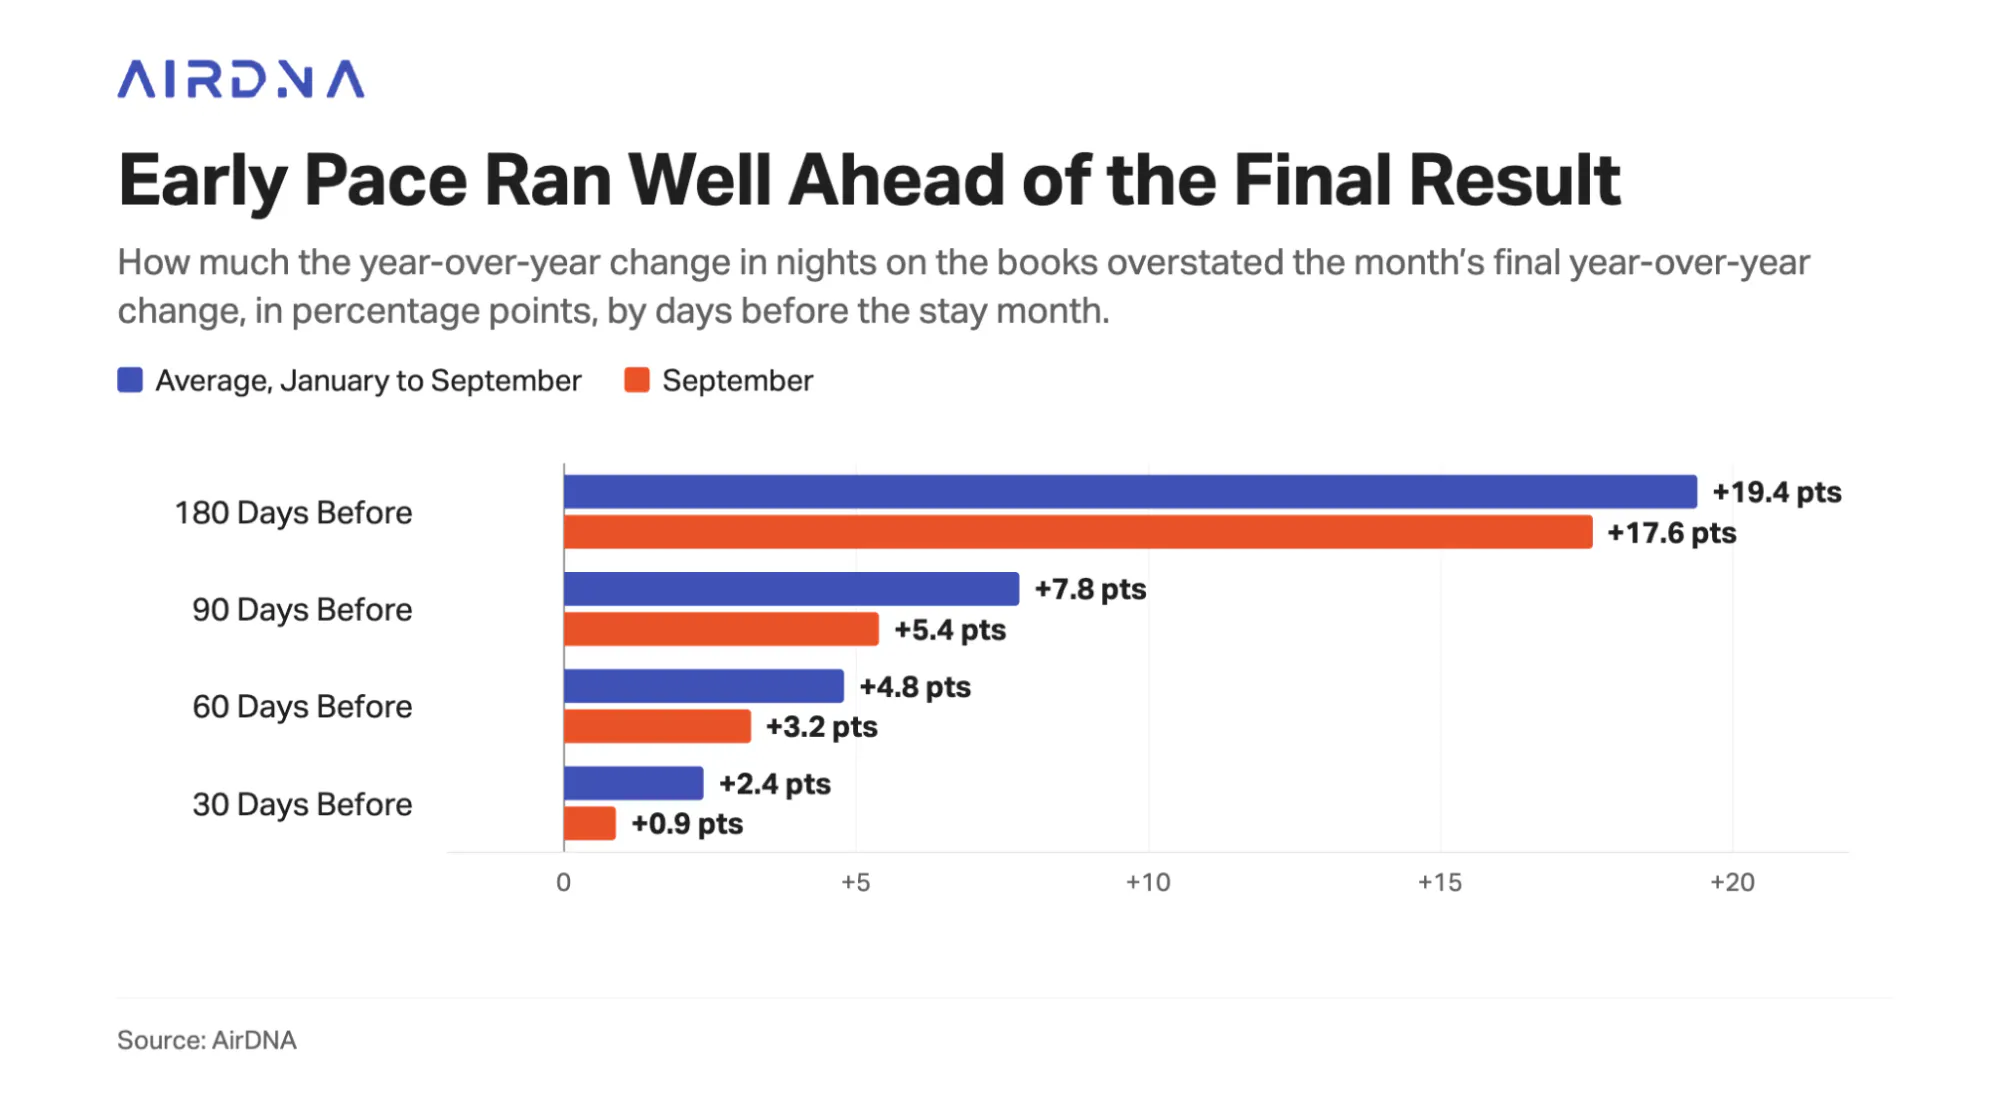
That early lead flatters the numbers. Six months before a stay month, nights on the books typically ran about 19 points further ahead of last year than the month finally finished; three months out the gap was about 8 points, and a month out about 2. July, for example, looked 22.9% ahead six months out but finished 0.5% down. AirDNA’s pacing data ran high too, by about 5 points a month ahead. For hosts, a strong early pace says more about when guests book than how many will come, so it is safer to wait until the last month or two before raising rates on the strength of pacing.
On 1 October, nights on the books for October stood 1.1% above a year earlier, while November stood 3.8% below and December 1.0% above. On this year’s record, October points to a finish around flat and November to one below its current read.
The UK was the only one of the five largest countries ahead in all three months (October +4.3%, November +3.1%, December +5.4%), and Poland and the Czech Republic paced furthest ahead, with December nights on the books up 19.1% and 20.1%. Italy led October (+6.5%) but fell behind for November (-5.6%).
The Top Shoulder Season Markets: Seville, Munich and Turin Beat Summer
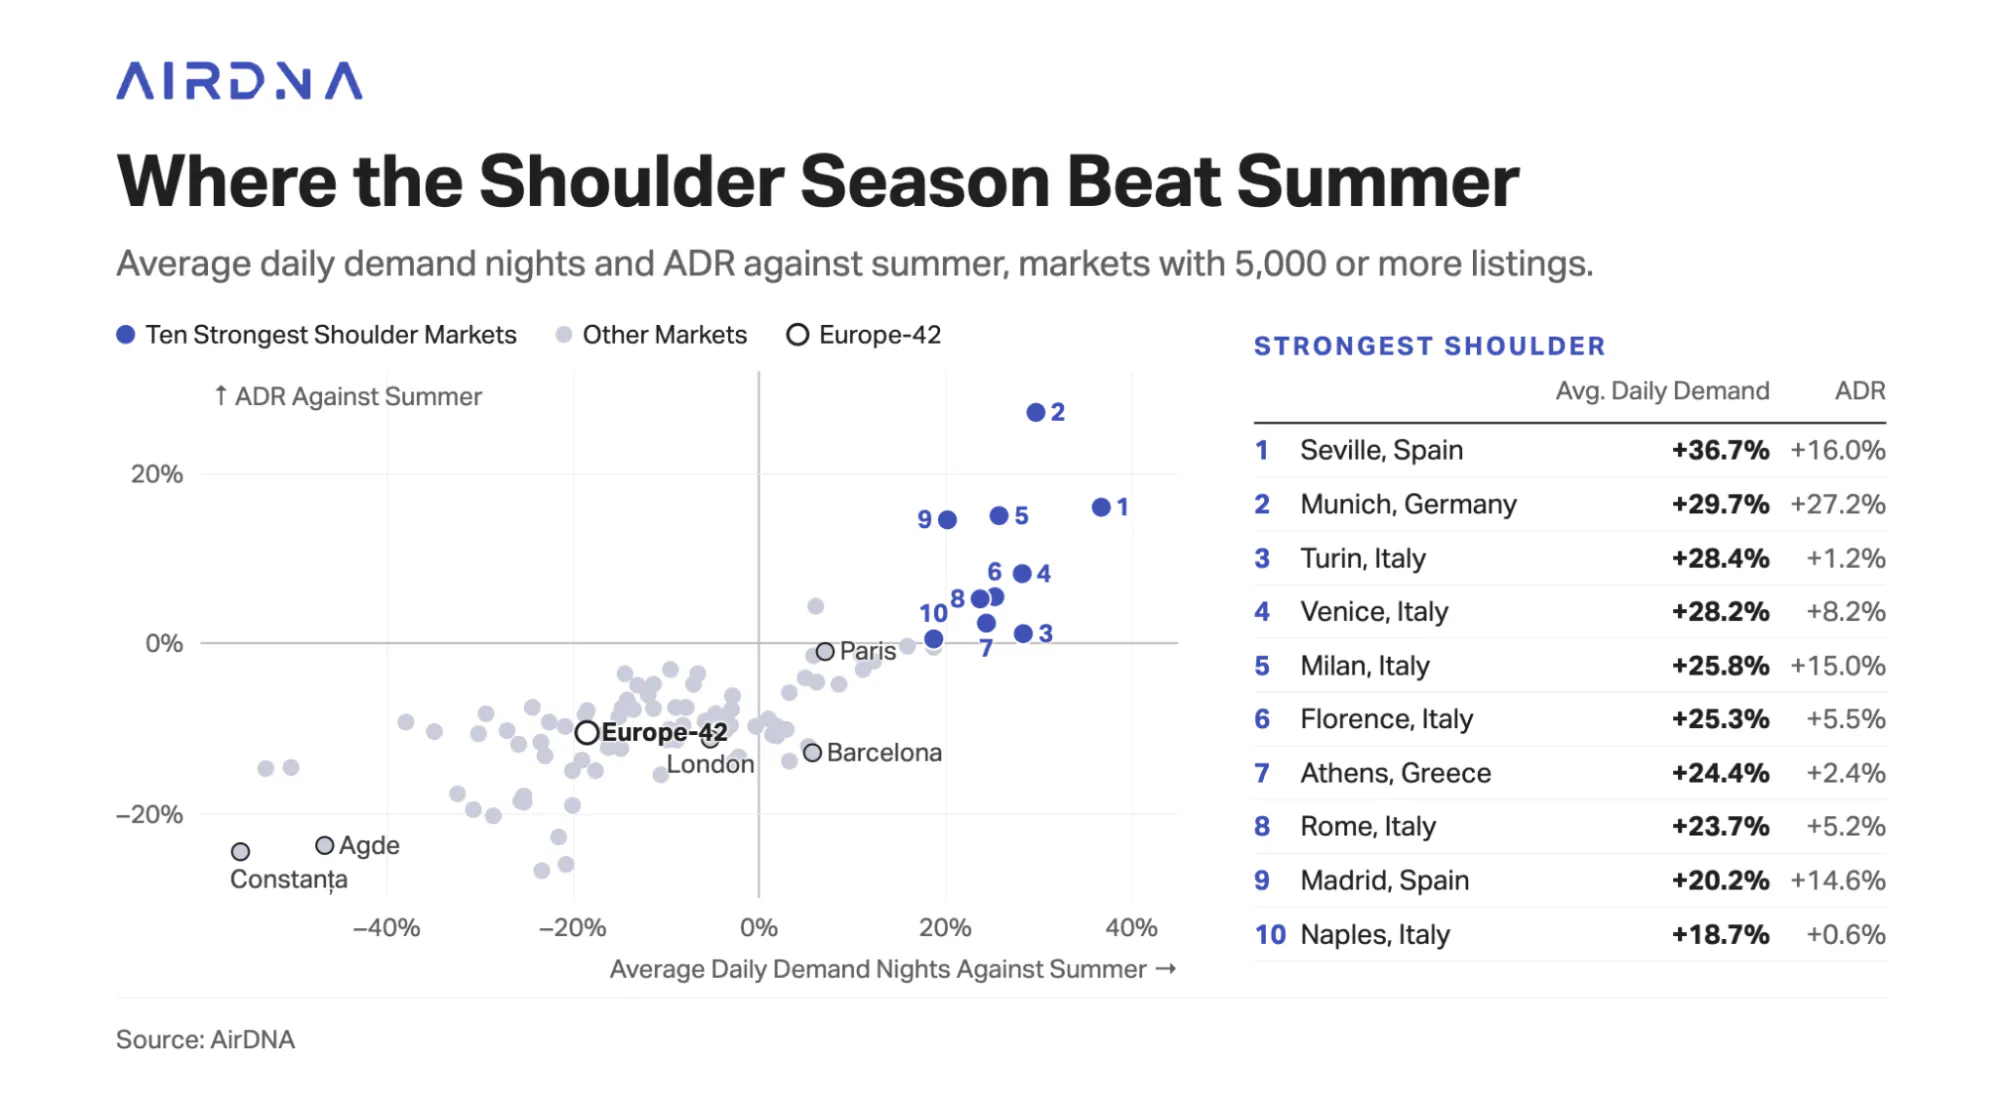
To find the strongest shoulder markets, AirDNA compared September 2026 with June to August 2026 in each of the 93 markets with at least 5,000 listings. Because the periods differ in length, the comparison uses average daily demand nights, the nights stayed in a market’s listings divided by the number of days in the period, alongside ADR. Across Europe, average daily demand nights in September were 18.3% below the summer and ADR 10.6% below, and in the five largest countries they fell between 9.7% in Italy and 26.5% in France.

The ten strongest were all cities that bucked the national trend, six of them in Italy, and every one also charged more than in summer. Seville led (average daily demand nights +36.7%, ADR +16.0%), followed by Munich (+29.7%, +27.2%), Turin, Venice and Milan. Together, the ten ran 24.6% above their summer on average daily demand nights and 8.7% above on ADR, a wider margin than in September 2025 (+20.3% and +3.8%). Paris and Barcelona beat their summer on average daily demand nights but not on ADR, and London on neither.
Compared to September 2025, the ten raised ADR 12.4% to €162.03, against 8.9% for Europe, and their occupancy reached 77.7%, against 55.4% for Europe, while their demand nights held flat. Venice had the strongest month, with demand nights up 17.2% and occupancy up 13.0 points on September 2025, while Madrid raised ADR the most (+25.6%) in the month it hosted its first Formula 1 Grand Prix.
What the ten share is a hot summer. Nine of them averaged daily highs above 30°C over June to August, against about 24°C for the typical large market, and visitors put off city breaks until the heat eased. Munich, home to Oktoberfest, was the exception. With the ten’s summer demand nights down 4.0% in 2025 and September flat, the shoulder season is becoming the strongest stretch of the year for these cities.
See How Your Listing Stacks Up
Your Performance Dashboard benchmarks your revenue, ADR, and occupancy against the properties you compete with.
FAQs
Why did Europe’s RevPAR rise in September 2026 while demand fell?
RevPAR rose 9.1% because ADR grew 8.9% to €141.02 while occupancy held flat at 55.4%. Demand nights fell 1.2%, but the Repeat Rent Index rose 6.5%, so most of the gain came from existing hosts charging more rather than from more nights booked.
How much did Spain contribute to Europe’s demand decline?
Spain’s demand nights fell 8.1% in September, or 431,500 nights, equal to 77% of Europe’s net decline of 562,000 nights, as licensing rules kept shrinking its supply. Excluding Spain, European demand nights were almost flat at -0.3%.
When is shoulder season in Europe for short-term rentals?
The shoulder season is the stretch just after the June to August peak, led by September. In September 2026, average daily demand nights across Europe ran 18.3% below summer, but the ten strongest shoulder markets ran 24.6% above their summer levels.
Which European cities had a stronger September than summer?
Seville led, with average daily demand nights 36.7% above summer and ADR 16.0% higher, followed by Munich, Turin, Venice and Milan. Six of the ten strongest shoulder markets were in Italy, and nine of the ten had summer highs averaging above 30°C.
Is early pacing a reliable guide to final demand in Europe?
Not on its own. In 2026, nights on the books six months before a stay month ran about 19 points further ahead of last year than the month finally finished, narrowing to about 2 points a month out. On 1 October, October was pacing 1.1% ahead and November 3.8% behind.
ARTICLE SUMMARY
Europe’s short-term rental market earned more from fewer nights in September 2026. RevPAR rose 9.1% on an 8.9% ADR gain while demand nights fell 1.2%, with Spain behind most of the decline, and hot-summer cities such as Seville, Munich and Turin had a stronger shoulder season than summer.
Camilo Schmid Rivas
Senior Research Analyst
Camilo Schmid Rivas is a Senior Research Analyst at AirDNA who brings a uniquely well-rounded perspective to short-term rental analytics. With a background that spans investment, real estate, and business analysis—including roles at Stayery and Sollers Consulting—Camilo has worn many analyst hats, each sharpening his ability to turn complex data into clear, actionable insights. A graduate of École hôtelière de Lausanne, he now channels his multidisciplinary expertise into uncovering trends that drive smarter STR decisions. In his free time, he enjoys playing tennis or scuba diving in or around Barcelona.
