

 Calculate Revenue
 Research Markets
 Find For Sale Properties
 Compare My Listing
 STR Revenue Calculator
 Custom Comp Sets
 Submarket Insights
 Custom Search Filters
 Rate Recommendations
 Performance Benchmarking
 Competitor Comparison
 Owner Contact Details
 Property-level performance data
 Tourism Insights
 Real Estate Investment Analytics
 About Us
 Sales
Sales Support
 Press
PressGuests Are Booking Sooner in 2026, and Pacing Is Harder to Read
Published: October 7, 2026
Last updated: October 8, 2026

Bram Gallagher
When making pricing decisions, hosts need accurate information about how close to the stay date guests are likely to book. A vacancy six months out looks much less like a problem than one just a couple of weeks away. That makes pacing a powerful tool for predicting future occupancy and deciding whether to hold prices firm or start discounting to encourage hesitant travelers.
Key Takeaways
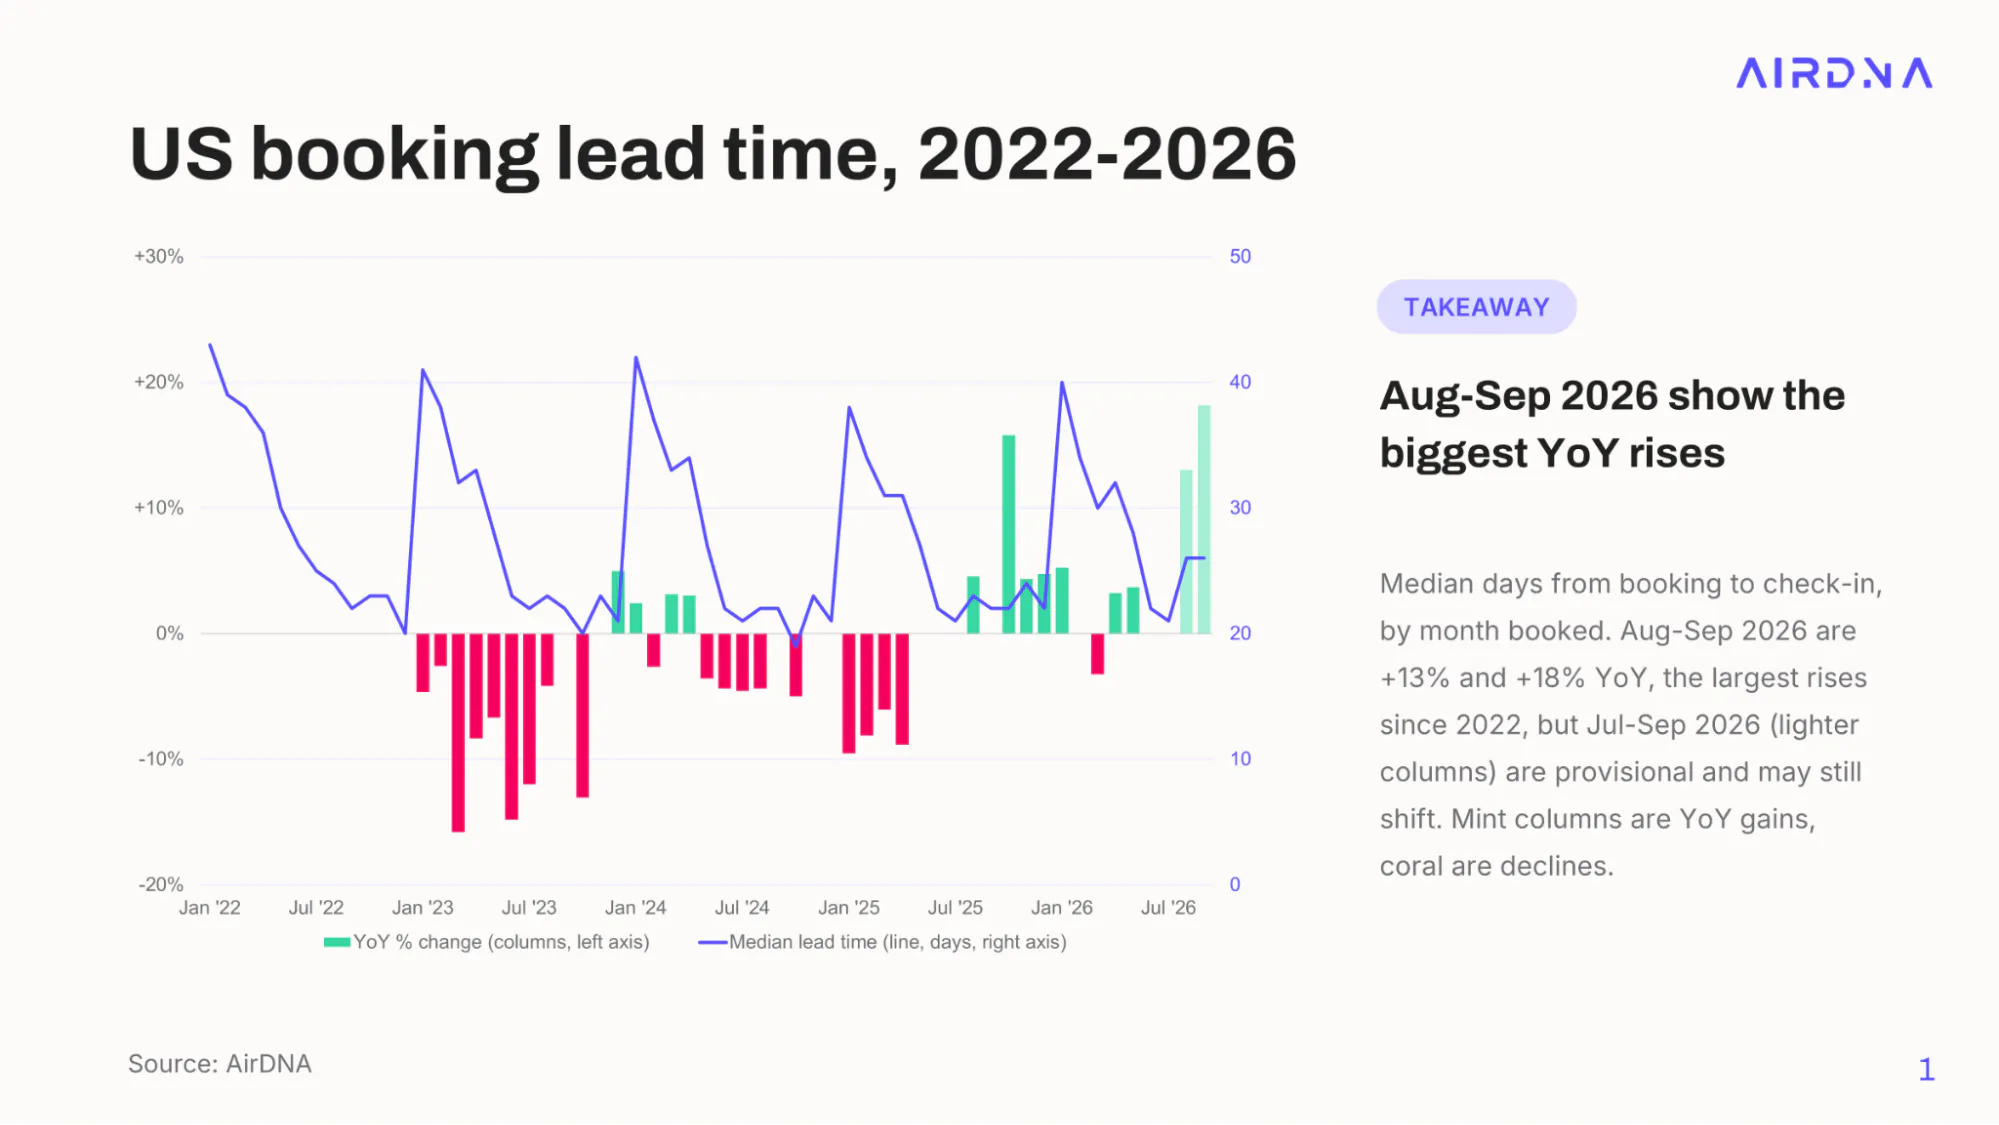
- U.S. booking lead times began lengthening in the second half of 2025, and August and September 2026 show the biggest year-over-year rises since 2022.
- January to July 2026 stays were pacing 8.4% ahead of 2025 at 180 days out but finished just 1.3% ahead.
- The share of last-minute bookings (within six days of check-in) fell 0.5 percentage points, the largest shift at any lead time.
- Coastal resorts and large-city suburbs lost the most last-minute bookings, while large urban markets gained the most bookings made 26 or more weeks out.
- Budget and economy listings shifted furthest toward early booking, while luxury listings shifted slightly toward shorter lead times.
- Hosts should avoid raising rates too early and hold steady until 60 to 90 days before the stay, when pacing converges on realized demand.
Booking Lead Times Reversed Course in Late 2025
Pacing in the short-term rental market means comparing demand in your comp set with what demand looked like at the same point last year. Higher demand than last year means the market will end up fuller. If you rented last year, you can reasonably assume you will rent this year without discounts. A large enough increase in demand may even convince a host to raise prices.
Pacing, then, helps hosts judge whether their vacant days are normal or a signal to change price. But the signal depends heavily on guest behavior. Consistent guests make for consistent predictions. If guests behave differently than they did the previous year, pacing can understate or overstate the final realized demand.
Median lead times show that they are not only changing from year to year, but that the direction of change has recently reversed. After the COVID-19 pandemic, lead times were exceptionally high, as massive occupancy gains led travelers to expect scarcity in peak months. Lead times had generally been declining since then. That trend began reversing in the second half of 2025, and lead times have recently jumped significantly.
Early Pacing Overstated 2026 Demand: +8.4% at 180 Days, +1.3% Realized
Longer lead times cause early pacing data to overstate eventual demand growth. Early bookers give the impression of increased interest when other factors, such as locking in rates or more deliberate trip planning, are simply moving the reservation window earlier. Combining all reservations for January through July stays shows the net effect of longer median lead times on pacing.
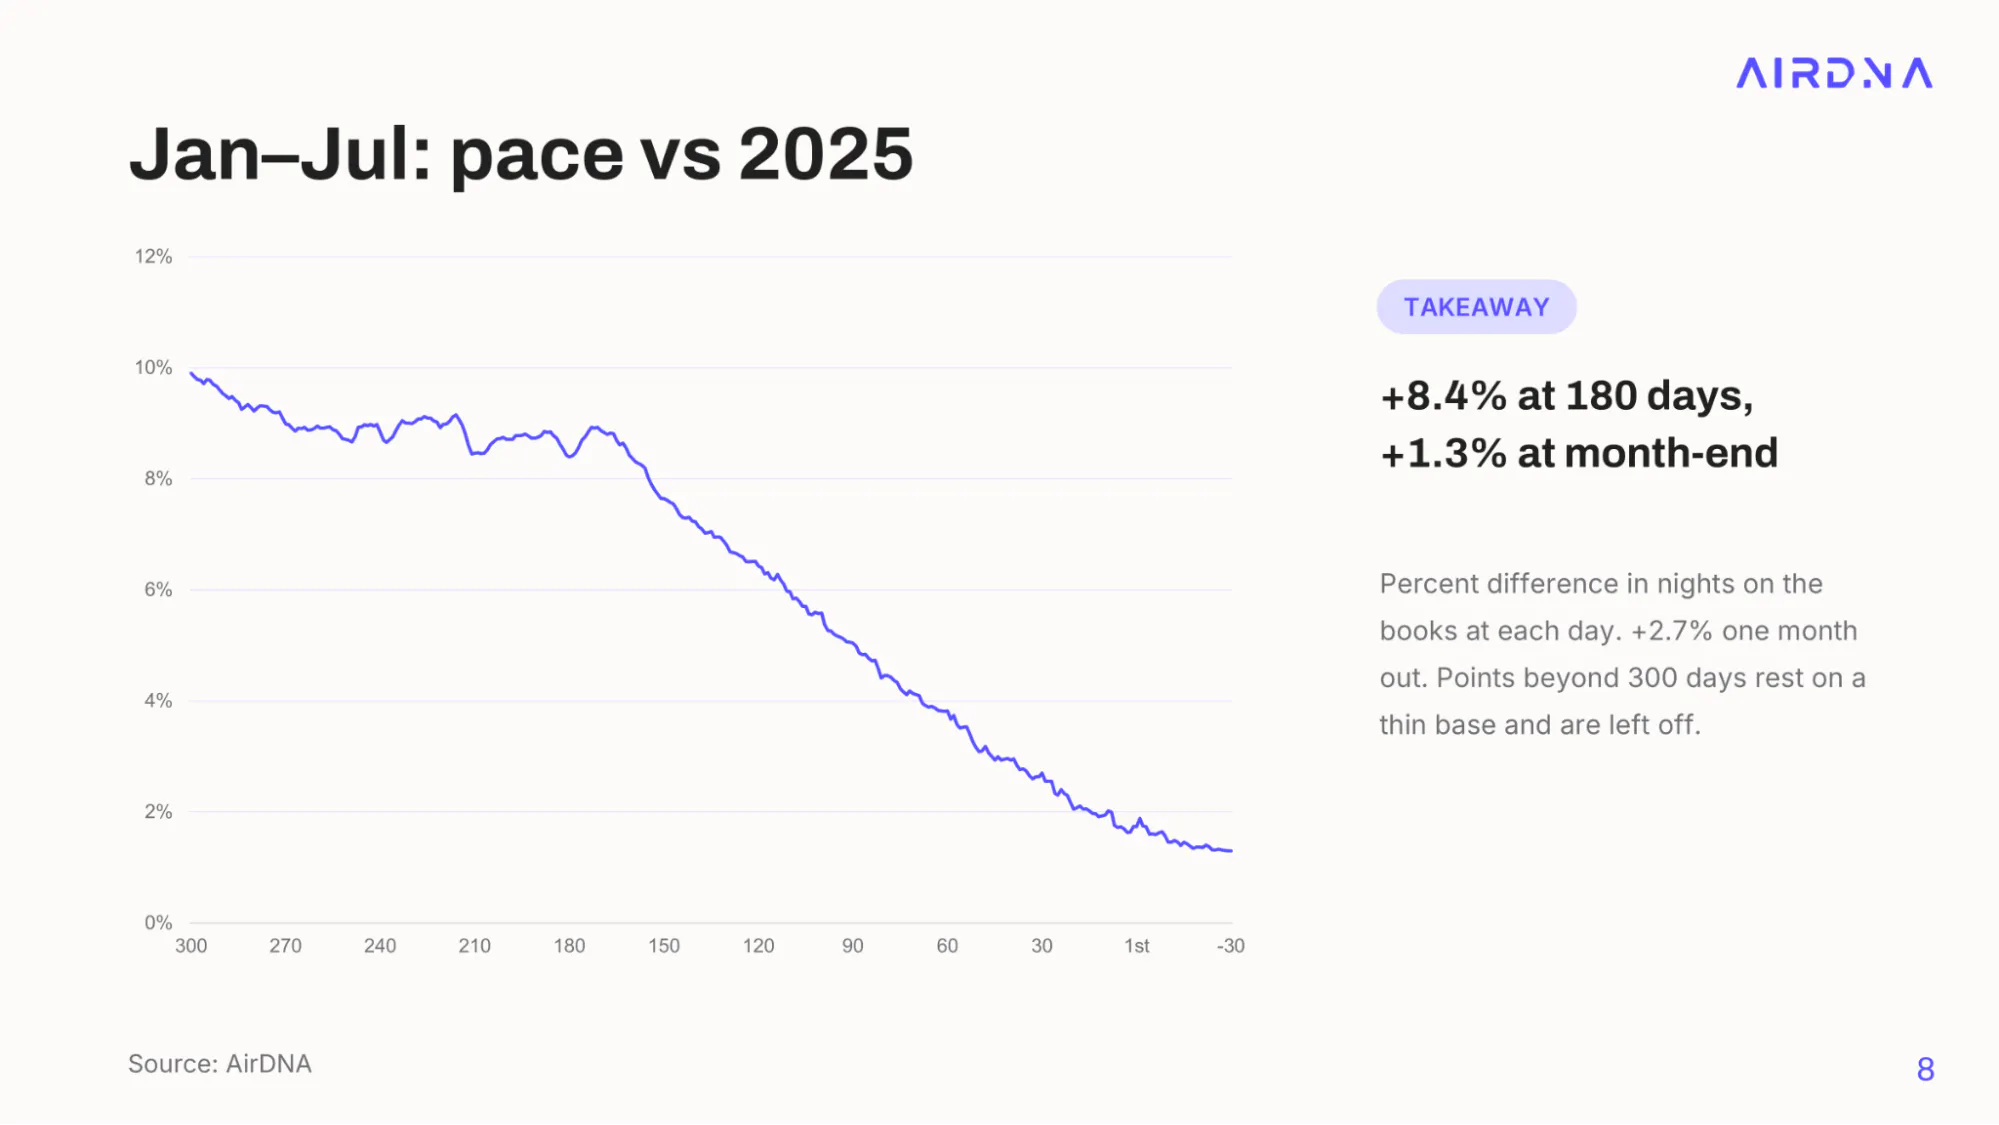
The U.S. was pacing up 8% to 10% until about five months before the stay date. After the 150-day mark, the pacing percentage gradually declines until it reaches the realized rate of 1.3%. The shape of this decline does not depend solely on the median lead time, but on the shift across the entire distribution of when reservations occur. I compared the share of reservations made at each lead time in 2025 and 2026 to see how 2026 has changed.
Last-Minute Bookings Fell the Most
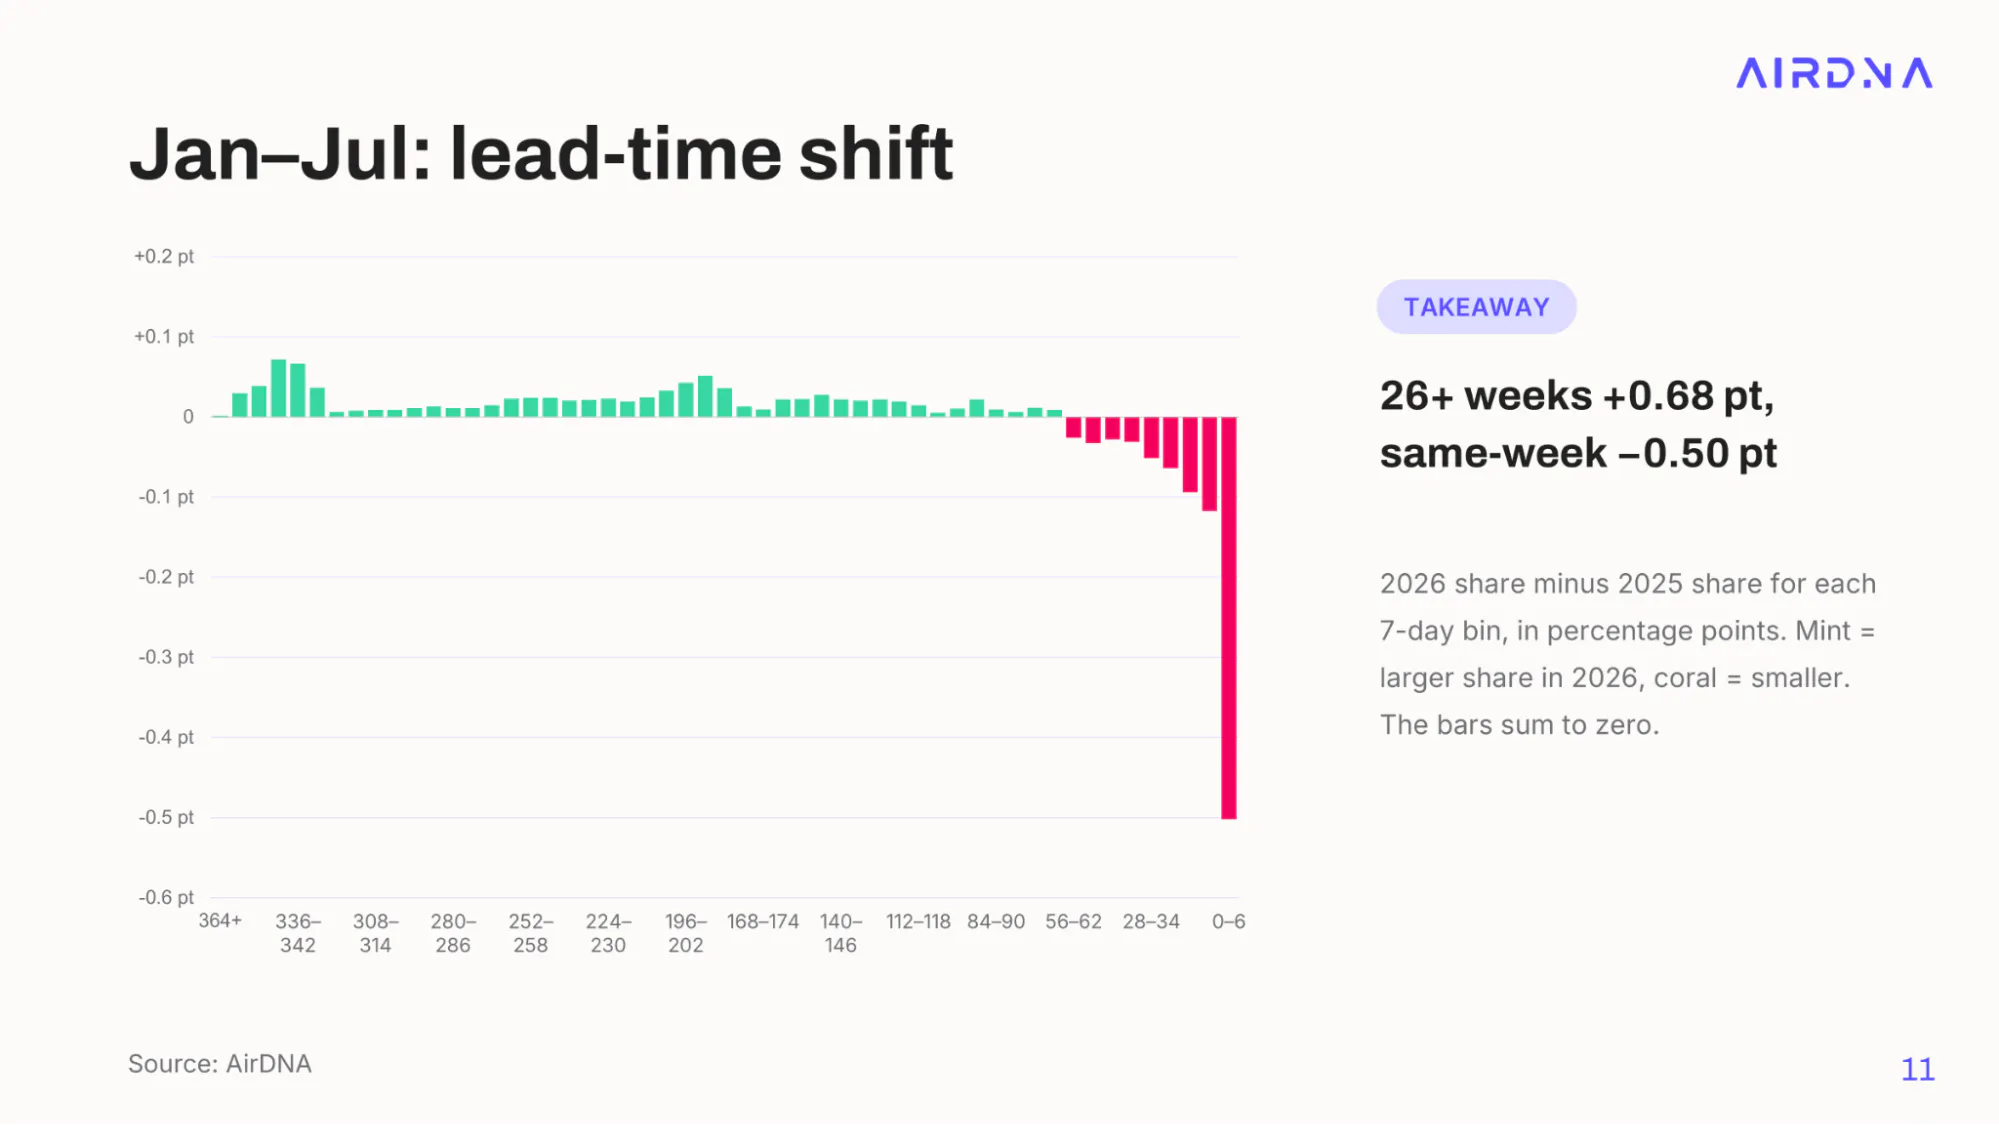
There is a significant cluster of additional reservations made about a year out, perhaps repeat guests taking advantage of early-bird discounts. This is why the pacing chart shows the highest year-over-year gain early on. After this cluster, gains are smaller but still positive, and they continue through the 150-day mark. Within 150 days of the stay, gains shrink and then turn into losses, ending with the most dramatic difference, -0.5 percentage points, for last-minute bookings made within six days of check-in.
Half a percentage point sounds small. But because at least half of reservations are made within 20 to 40 days of the stay (according to the median lead time chart), it has an outsized influence on the gap between early pacing and realized demand.
Pacing Patterns Can Change From One Month to the Next
So how can a forecaster interpret pacing signals in this environment? One method is to forecast not only final demand but also changes in lead times. The difficulty is that there can be dramatic structural breaks from one month to the next. In 2026, for example, the first few months look considerably different from the months that followed or the year-to-date aggregate. Pacing for those early months held relatively steady, or even increased slightly, as the stay date approached.
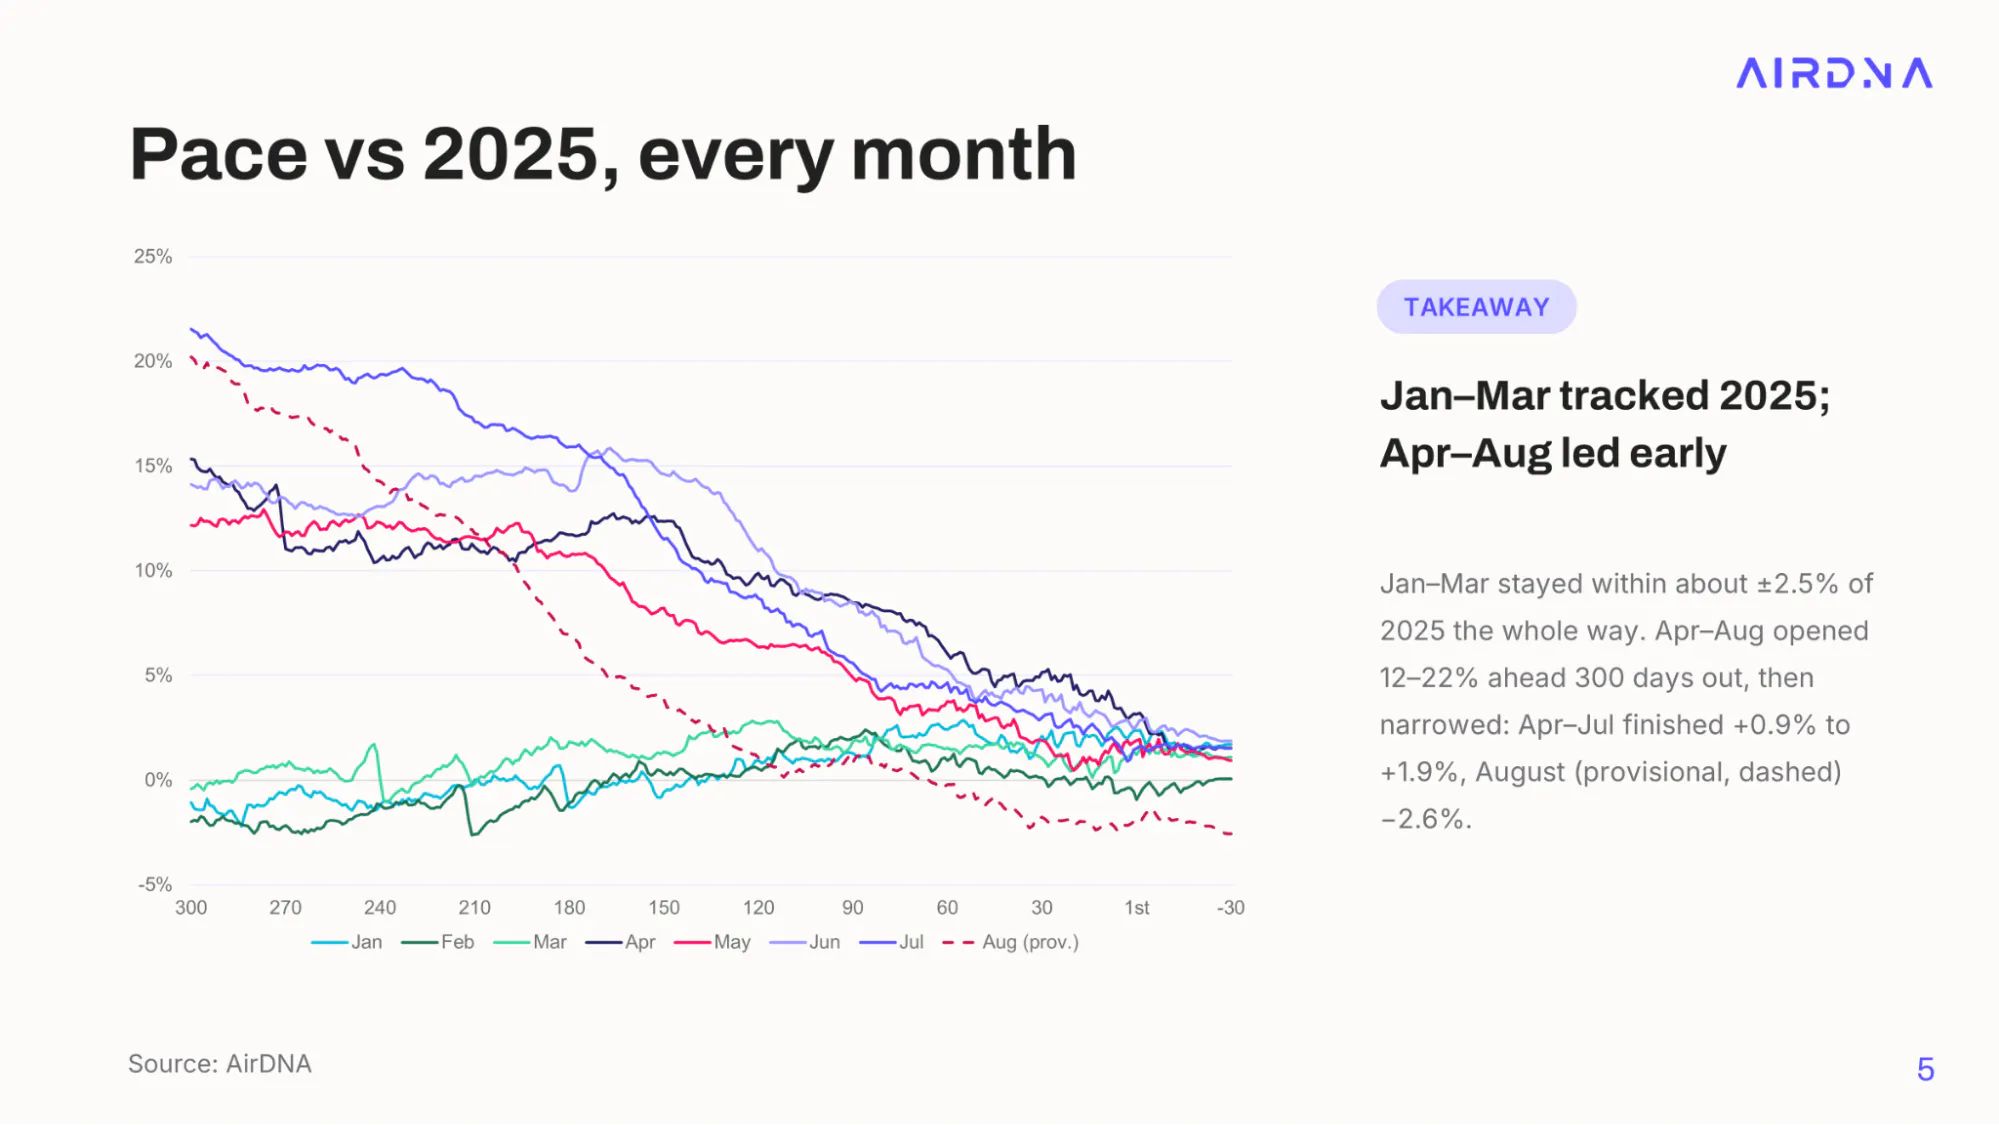
For now, the pacing progression appears to be holding relatively steady, meaning lead times are changing consistently from month to month. The reasons are open to speculation. Rising gas prices and broader economic and geopolitical uncertainty may have led travelers to book earlier, or at least to skip last-minute trips. The 2026 FIFA World Cup may also have made travelers think twice about last-minute trips, lest they unwittingly land in a soccer crowd.
Coastal Resorts and Suburbs Lost the Most Last-Minute Bookings
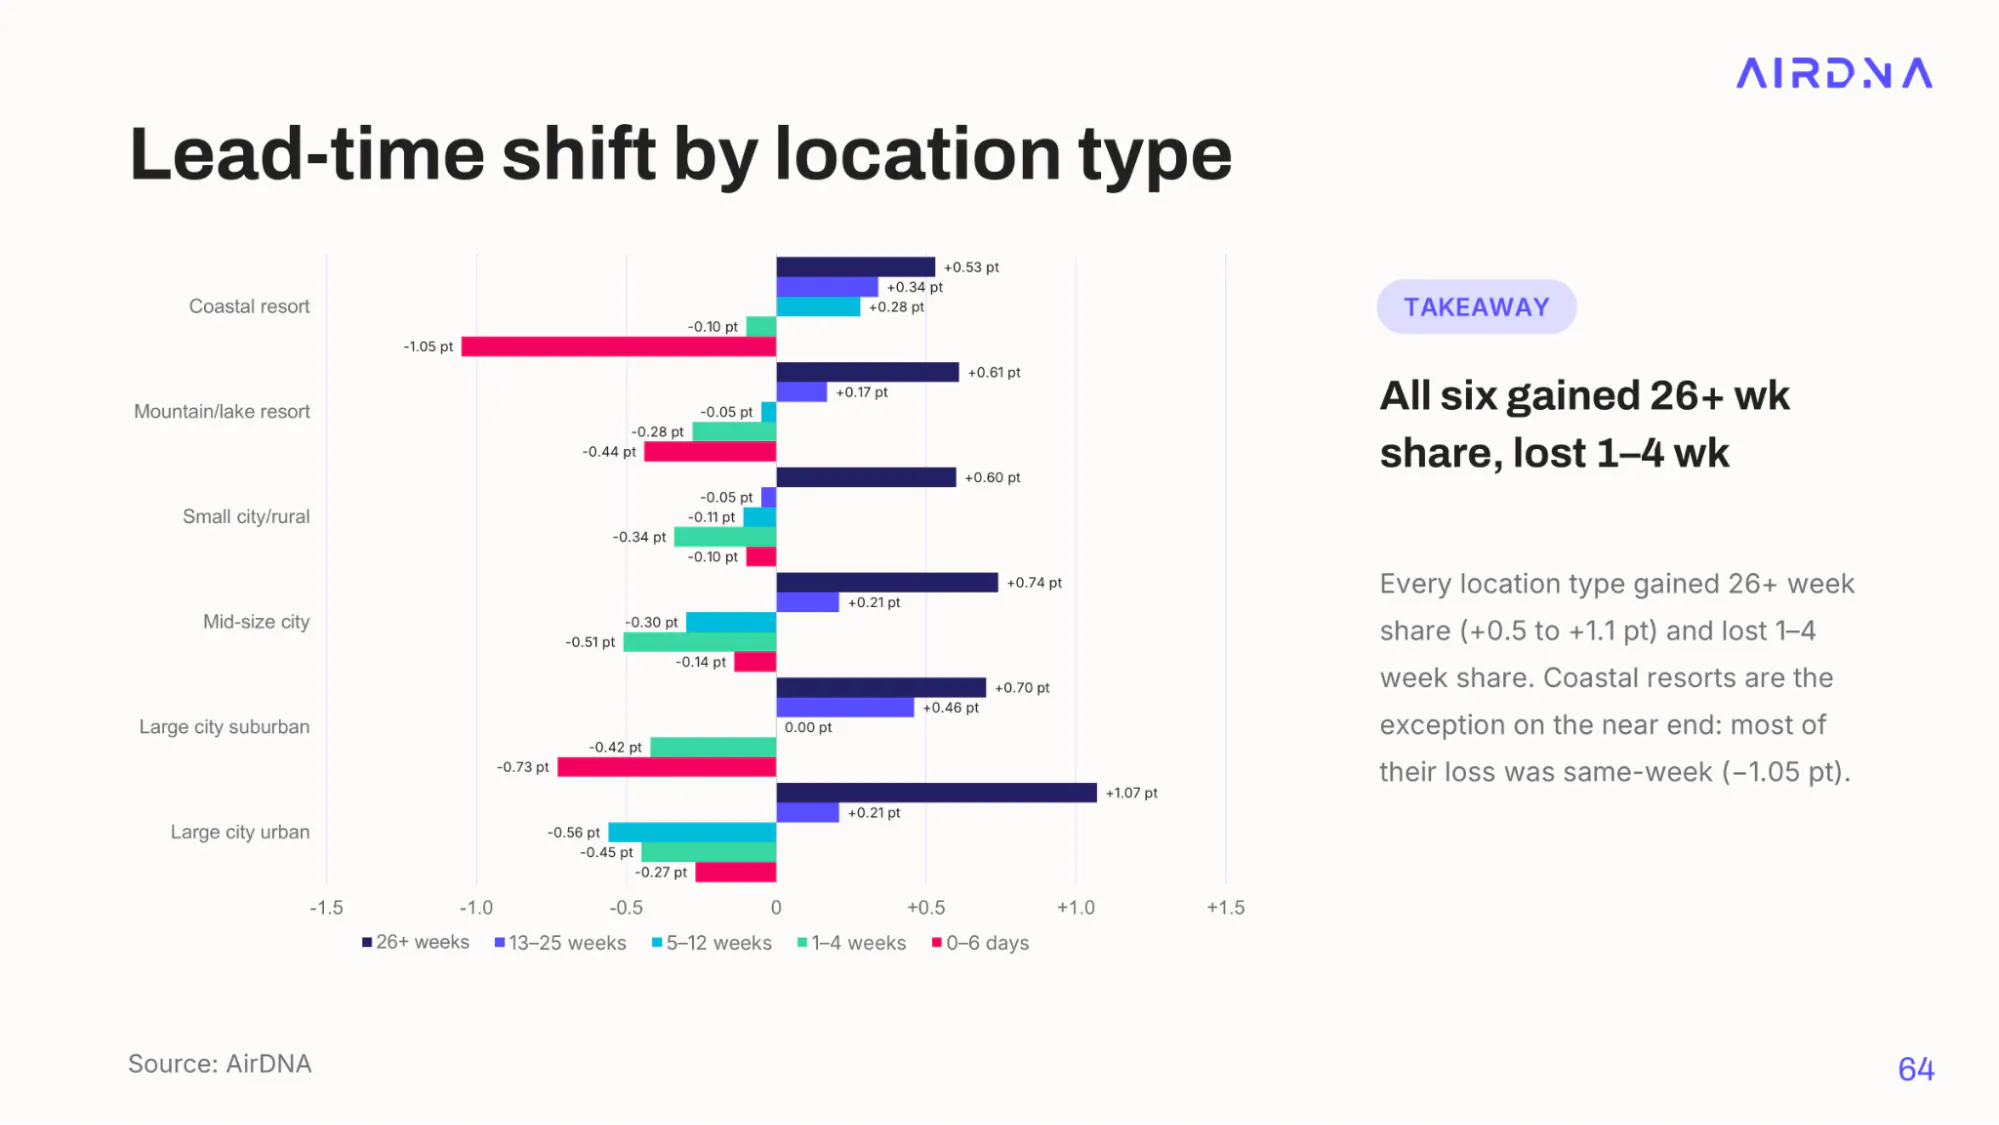
Location data gives some weight to the deliberate-travel hypothesis, as the biggest declines in last-minute bookings occurred in coastal resorts and large-city suburbs. Large urban markets, on the other hand, saw the largest increase in bookings made 26 or more weeks out, perhaps from travelers coming to see the World Cup. Both effects could be contributing to the overall pattern.
Build your comp set
Pick the properties that match yours and benchmark against real competitors, not city averages.
Budget and Economy Listings Are Booked Furthest Ahead
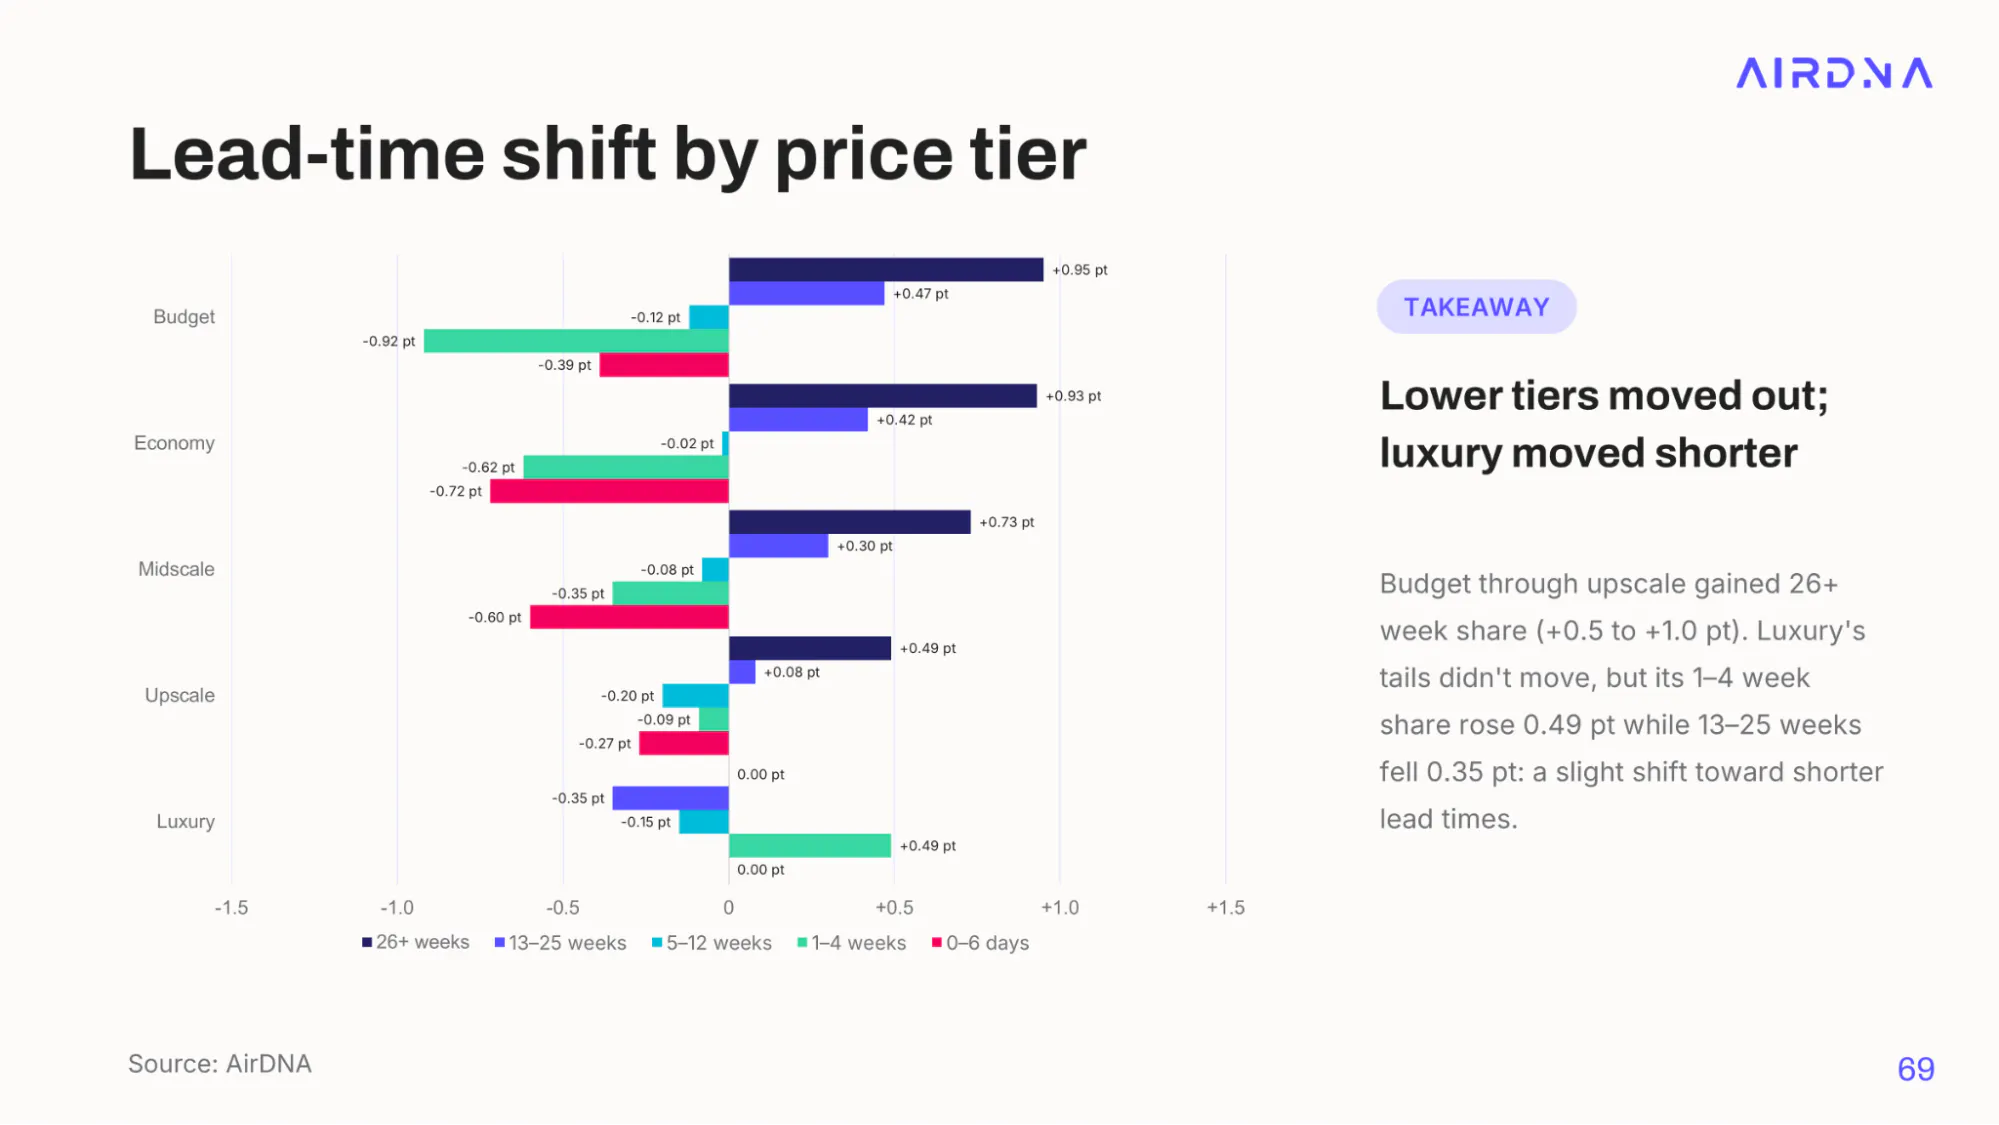
Price tiers give a clear impression that the lengthening of lead times is more pronounced at the lower end. Economy listings saw the largest reduction in last-minute bookings, while budget listings saw the largest increase in bookings made far in advance. Luxury listings appear to have shortened lead times slightly, as wealthier travelers still feel free to wait, reasonably confident that luxury listings will still have availability close to the stay date.
What Hosts Should Do: Hold Rates Until 60 to 90 Days Out
For operators, this shift in guest behavior has clear implications. Until booking behavior shifts again, year-over-year pacing will overstate final realized demand in proportion to the time left before the stay date. Pacing 10% ahead six months before the stay may end up as just a 1% to 2% increase in final demand. Pacing 10% ahead a few weeks before the stay, on the other hand, points to a final demand gain closer to 10%. In this environment, don’t raise rates too early. Hold steady until 60 to 90 days before the stay date, when pacing begins to converge on the true value.
This analysis also has two positives. First, demand is still increasing. Final realized demand was up year over year in every month except August, and that decline largely reflects the Labor Day calendar shift. Second, the most frustrating trend of the past few years, short lead times and last-minute bookings, seems to be on the wane.
FAQs
What is booking lead time?
Booking lead time is the number of days between when a guest makes a reservation and their check-in date. In the U.S., the median lead time has generally ranged between about 20 and 40 days, depending on the month booked.
Are guests booking short-term rentals earlier in 2026?
Yes. U.S. booking lead times began lengthening in the second half of 2025 and rose sharply in 2026, with August and September 2026 showing the biggest year-over-year increases since 2022. The share of bookings made 26 or more weeks out grew, while the share made within six days of check-in fell 0.5 percentage points.
Why does longer lead time make pacing overstate demand?
When guests book earlier, more nights are on the books at any given point before the stay, which looks like stronger demand. For January to July 2026 stays, nights on the books were 8.4% ahead of 2025 at 180 days out, but final demand ended just 1.3% higher.
Which short-term rentals saw the biggest drop in last-minute bookings?
Coastal resorts saw the largest drop in same-week bookings, followed by large-city suburbs. By price tier, economy listings lost the most last-minute share, while luxury listings shifted slightly toward shorter lead times.
When should hosts raise rates based on pacing?
Avoid raising rates on early pacing alone. A 10% pace six months out may translate into just a 1% to 2% gain in final demand. Pacing becomes reliable around 60 to 90 days before the stay date, which is the better point to adjust rates.
ARTICLE SUMMARY
Booking lead times in the U.S. began lengthening in late 2025 and jumped in 2026. Early bookers now make year-over-year pacing look stronger than the demand that is finally realized: January to July 2026 stays paced 8.4% ahead at 180 days out but finished just 1.3% ahead. AirDNA’s Bram Gallagher breaks down where the shift is happening and what it means for pricing.
Bram Gallagher
AirDNA Director of Economics and Forecasting
Bram Gallagher is an Economist at AirDNA, specializing in uncovering insights that drive smarter short-term rental decisions. He put his Ph.D. in Economics from the University of Georgia to work researching and forecasting hotel data with CBRE prior to joining AirDNA, as well as teaching economics at a number of universities. In his spare time, Bram enjoys making wooden furniture with hand tools.
