

 Calculate Revenue
 Research Markets
 Find For Sale Properties
 Compare My Listing
 STR Revenue Calculator
 Custom Comp Sets
 Submarket Insights
 Custom Search Filters
 Rate Recommendations
 Performance Benchmarking
 Competitor Comparison
 Owner Contact Details
 Property-level performance data
 Tourism Insights
 Real Estate Investment Analytics
 About Us
 Sales
Sales Support
 Press
Press2026 Short-Term Rental Investor Survey

STR Investing Has Grown Up
The 2026 outlook for short-term rental (STR) investment is not defined by retreat or exuberance. It is characterized by selectivity.
Investors remain engaged, but behavior has changed. Investment activity is increasingly concentrated among experienced operators, underwriting discipline has tightened, and market selection has become more intentional. Rather than signaling weakness, these shifts point to a maturing market.
This year’s AirDNA Investor Survey highlights three clear themes.
First, near-term acquisition activity is being driven by existing, scaled operators. Investors with multiple properties are far more likely to buy again in the next 12 months, while smaller and first-time investors remain cautious. Interest in STR investing remains high, but entry is more deliberate and paced.
Second, interest rates are shaping strategy rather than suppressing participation. Higher rates are forcing buyers to be more selective about purchase prices, more conservative in their return assumptions, and more deliberate in how much debt they use. Investors are adapting through alternative financing, more conservative underwriting, and tighter market selection.
Third, investor priorities evolve with experience. New entrants tend to favor familiar, liquid markets, while more experienced operators increasingly target specialized, experiential destinations where demand durability and pricing power are stronger. Over time, STR investing becomes less about convenience and more about competitive advantage.
Taken together, the data points to a market that is stabilizing and professionalizing rather than contracting. Supply growth is likely to remain slower and more concentrated, driven by investors with experience, infrastructure, and conviction. The easy-money era may be over, but the short-term rental investment thesis remains very much intact.
Smart investments happen here.
AirDNA’s powerful yet easy-to-use tools make hosting and investing a breeze. This means having every insight you need, all in one place, always up-to-date.
Methodology
The 2026 AirDNA Investor Survey collected responses from 652 participants during Q4 2025. Respondents included a mix of current short-term rental owners and operators, as well as prospective investors considering entry into the STR market. The majority of respondents were based in the U.S. and this survey analysis only includes insights from short-term rental stakeholders investing and operating in the U.S.
Of the total respondents:
- 429 currently own or operate one or more short-term rental properties
- 222 do not currently own STRs, the majority of whom report actively considering their first investment
Survey questions covered acquisition intent, market selection, financing strategies, macroeconomic views, and perceived constraints. Several questions allowed respondents to select multiple answers. In those cases, results reflect the share of respondents selecting each option rather than mutually exclusive percentages.
Throughout the analysis, cross-tabulations were used to identify meaningful differences in behavior and sentiment by experience level, portfolio size, and investment intent. These segmentations help distinguish between first-time investors, growing operators, and scaled portfolios, and provide insight into how strategy evolves across the investor lifecycle.
Section 1: Who Responded to the Survey
This report is based on responses from a broad cross-section of the short-term rental ecosystem, spanning first-time investors, seasoned operators, and industry professionals involved in operating and financing STRs.
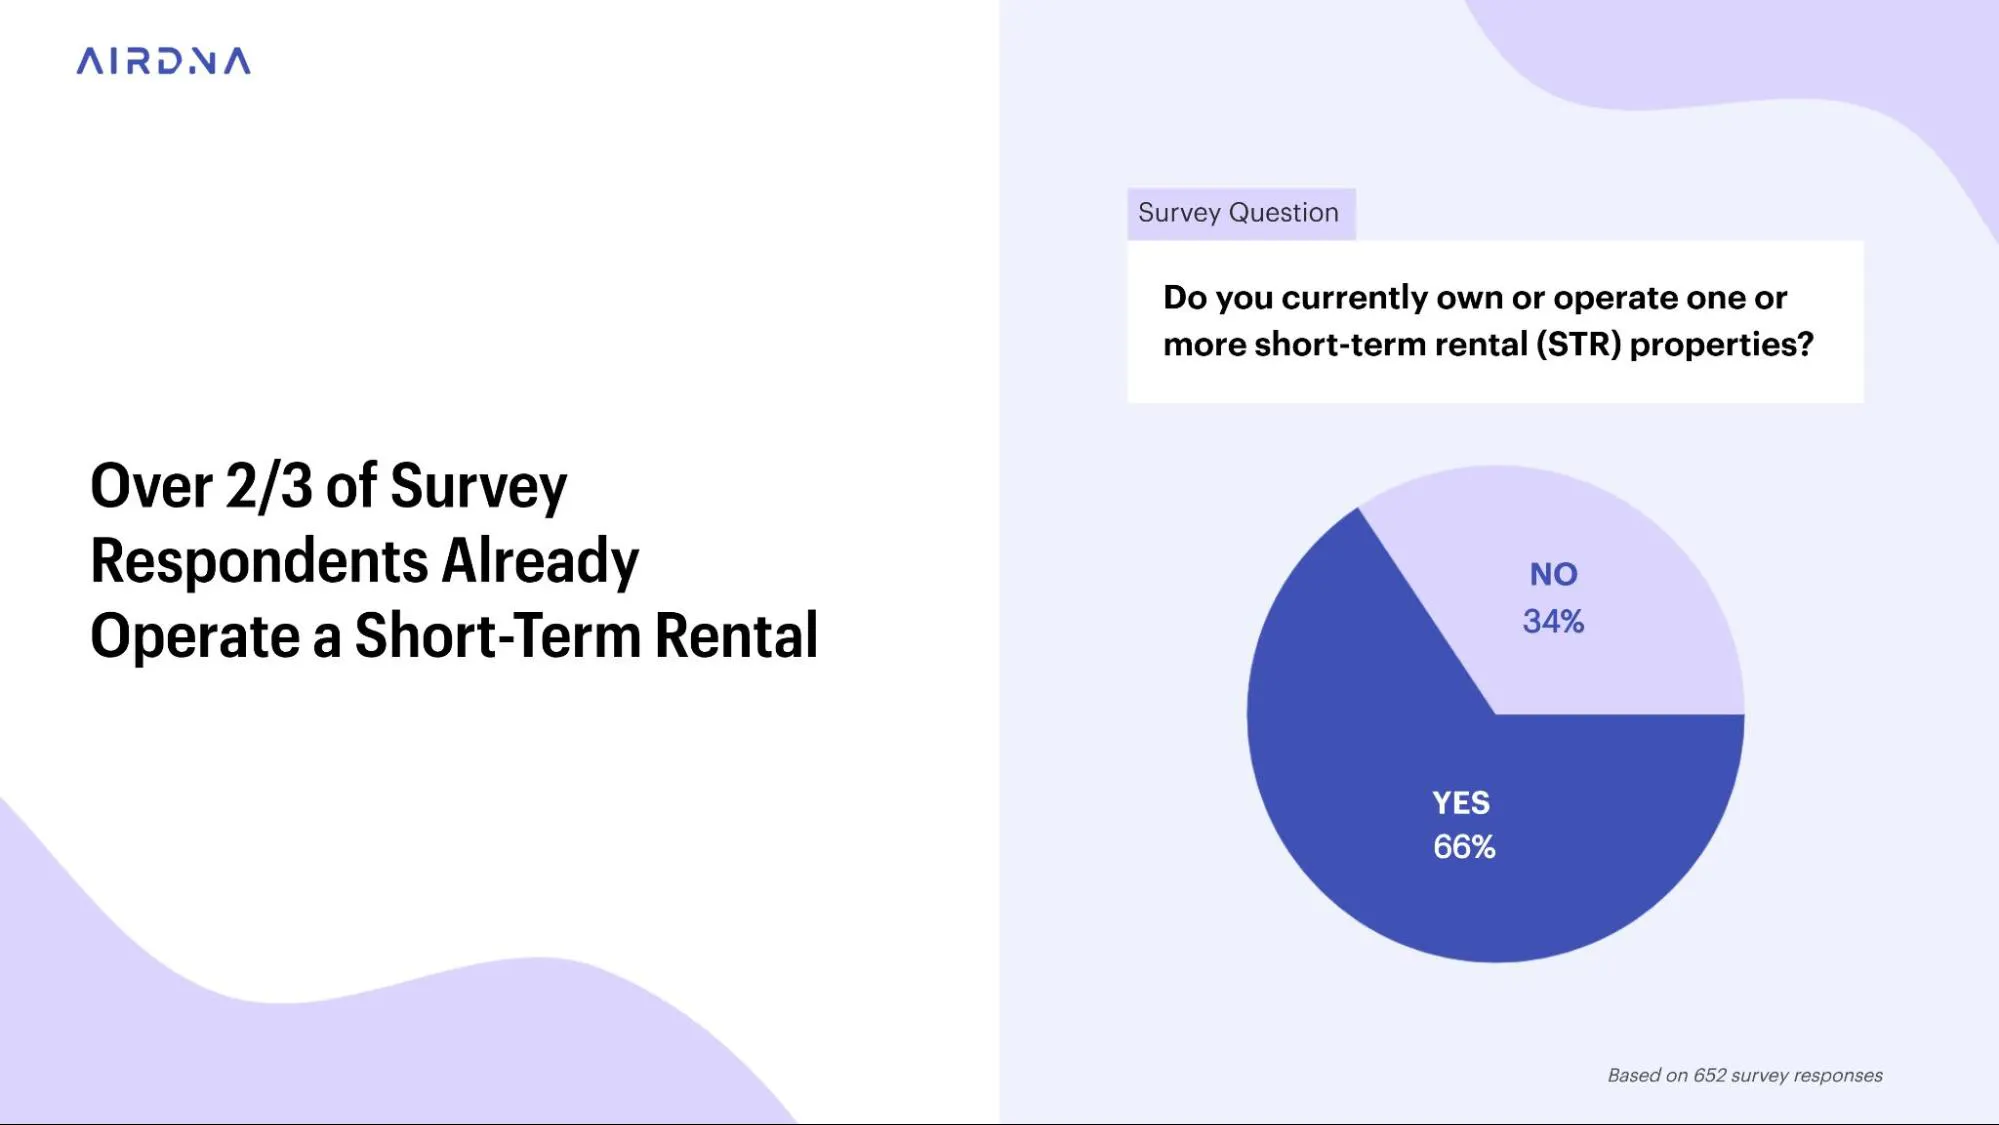
Across all respondents, roughly two-thirds currently own or operate one or more short-term rental properties. The remaining respondents represent future or potential entrants, providing visibility into both active market participants and those considering entry.
Ownership and roles
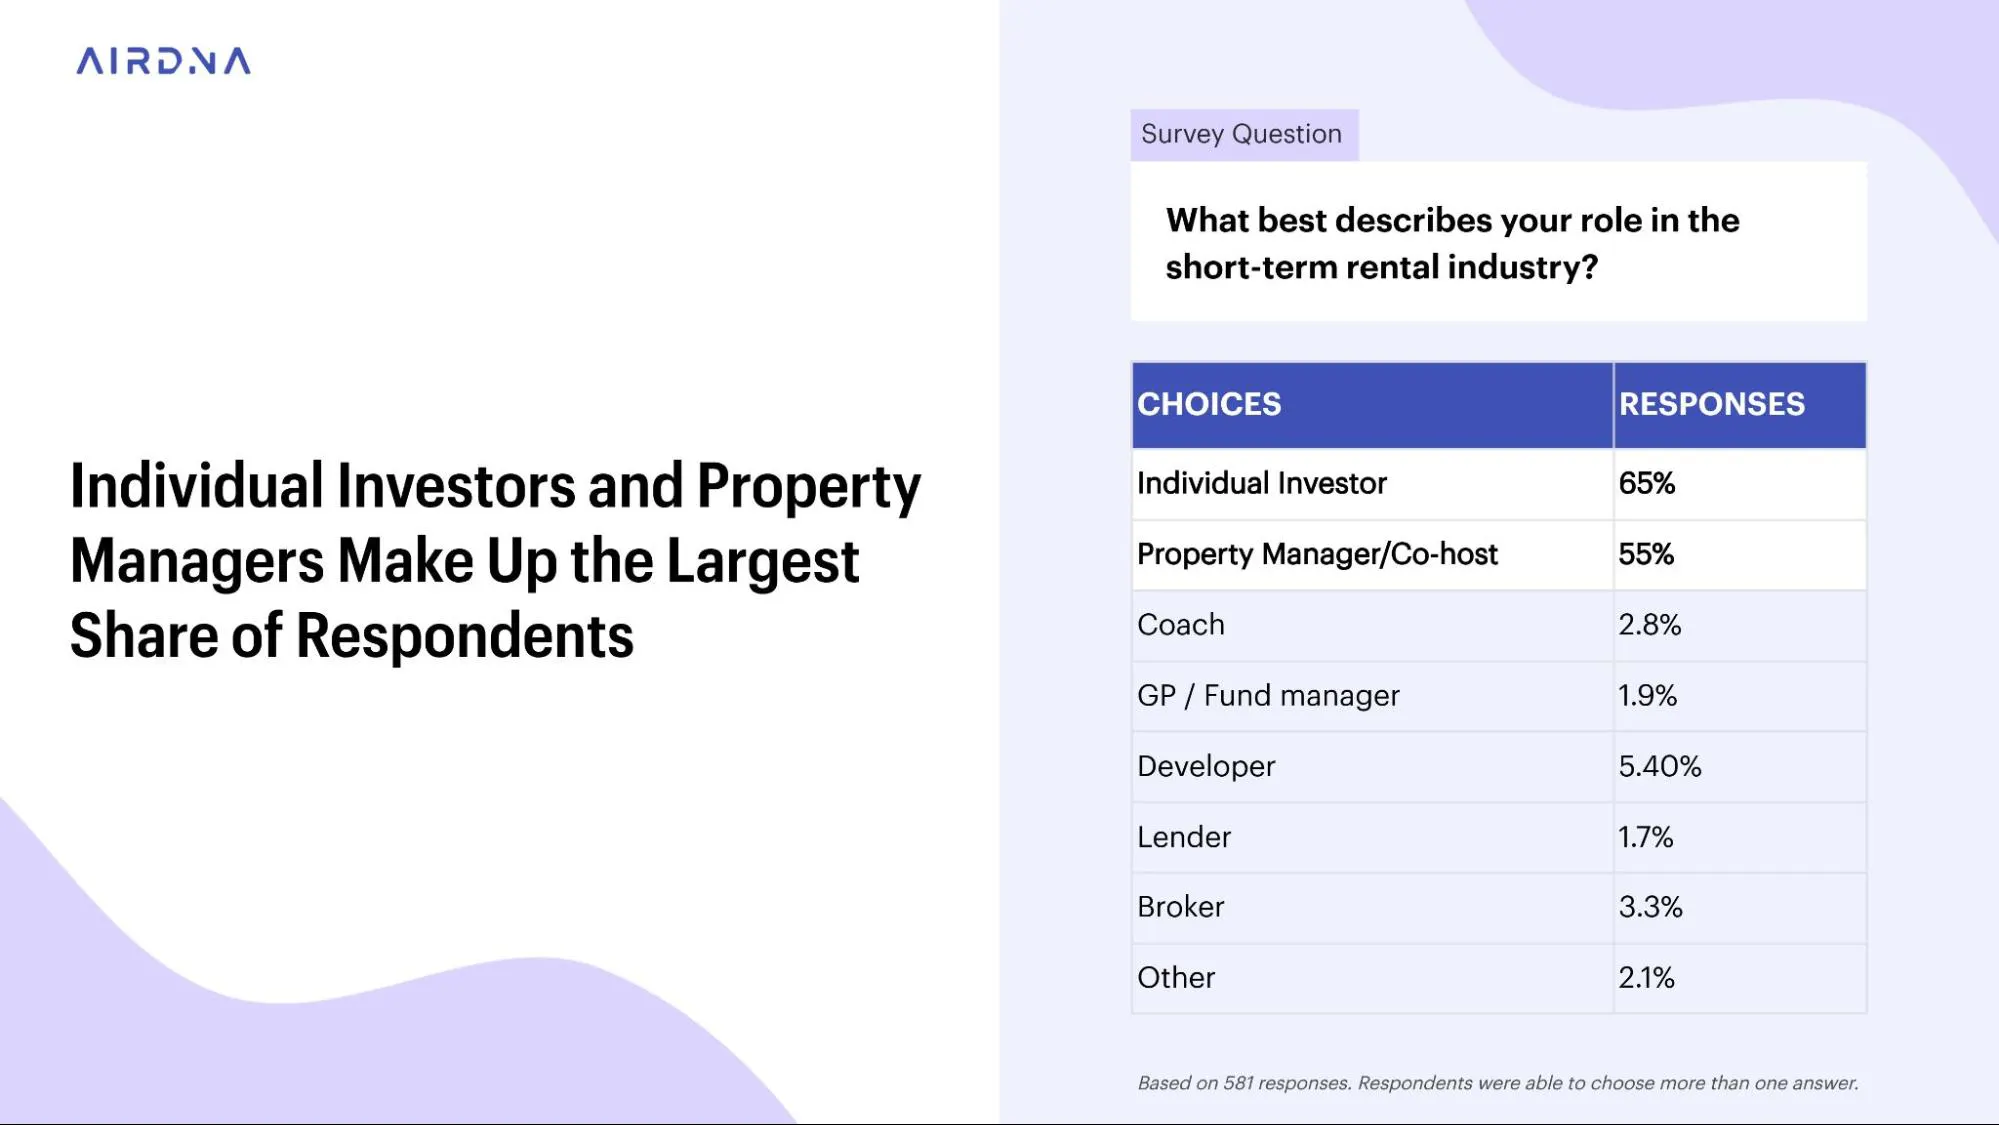
Among respondents who are actively involved in short-term rentals, individual investors make up the largest share. Property managers and co-hosts represent a substantial secondary segment, reflecting the growing role of professional management in the sector. Developers, lenders, brokers, and fund managers form a smaller but important minority, offering perspective from adjacent parts of the STR investment ecosystem.
This mix provides insight across the full investment lifecycle, from early-stage ownership through scaled operations and supporting services.
Portfolio size and experience
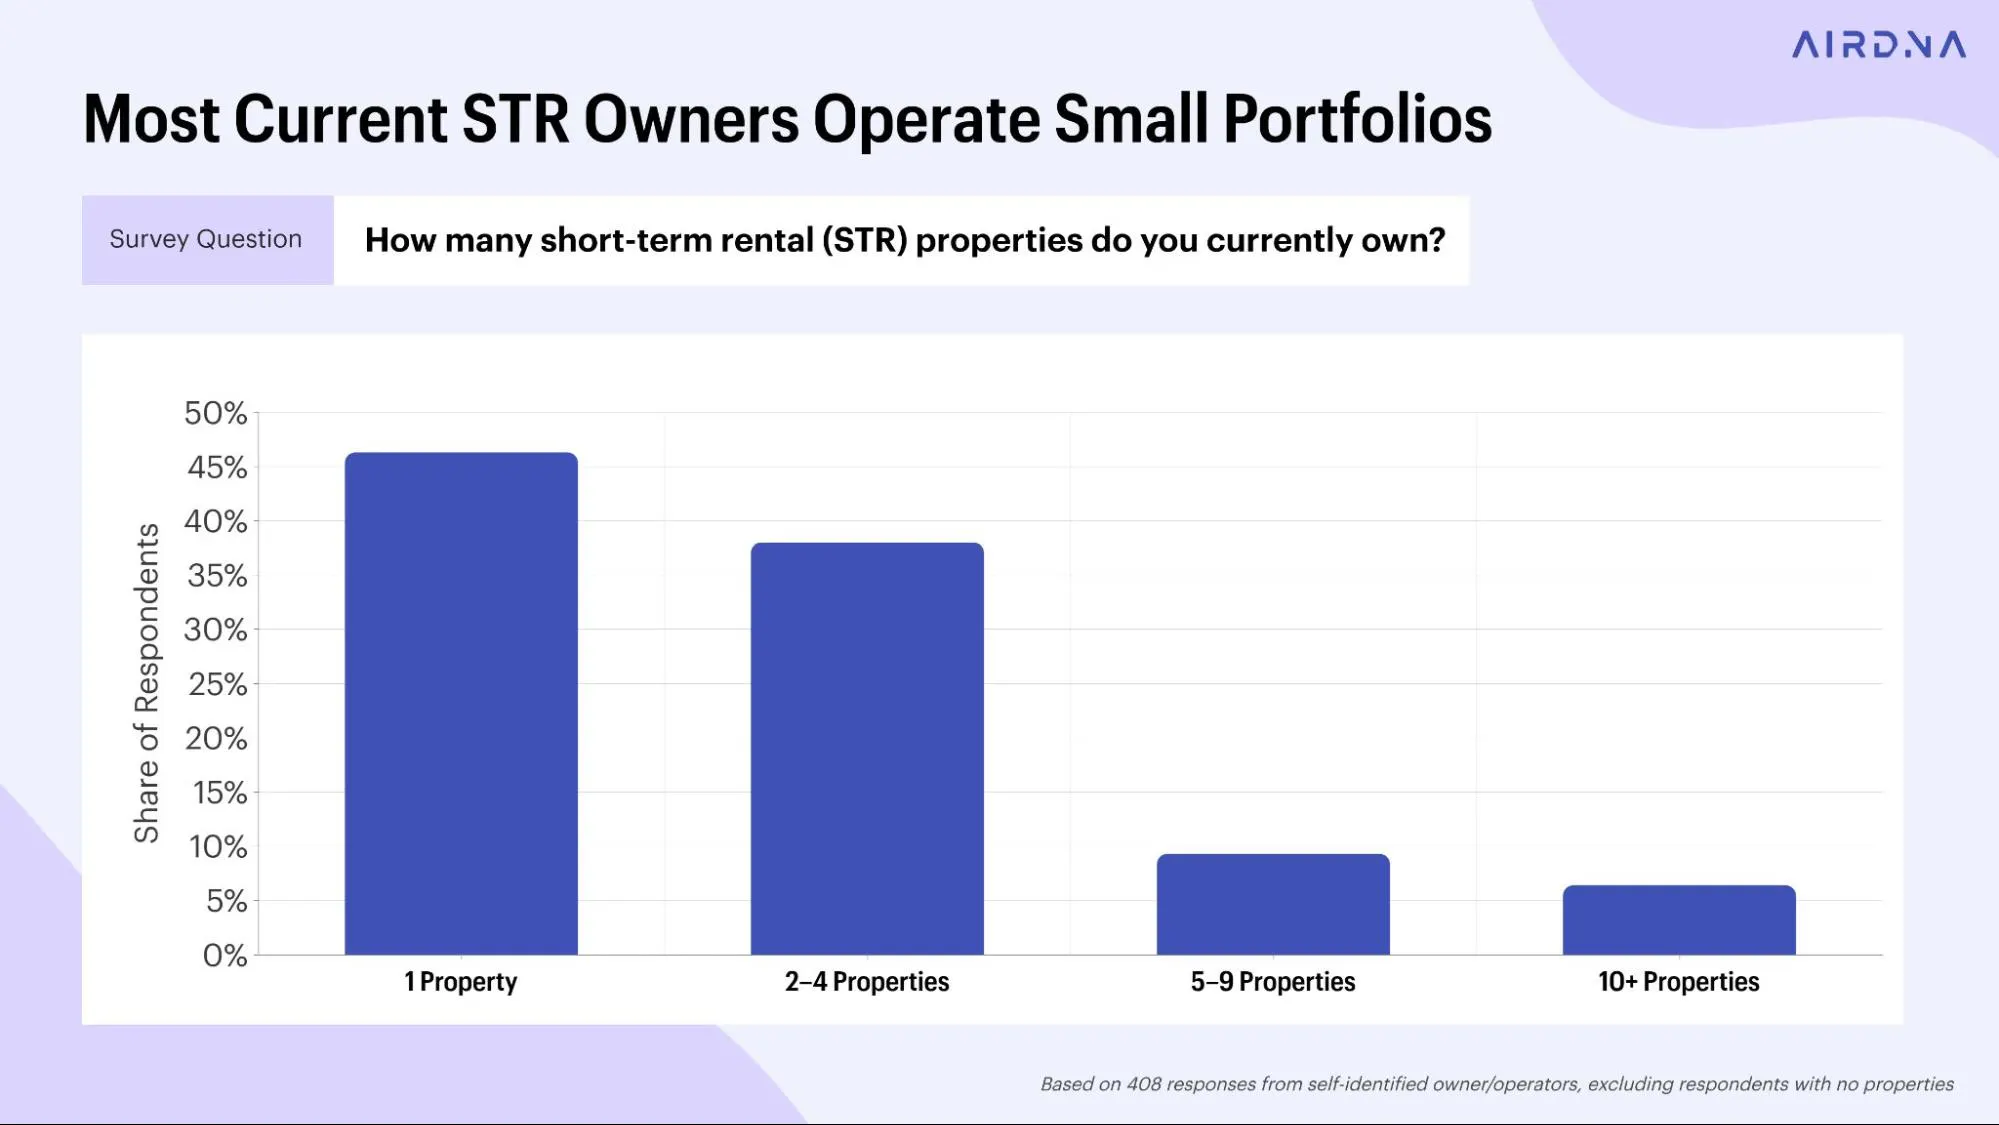
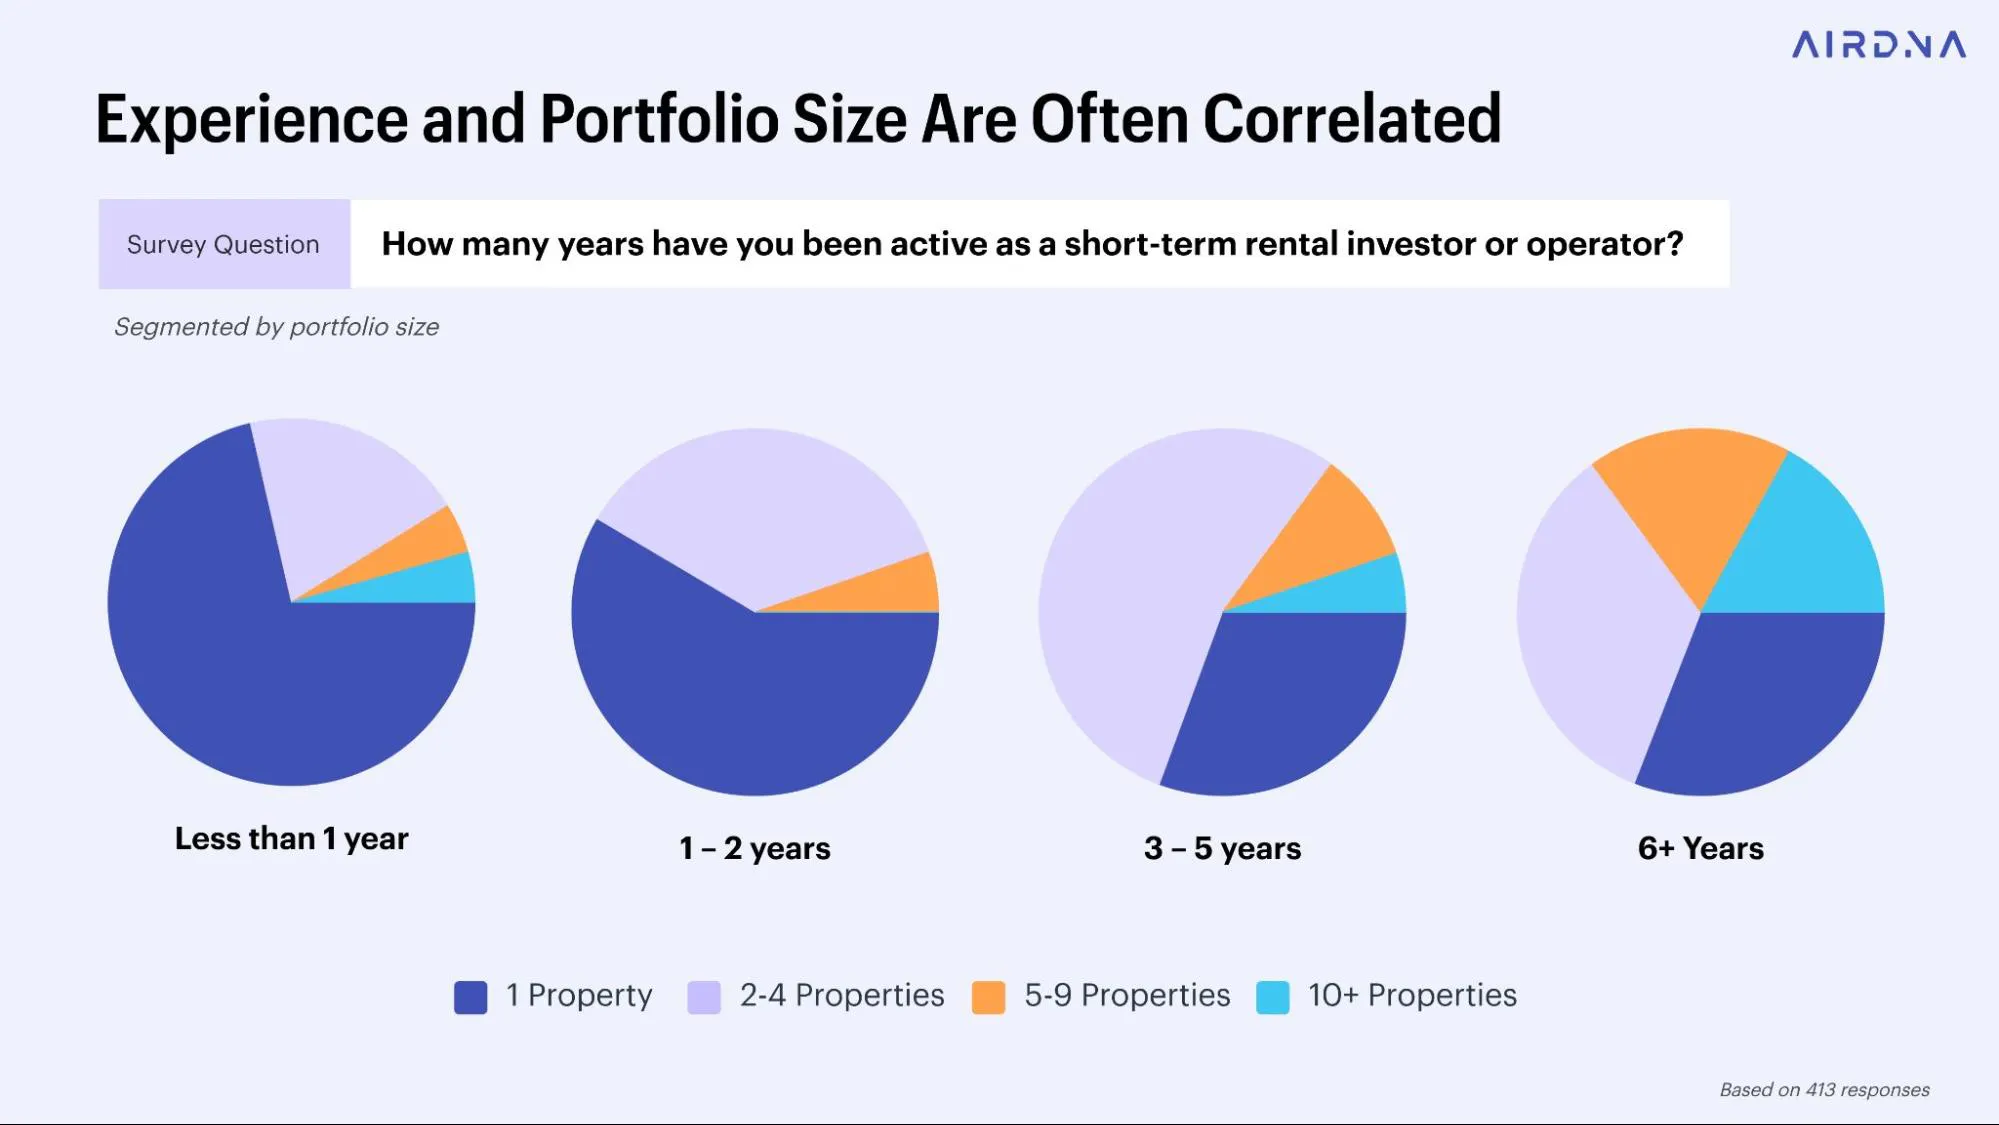
Most current STR owners who answered the survey operate relatively small portfolios, with the majority owning between one and four properties. At the same time, a meaningful minority operate five or more units, representing a cohort of scaled operators with more capital invested and greater operational complexity.
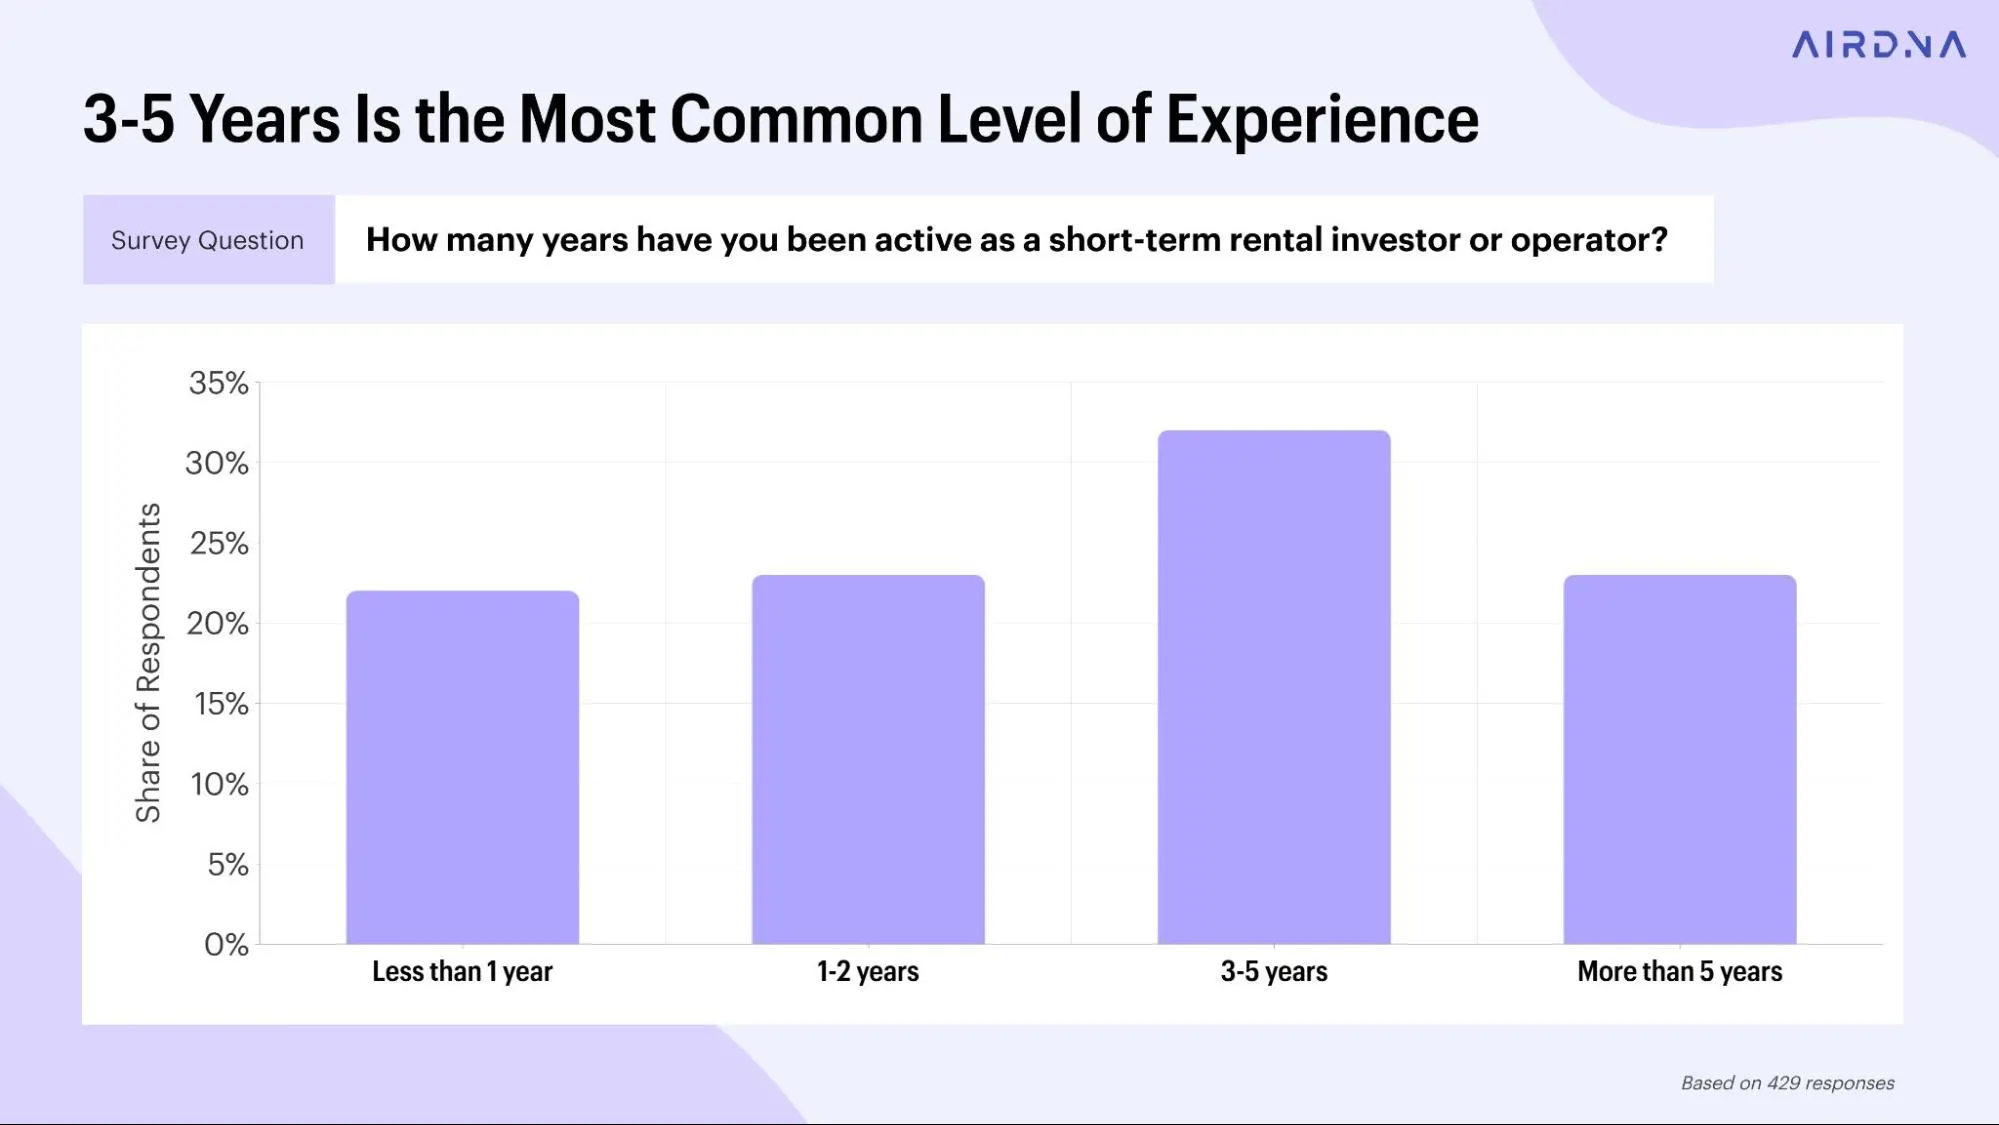
Respondents' experience levels skew toward the middle of the maturity curve. Three to five years of experience is the most common tenure, reflecting both pre- and post-pandemic market entry. A substantial share of respondents report less than two years of experience, underscoring the influx of new investors over the past several years. A smaller but influential group has been active for six years or more, representing investors who have operated through multiple market cycles.
Together, this distribution enables meaningful comparisons among newer entrants, mid-cycle investors, and experienced operators throughout the report.
Experience and scale are not the same thing
While experience and portfolio size are often correlated, they are not identical. Some operators have scaled quickly over a relatively short period, while others have accumulated experience more gradually with smaller portfolios. Experience reflects time in the market. Scale reflects exposure and operational complexity. This distinction becomes important later in the report, as investment behavior often differs based on both tenure and scale.
Recognizing this difference allows the analysis to separate how investors learn from how they grow, and helps explain why acquisition intent, constraints, financing strategies, and market preferences diverge across groups.
Why this matters
The breadth of respondent experience and portfolio size provides the foundation for the insights that follow. Throughout the report, differences in behavior are less about optimism versus pessimism and more about where investors are in their journey. Understanding who responded to the survey is essential for interpreting how and why investment strategies have evolved.
Invest smarter with the metrics that matter.
The numbers don't lie. Discover markets that are really worth your investment, based on real properties that are for-sale today.
Section 2: Acquisition Intent for the Next 12 Months
Overall purchase sentiment
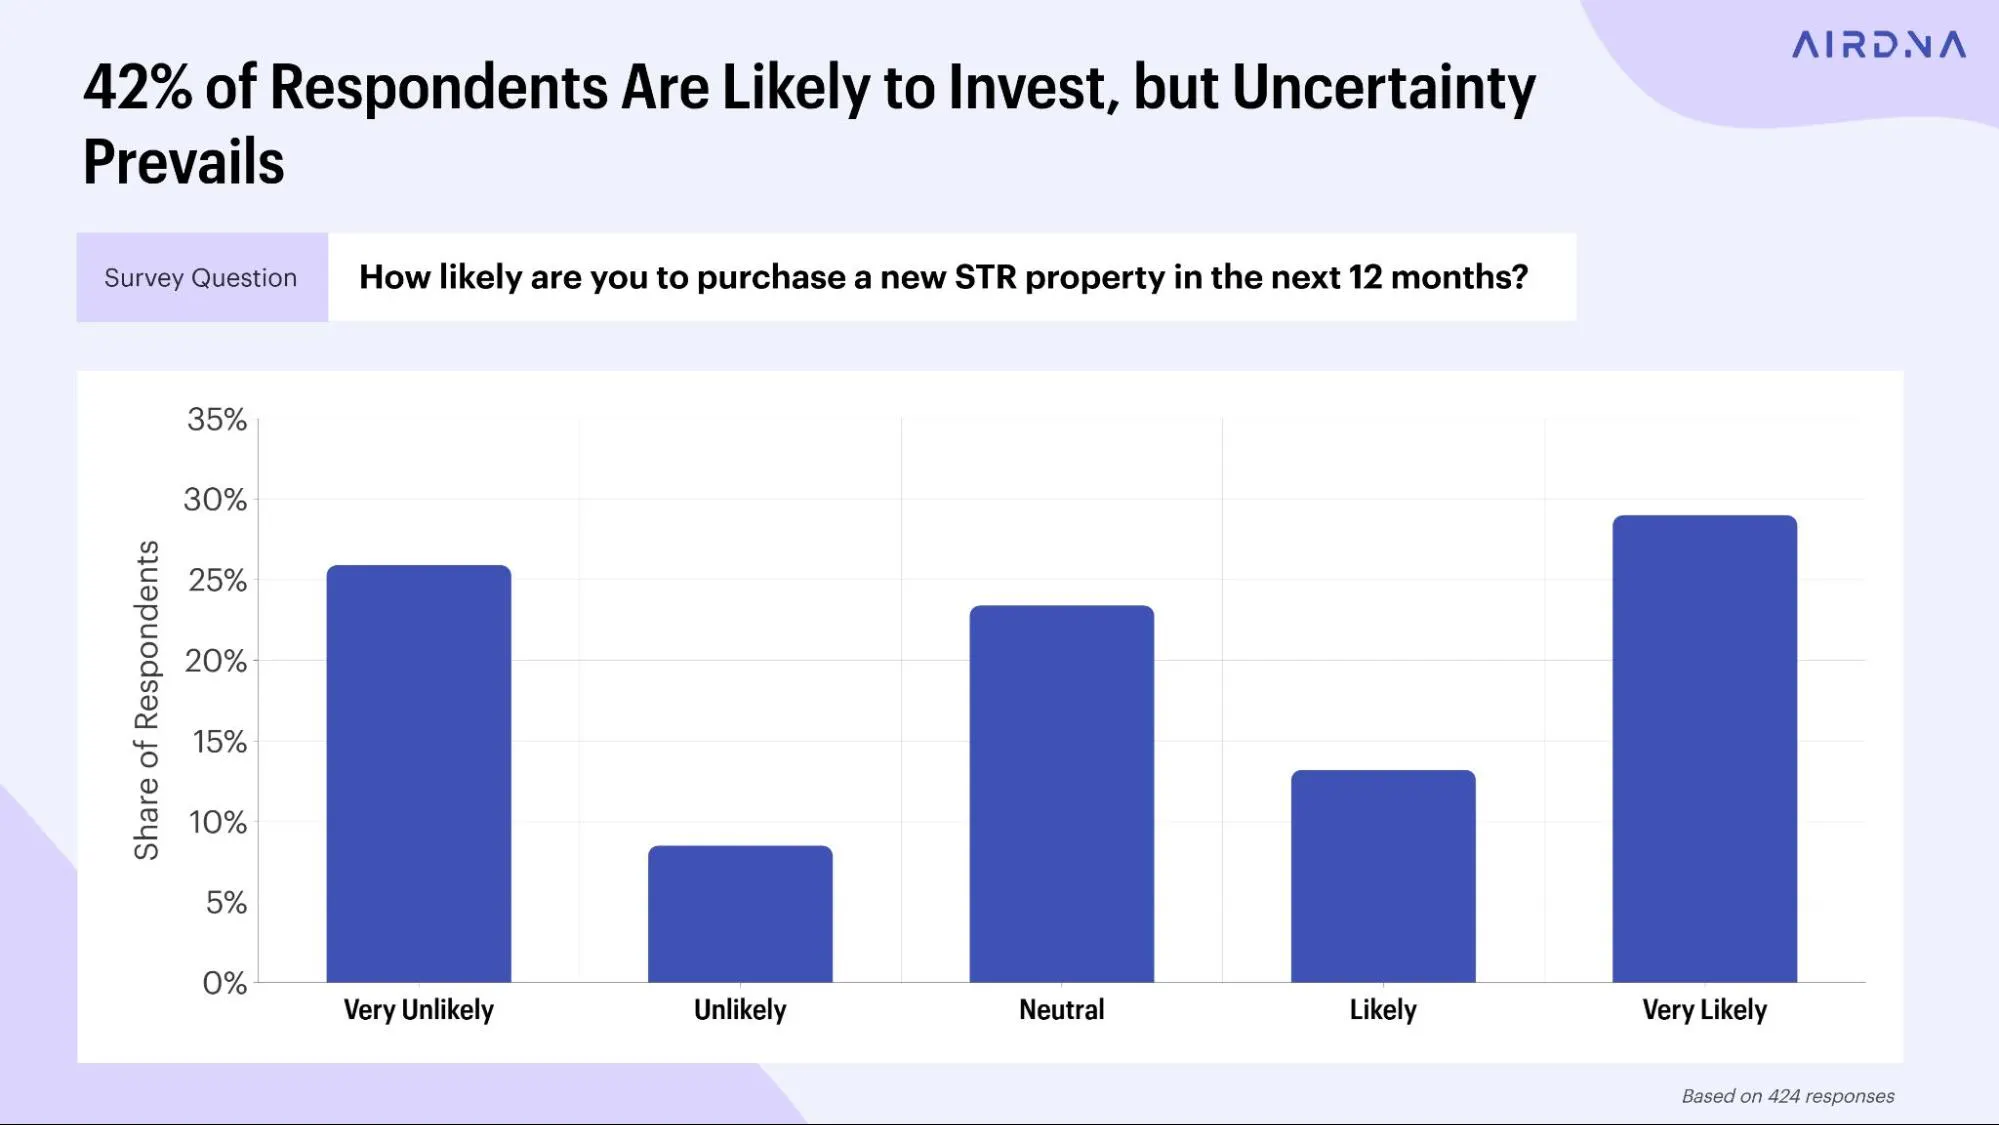
When existing investors and operators were asked how likely they are to purchase a new short-term rental property in the next 12 months, responses skewed slightly positive on average. However, the distribution of responses is wide. Rather than signaling a unified outlook, the results reflect a broad range of views on near-term opportunity in the STR market.
Some respondents express a clear intent to acquire another property, while others remain neutral or unlikely to buy. On its own, this topline view suggests uncertainty. However, it does not explain who is driving market activity.
Acquisition intent rises with scale
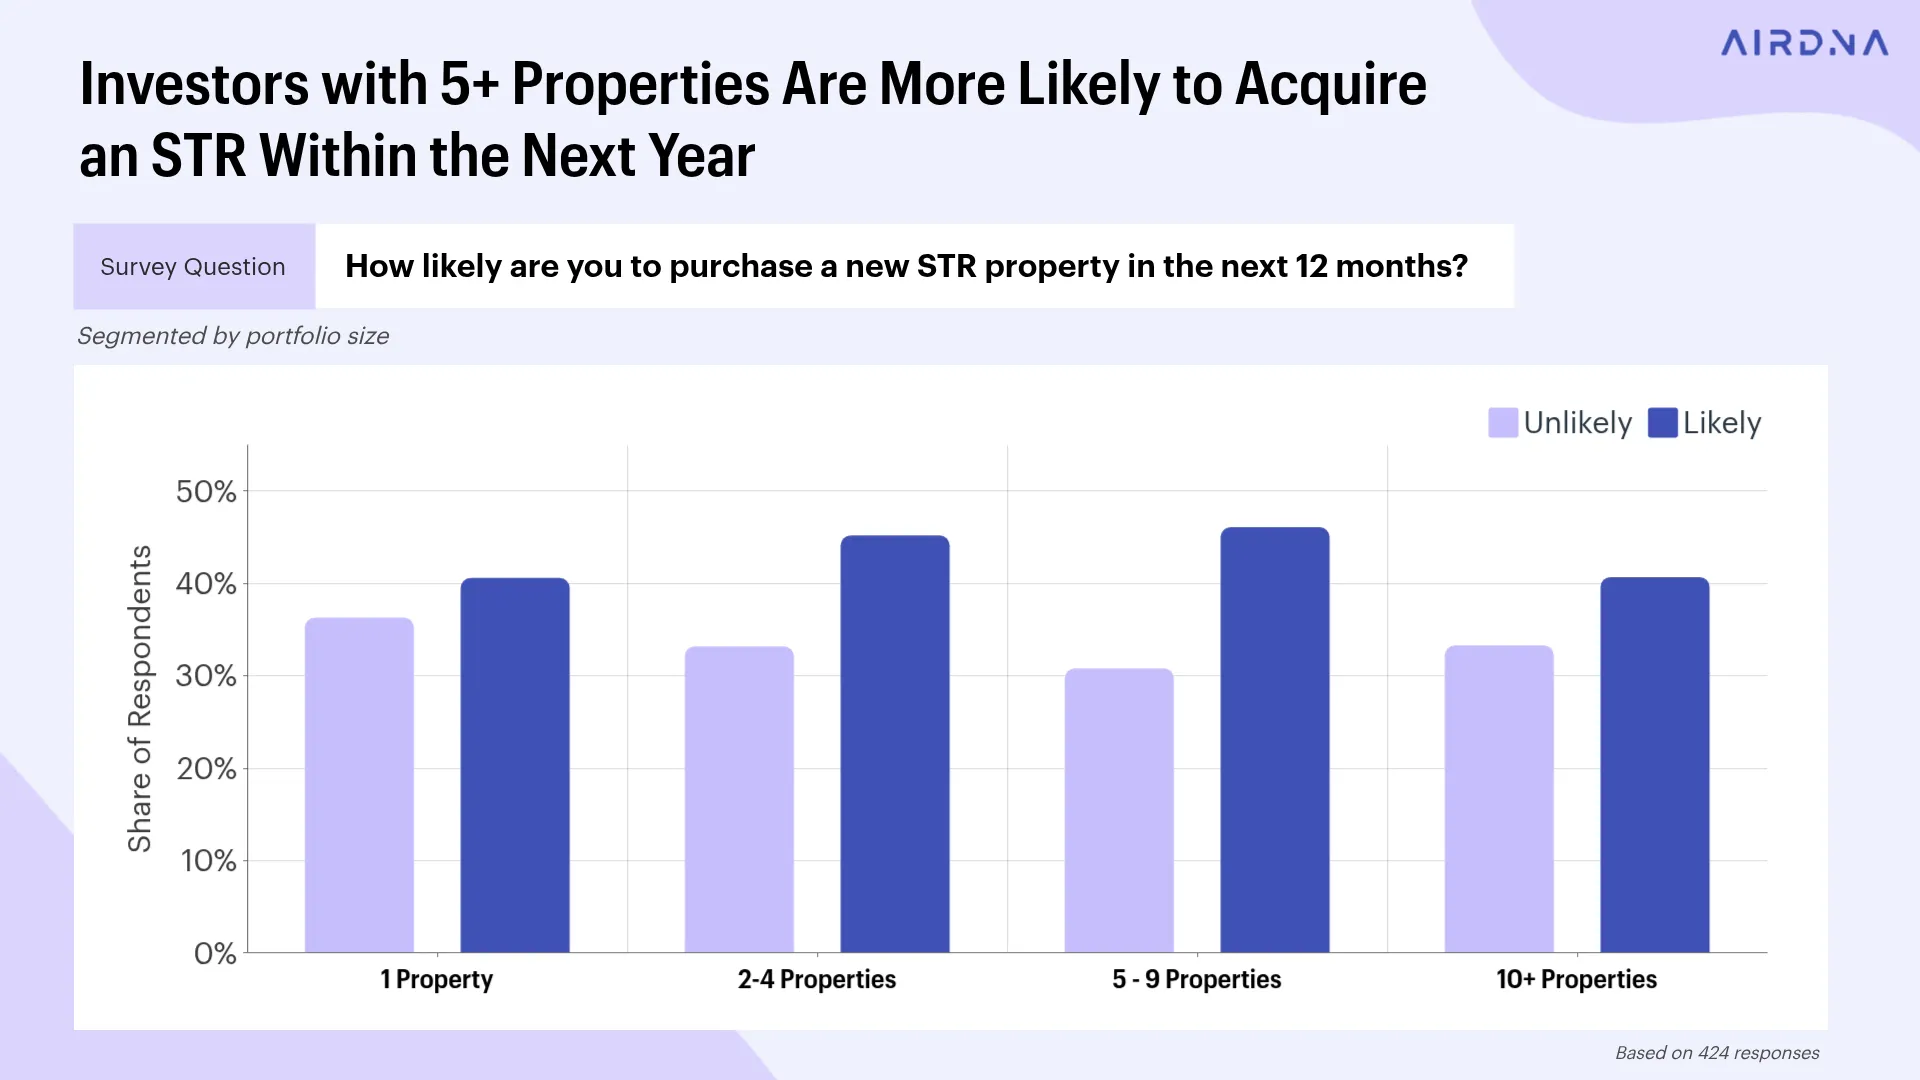
The underlying dynamic becomes clear when purchase intent is segmented by existing portfolio size.
Investors with five or more properties are significantly more likely to report that they are likely or very likely to acquire another STR within the next year. Among investors with ten or more properties, acquisition intent is especially concentrated at the high end of the scale. In contrast, investors with one property or fewer cluster much more heavily around neutral or low intent.
This divergence highlights an important shift in who is actively expanding in today’s market. Near-term acquisition activity is being driven primarily by experienced, multi-property operators building on existing portfolios, rather than by first-time or small-scale investors.
What this means for market activity
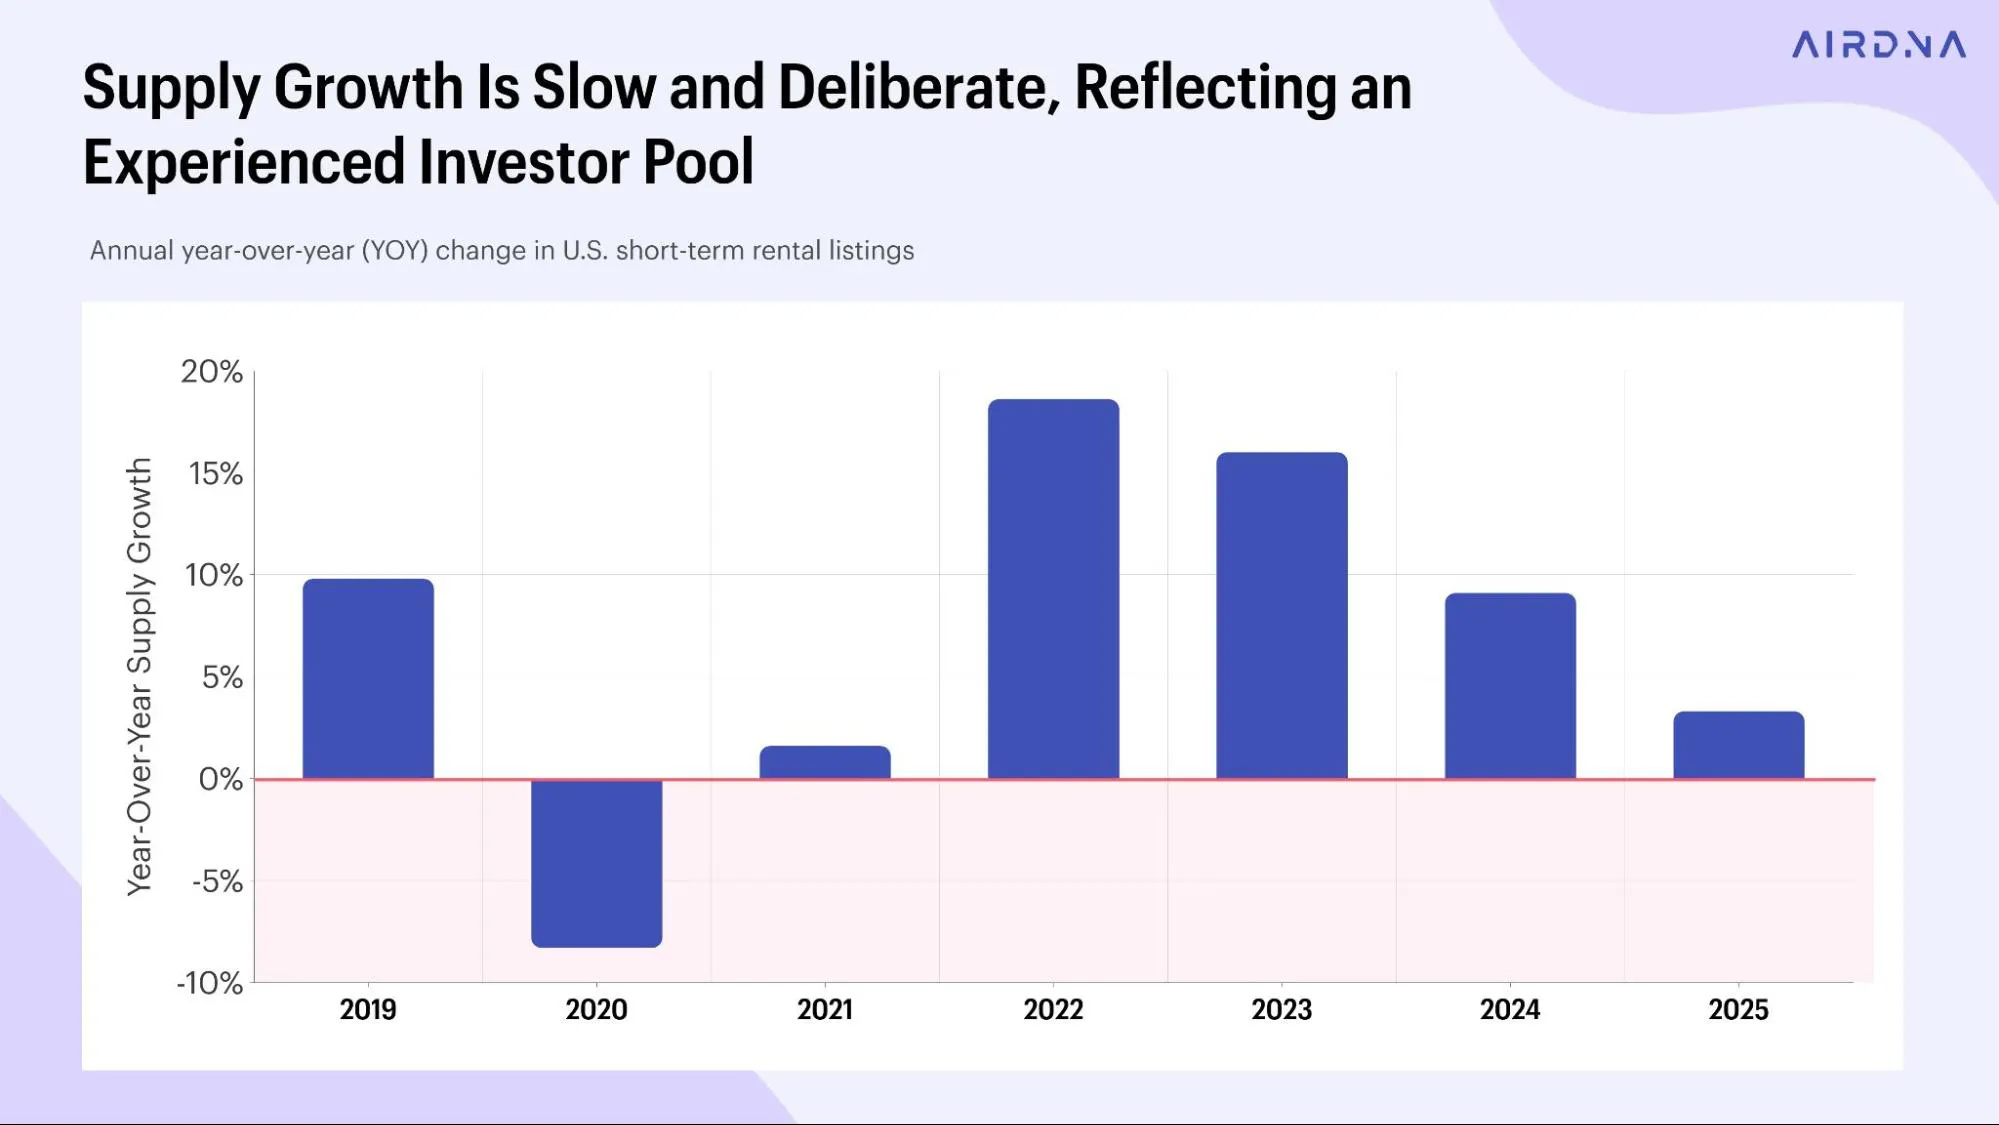
This pattern helps explain what we’re seeing in the short-term rental market today. Transaction volume remains uneven because buying demand is concentrated among a narrower group of experienced, multi-property operators. At the same time, prices haven’t collapsed because those buyers tend to be disciplined with defined acquisition criteria. Supply growth is slower than in prior years, just 3.3% growth in the U.S. in 2025, but it is also more deliberate, reflecting expansion by investors with experience, infrastructure, and capital already in place.
In short, acquisition intent has not disappeared. It has consolidated.
This finding is foundational for the rest of the report. It establishes that short-term rental investment activity is increasingly driven by scale and experience. This sets the stage for the shifts in financing strategies, market selection, and risk considerations explored in subsequent sections.
Discover hidden gems for your next investment
Get granular insights into which neighborhoods are hottest for vacation rentals.
Section 3: What’s Holding Investors Back from Buying
Primary constraints to acquisition
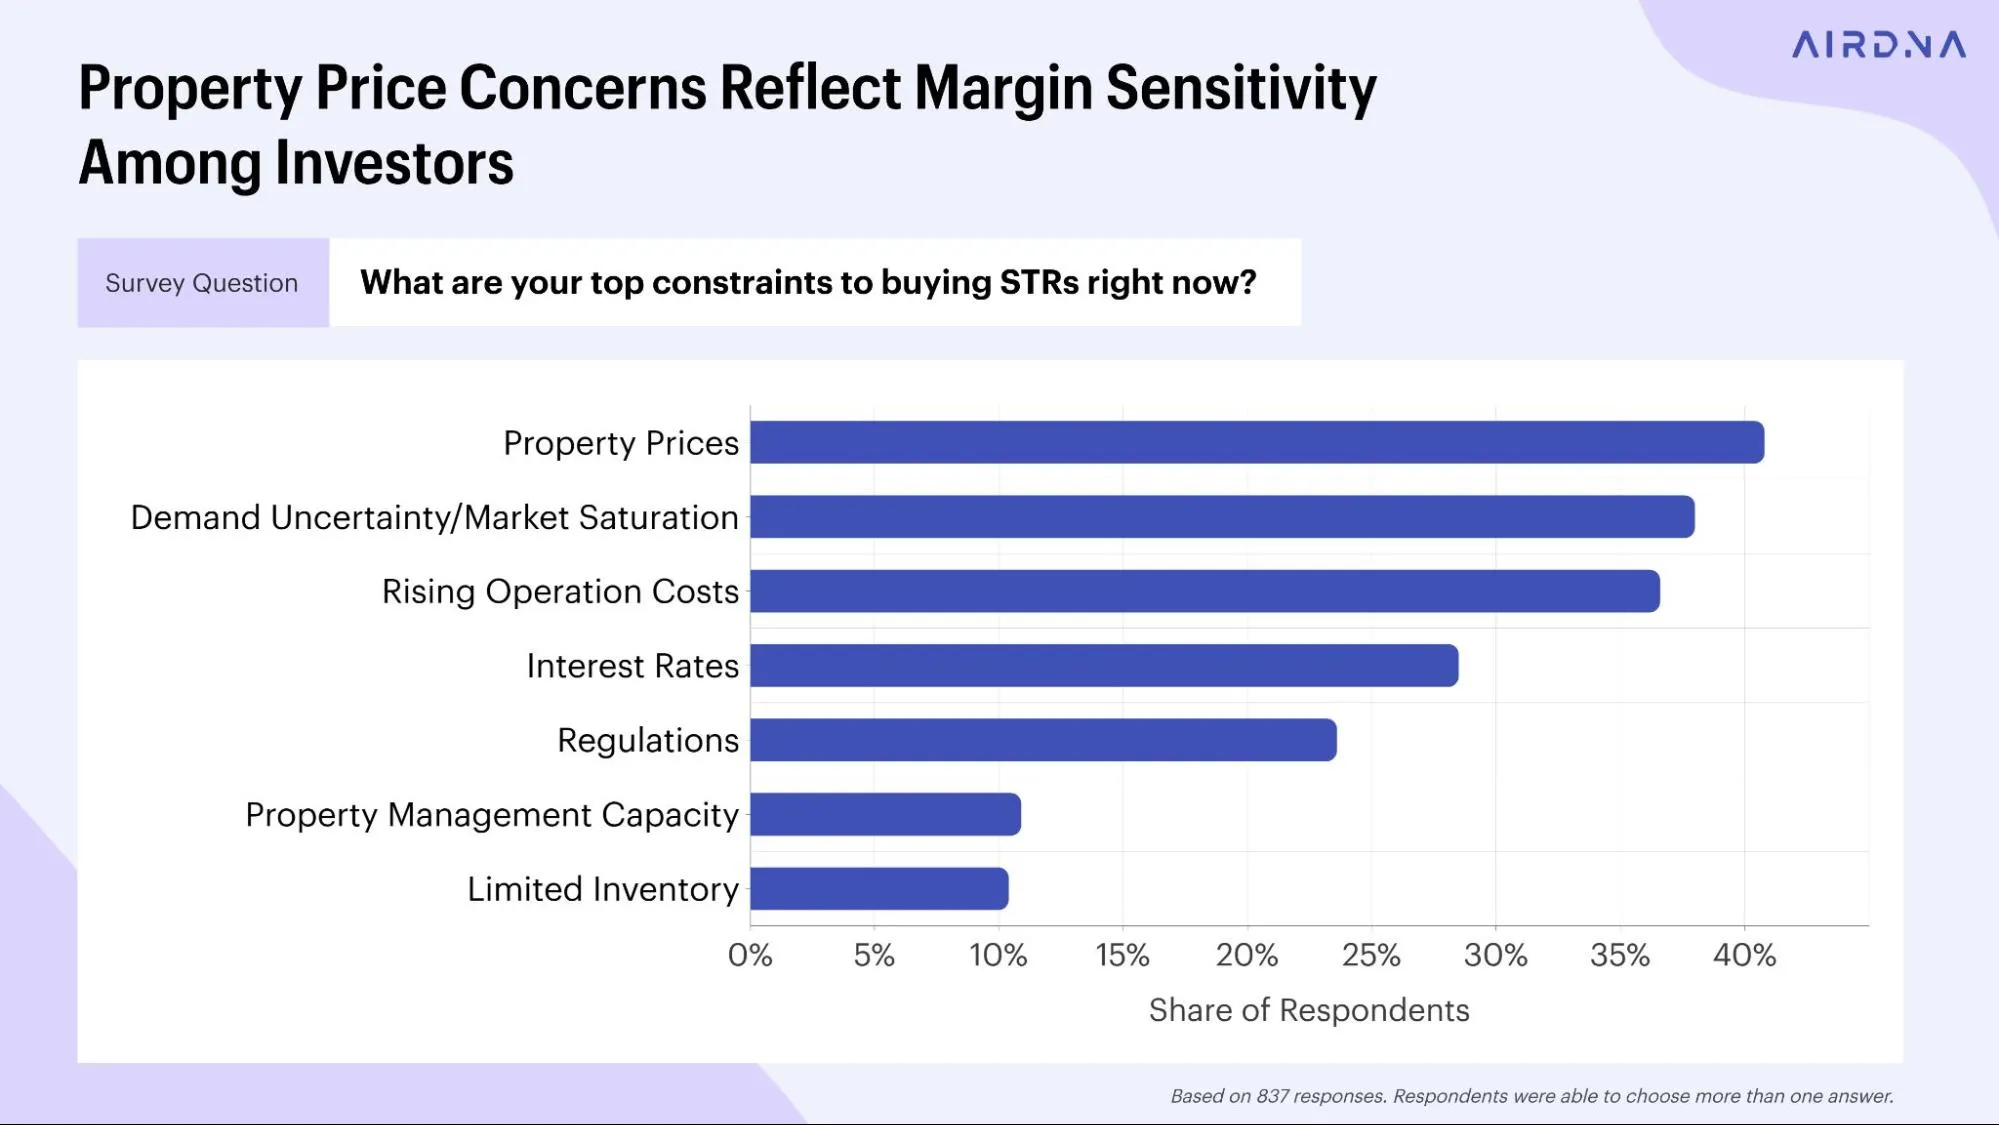
When current short-term rental investors were asked to identify their top constraints to acquiring additional properties, the responses pointed clearly toward margin sensitivity rather than market fear.
The most frequently cited constraints were:
- Property prices
- Demand uncertainty or market saturation
- Rising operating costs
- Interest rates
- Regulatory considerations
Taken together, these concerns reflect a more disciplined underwriting environment. Investors are less focused on headline growth and more focused on whether deals present realistic cash flow and reduce unnecessary risk.
This shift is consistent with a market that has moved beyond opportunistic buying toward more professional capital allocation, where downside protection and return durability matter more than rapid expansion.
Constraints differ meaningfully by investor profile
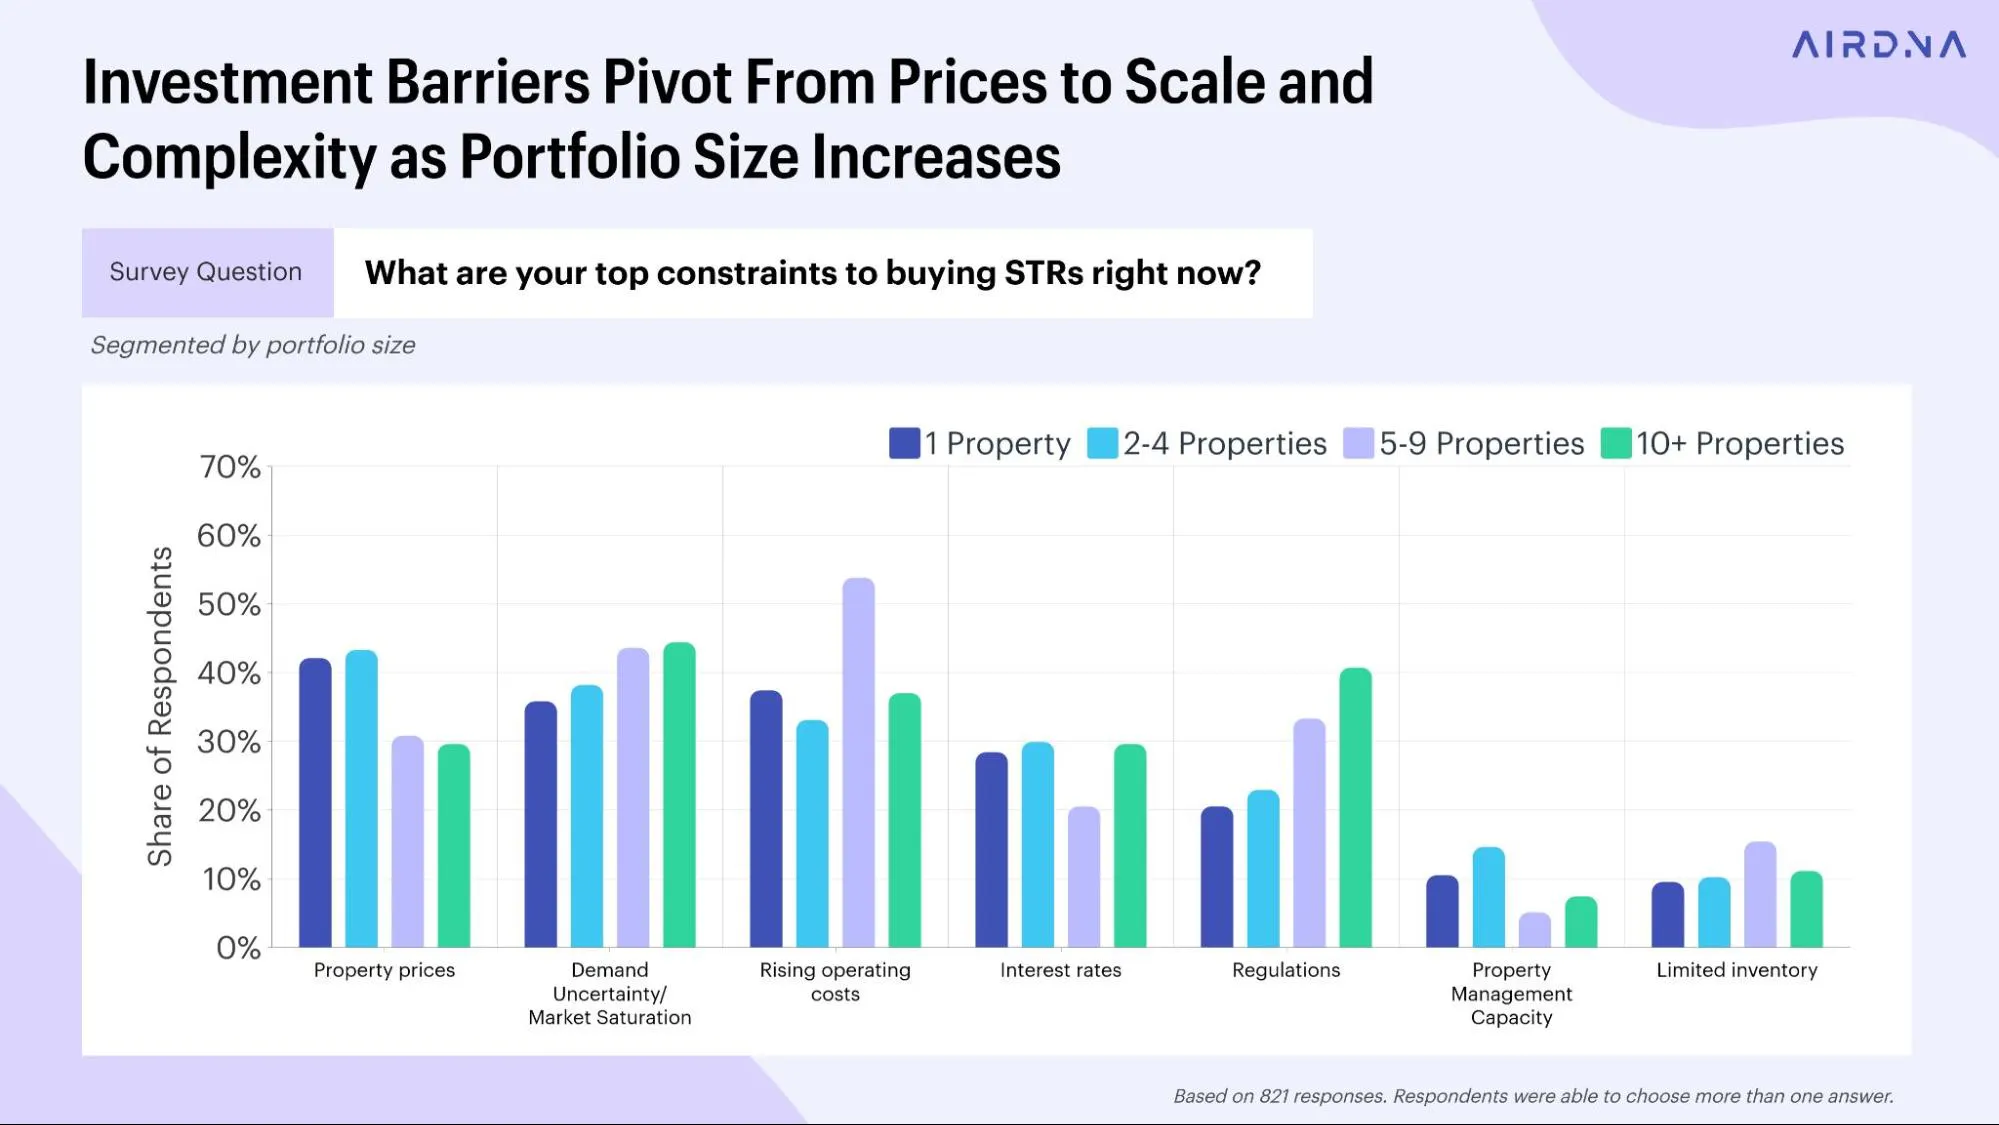
Importantly, these constraints are not uniform across all investors.
Less experienced and smaller-portfolio investors are far more likely to cite property prices as their primary barrier, reinforcing the tension between cash flow expectations and current home prices.
By contrast, investors with larger portfolios or longer operating histories are more focused on:
- Demand uncertainty
- Regulatory risk
- Rising operating costs
This divergence highlights a key dynamic in today’s STR market. Newer investors are struggling to make the math work at current prices, while experienced operators are increasingly managing complexity and scale.
Selling intent remains limited and strategic
Despite these constraints, there is little evidence of broad-based distress. When asked about selling activity, the vast majority of current STR owners report being unlikely to sell any properties in the next 12 months.
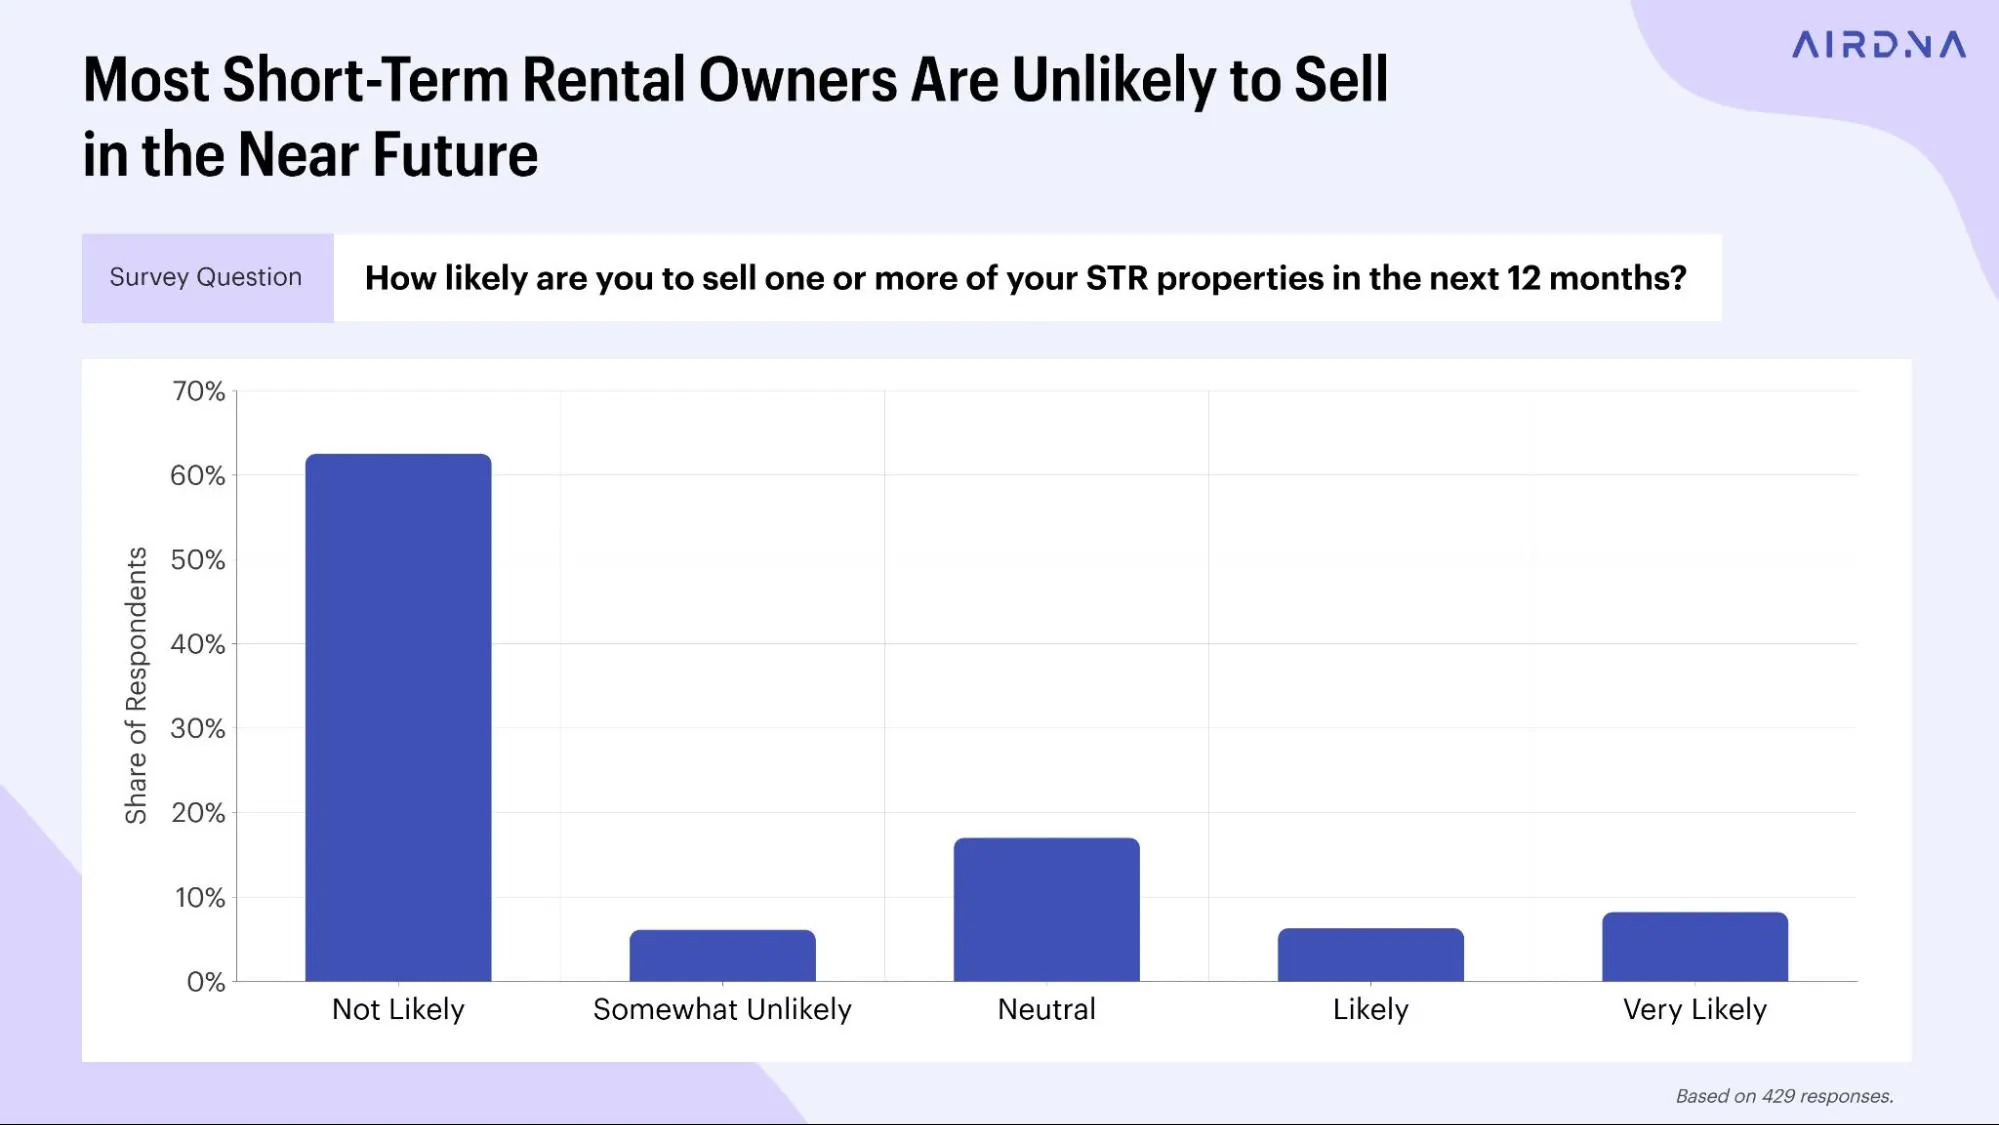
Among those considering a sale, motivations are largely strategic rather than reactive, including capital reallocation, portfolio optimization, or personal reasons.
Only a small subset of respondents cited declining or negative cash flow as a driver of potential sales. Notably, those investors were more likely to cite rising operating costs as their primary constraint than demand weakness.
This suggests that even among sellers, decisions are being made proactively rather than under pressure.
Section 4: Interest Rates and Investor Behavior
Rates matter, but they are not decisive
Interest rates are clearly influencing investor decision-making. When respondents were asked how much current rates are impacting their willingness or ability to invest in short-term rentals, most reported at least a moderate impact. A meaningful share described the effect as strong or extreme.
This confirms what many investors feel day to day. Financing costs are higher, underwriting is tighter, and mistakes are more expensive than they were during the low-rate era.
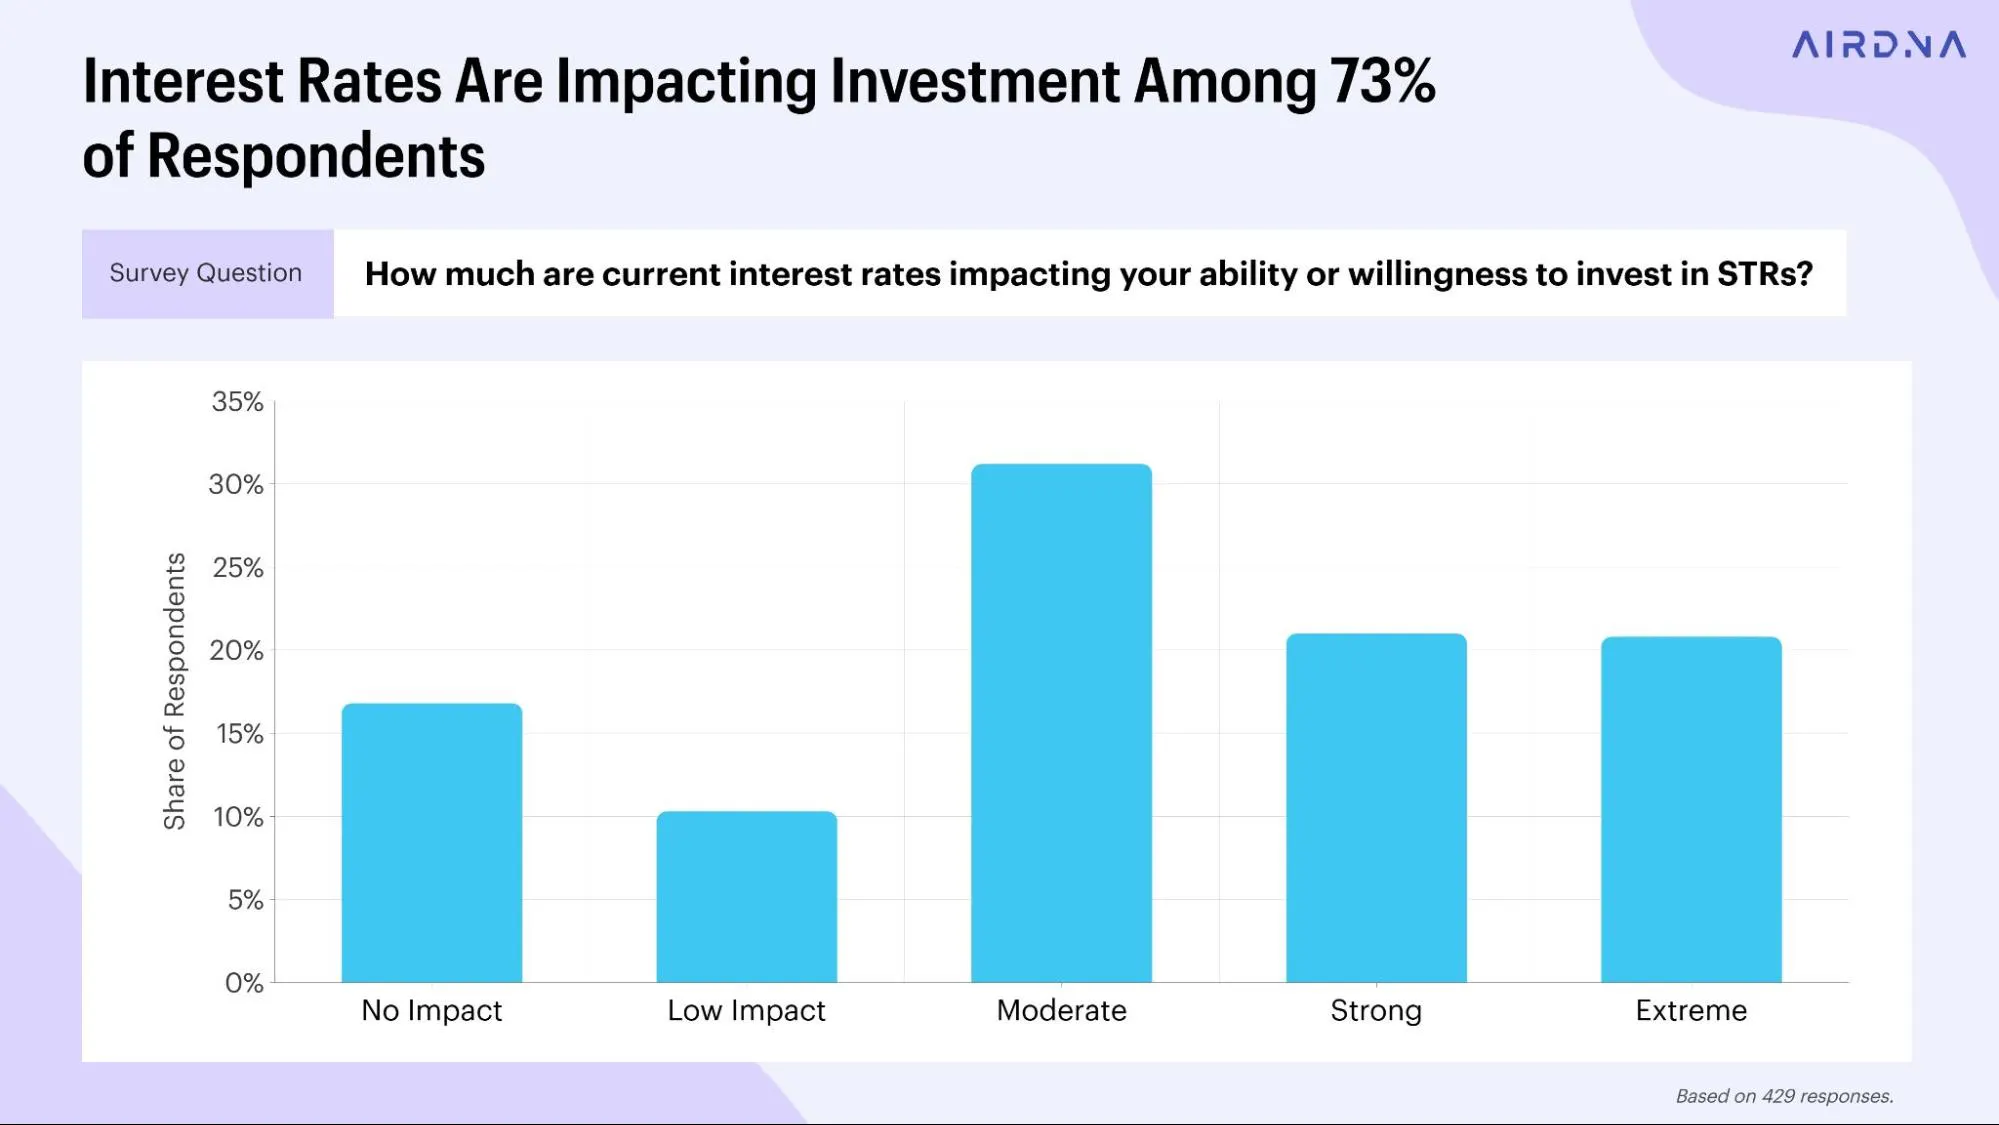
However, this surface level view can be misleading on its own. Perceived impact does not necessarily translate into inactivity.
Rates are filtering behavior, not stopping it
When we cross interest rate impact with actual purchase intent, a more nuanced picture emerges.
Even among respondents who say interest rates have a strong or extreme impact, a meaningful share still plans to purchase a STR property in the next 12 months. Conversely, some investors who report only a modest rate impact remain unlikely to buy.
The implication is important. Rates are not acting as an on off switch. They are acting as a filter.
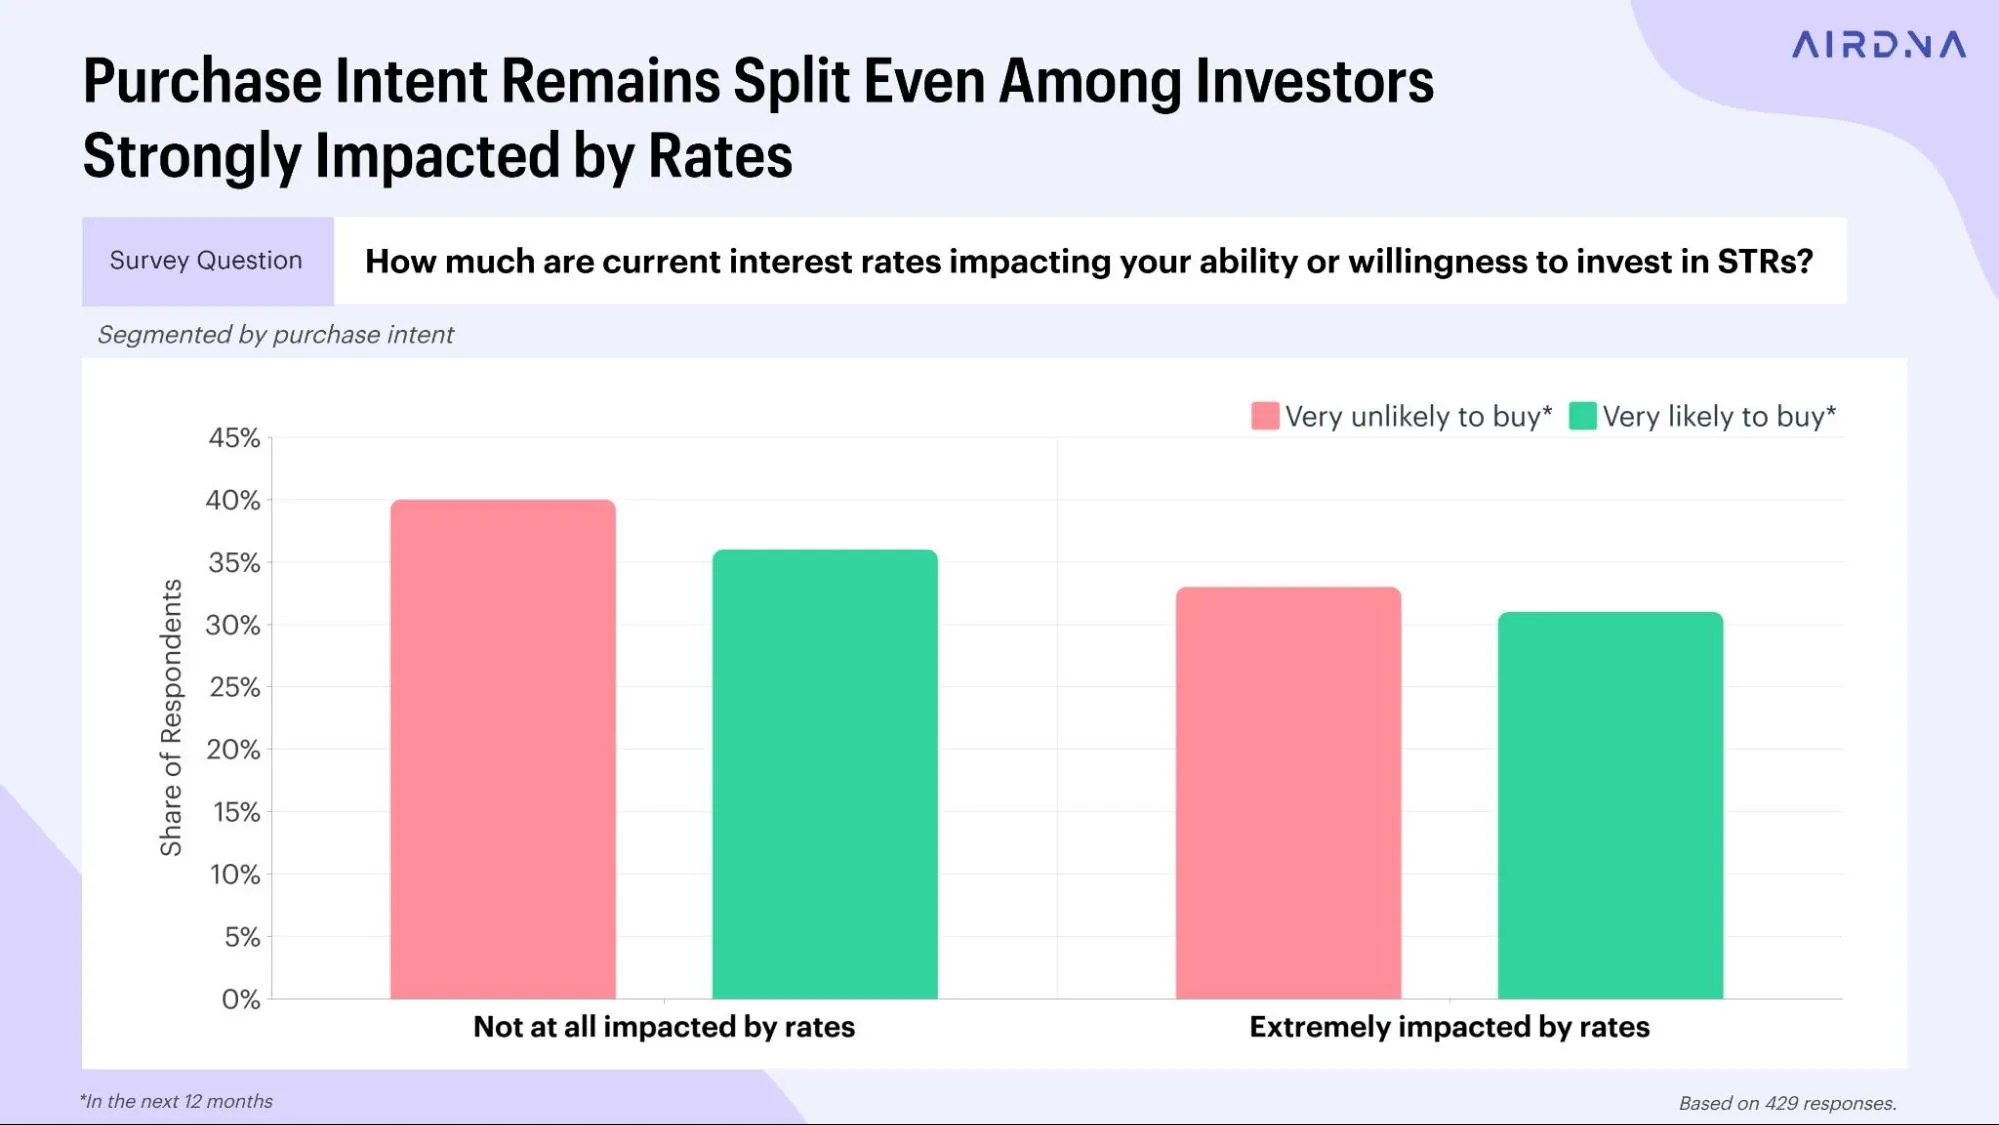
Investors who continue to transact are doing so with tighter assumptions, more selectivity, and a greater focus on downside protection. Those who pause are often reacting to the same conditions, but interpreting them differently.
The macro backdrop is shifting, not static
Context matters. Mortgage rates have already moved meaningfully off their recent highs, and expectations for further easing into 2026 are widespread. While rates remain elevated compared to the ultra-low period of 2020 to 2021, the direction is shifting from uncertainty to normalization.
What buyers believe versus what sidelines investors
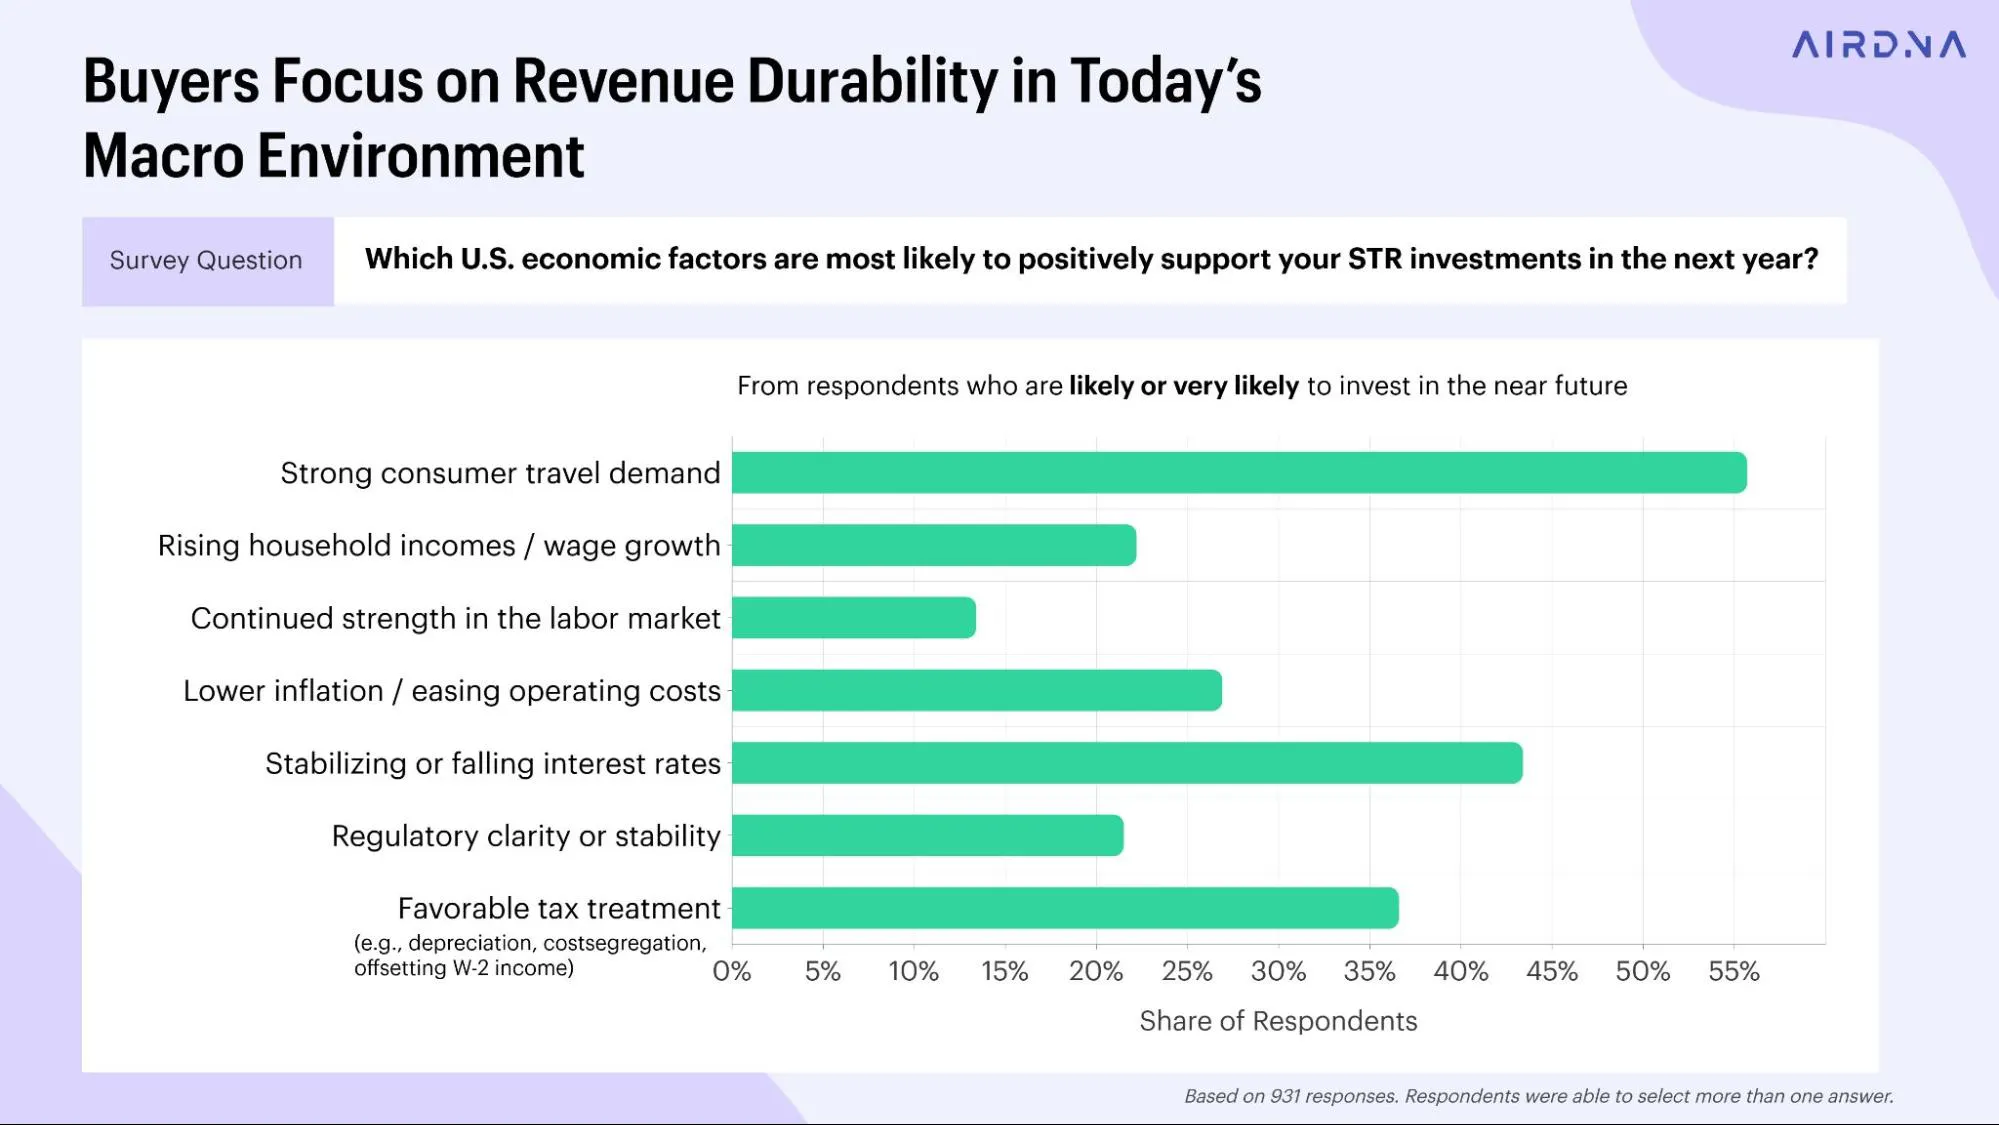
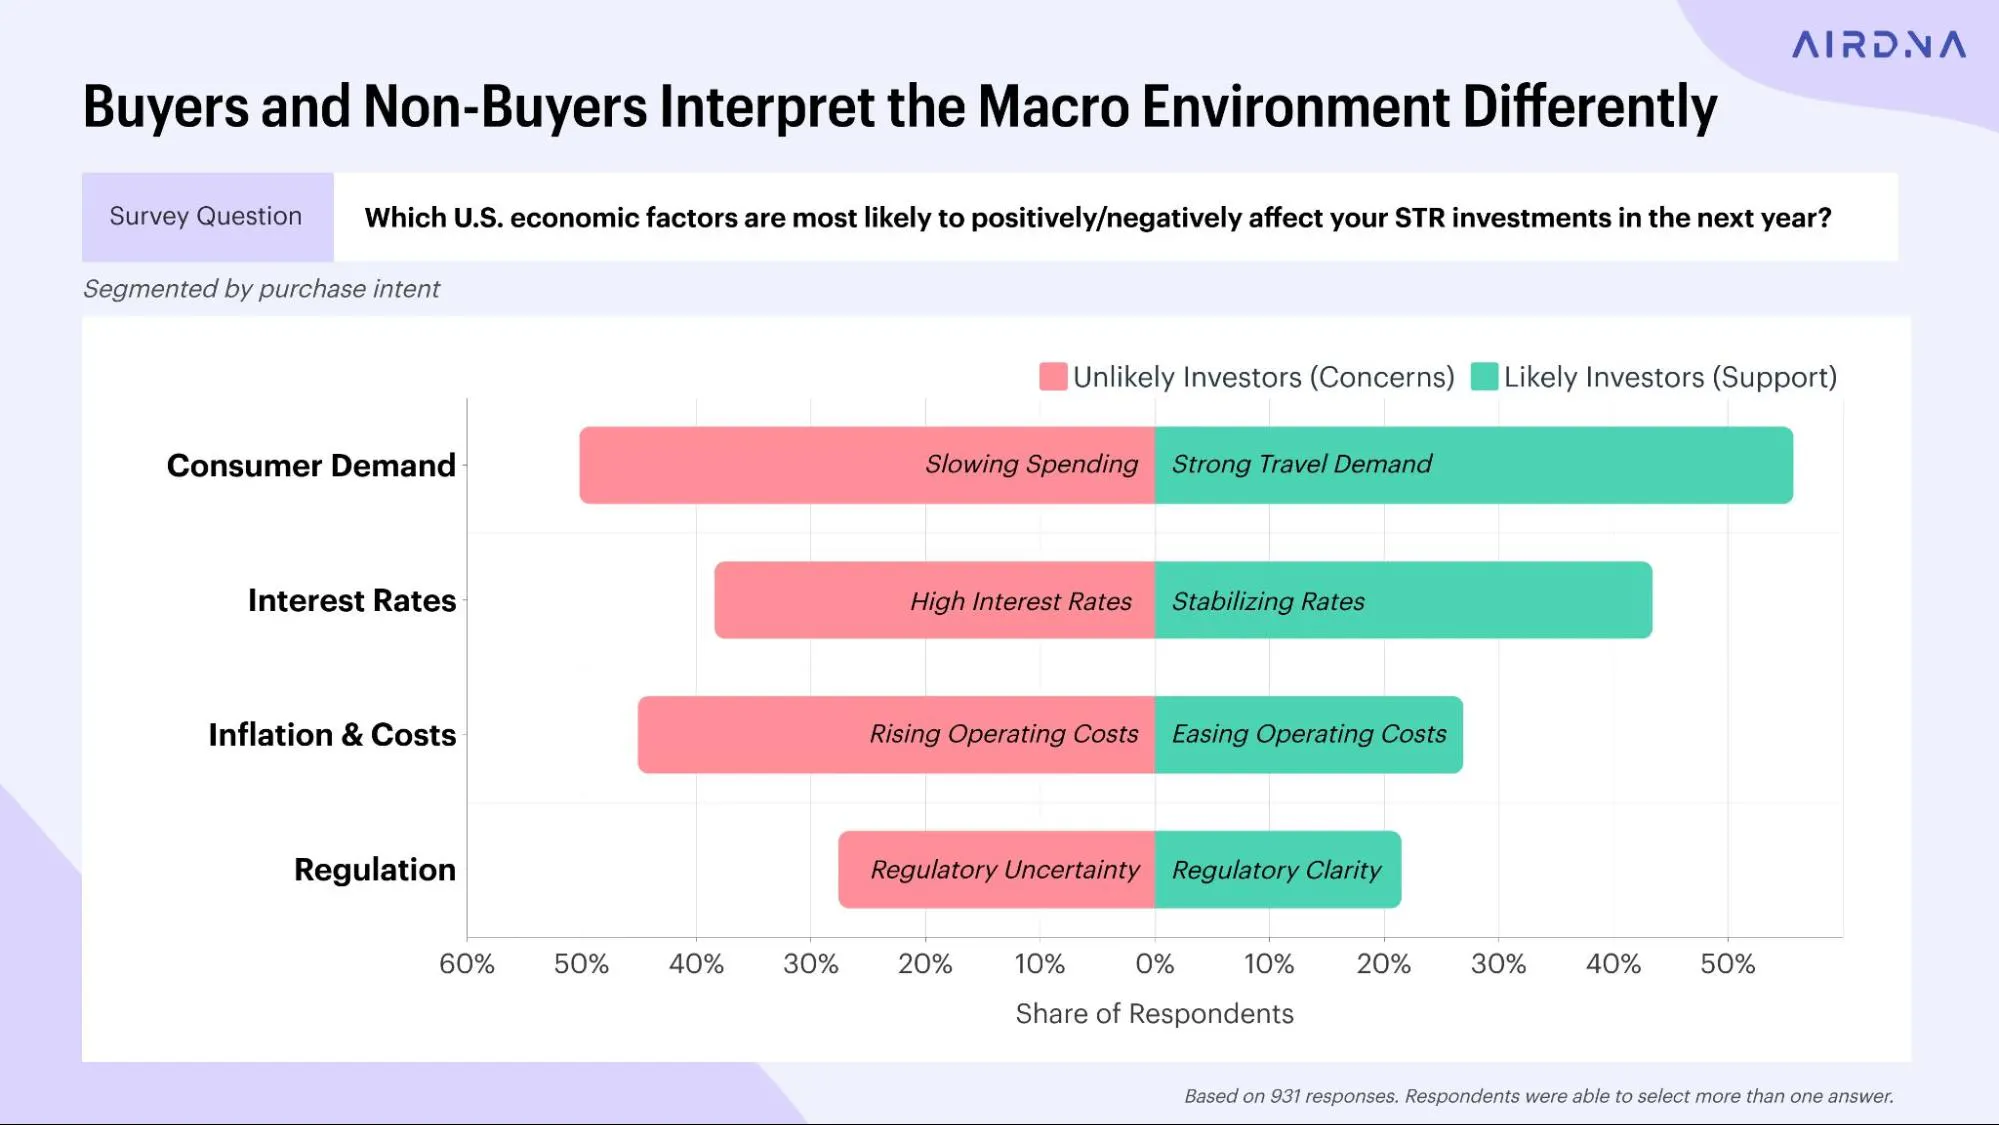
The most revealing contrast appears when comparing how buyers and non-buyers interpret the same macro environment.
Among respondents who are likely or very likely to invest in the next 12 months, the most cited positive economic factors are:
- Strong consumer travel demand
- Stabilizing or falling interest rates
- Favorable tax treatment
- Regulatory clarity
- Easing operating costs
These investors anchor their outlook in revenue durability first, with cautious optimism around costs and capital.
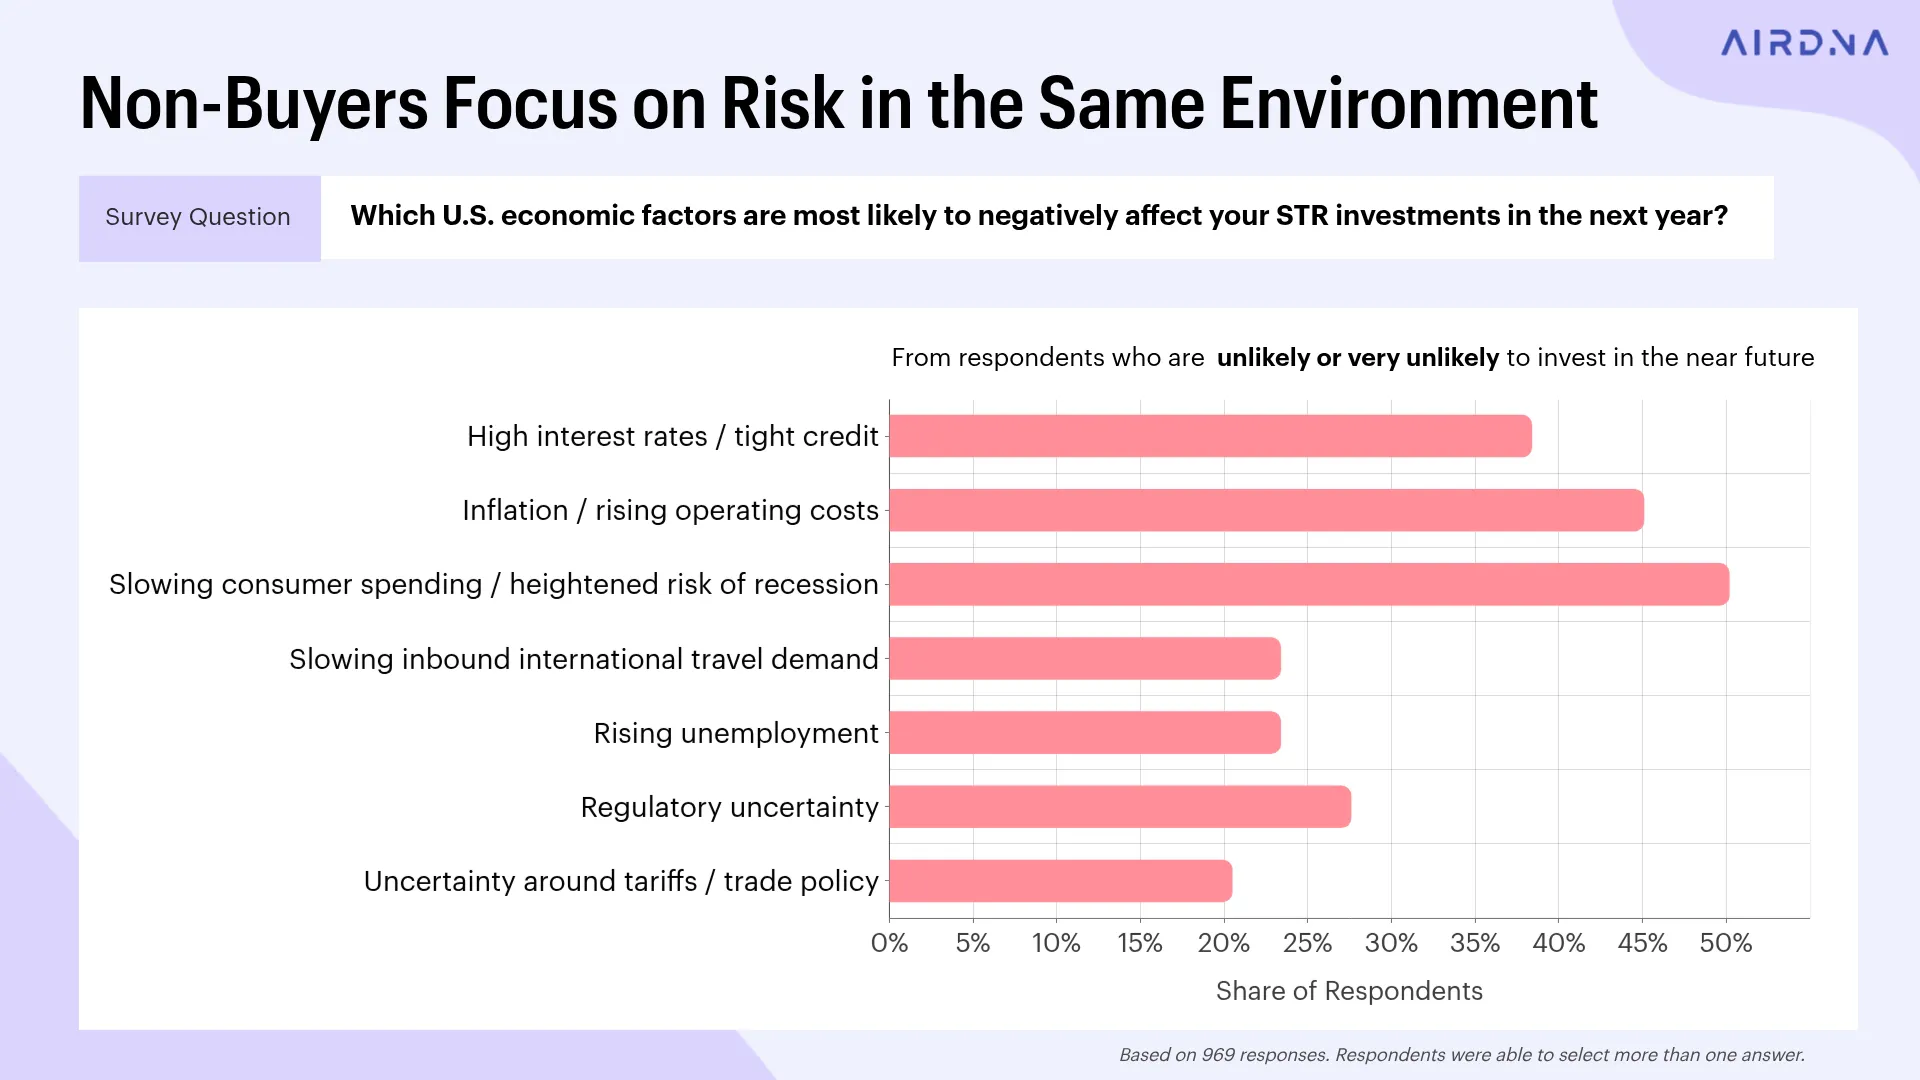
Among respondents unlikely to invest in the next year, dominant concerns include:
- Slowing consumer spending or recession risk
- Inflation and rising operating costs
- High interest rates or tight credit
- Regulatory uncertainty
Both groups are reacting to the same signals. The difference lies in interpretation and confidence in execution.
Find a prospective Airbnb for sale
Discover your next profitable short-term rental with real market revenue projections.
Section 5: From Consumer Investing to Professional Operations
As short-term rental portfolios grow, the way investors approach the business changes in fundamental ways. What often begins as an individual-level real estate purchase gradually evolves into a more professional operating model, shaped by scale, complexity, and capital efficiency.
Early-stage STR investors tend to rely on familiar tools and frameworks. Financing decisions often mirror primary or second-home purchases, underwriting is anchored in affordability and headline returns, and simplicity is prioritized over flexibility. This approach reflects the realities of owning one or two properties, where operational and financial complexity remains manageable.
As portfolios expand, that mindset shifts.
Financing behavior signals professionalization
The clearest evidence of this transition appears in how investors finance new acquisitions as they scale.
For first-time and small-scale investors, conventional 30-year fixed mortgages remain the dominant financing method. These loans are widely accessible, easy to understand, and well suited to individual-level ownership. Cash purchases also play a meaningful role at this stage, often reflecting personal balance sheet decisions rather than portfolio strategy.
As portfolios grow, reliance on conventional mortgages declines sharply. Among investors with ten or more properties, fewer than one in five report using traditional 30-year loans for their most recent acquisition. Instead, financing strategies diversify to include DSCR loans, adjustable-rate mortgages, portfolio loans, private financing, and hard money.
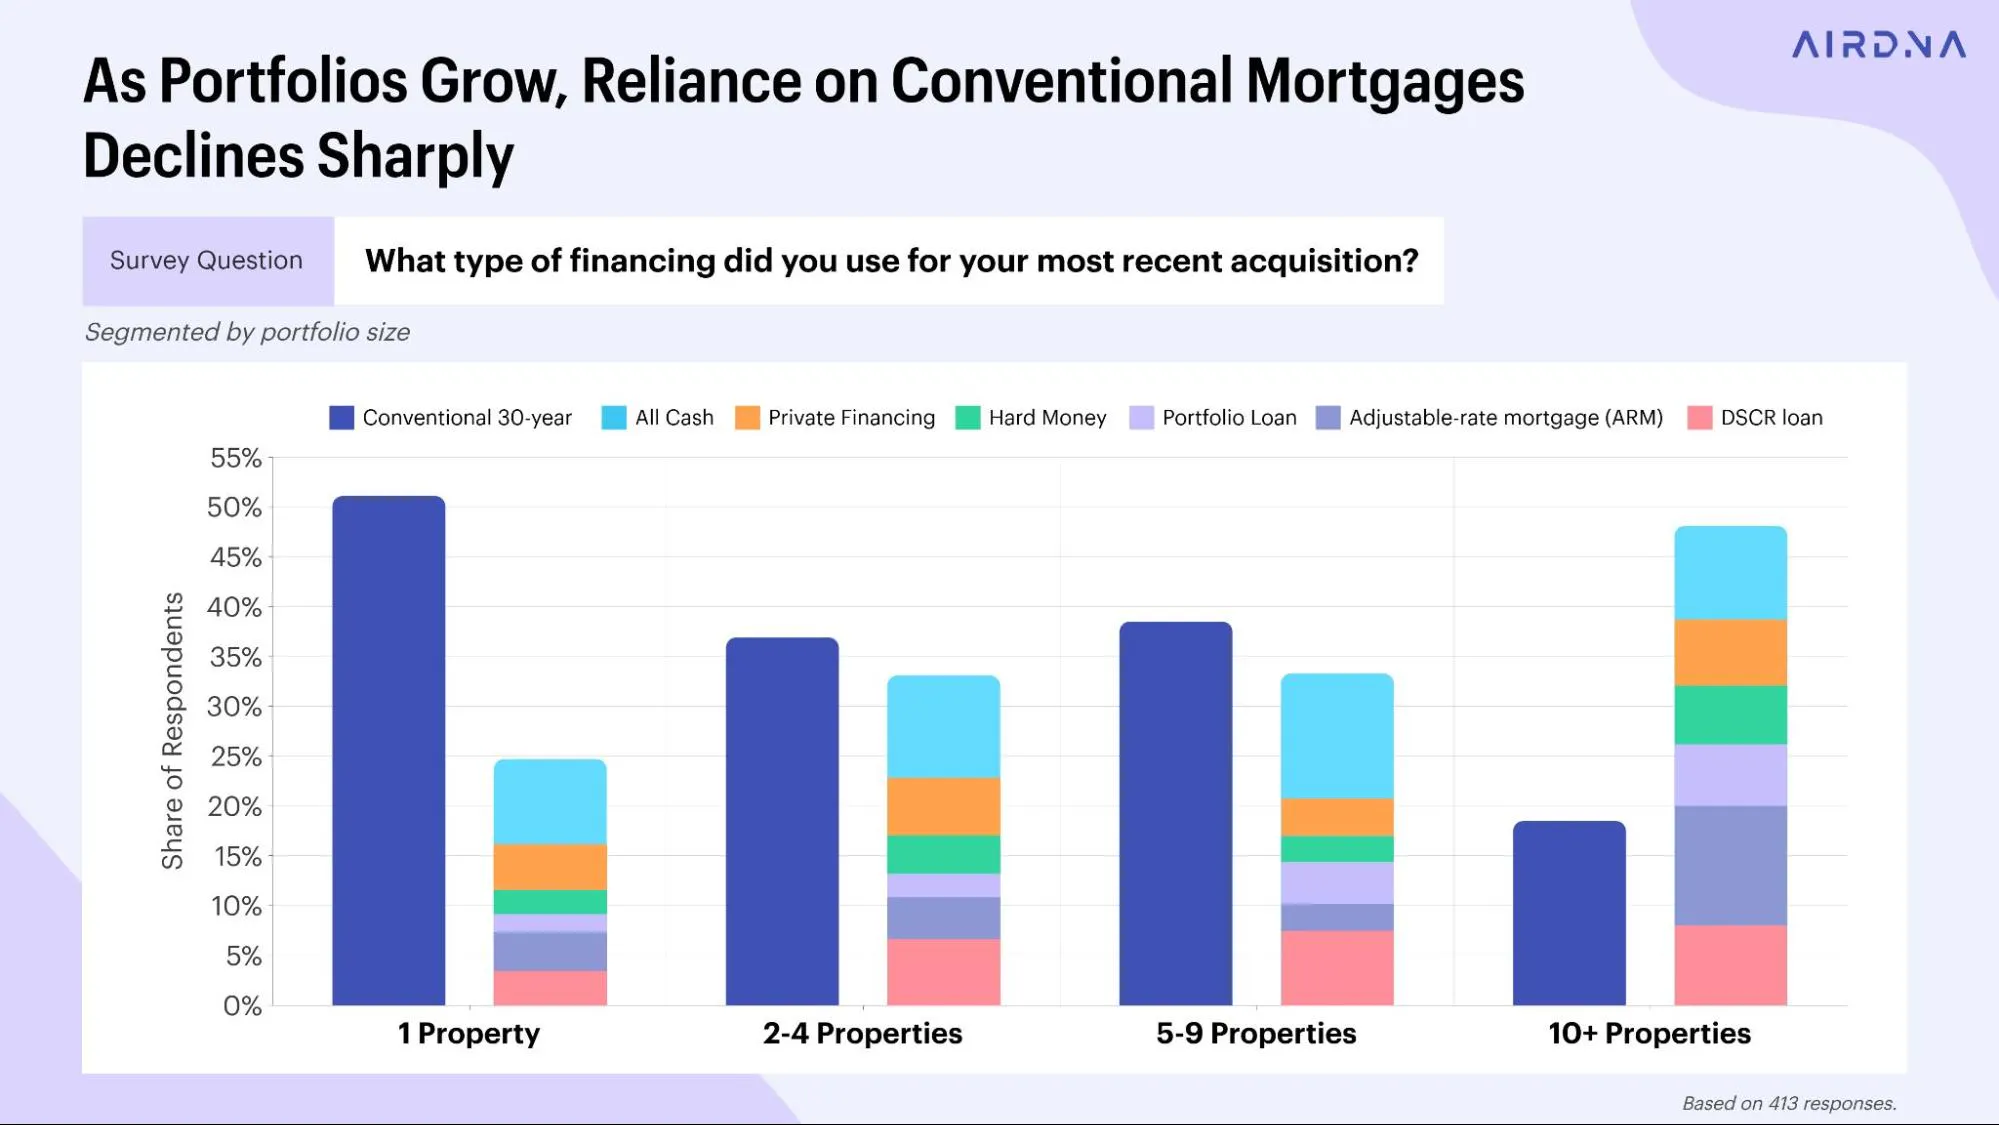
Larger operators optimize for flexibility, speed, and scalability rather than lowest-cost financing alone. Capital structure becomes a strategic tool, allowing investors to manage growth, liquidity, and risk across multiple assets.
Section 6: Market Selection and the Investor Journey
Where investors choose to deploy capital changes meaningfully as they gain experience. While headline market preferences provide a useful snapshot of demand, they conceal a more important story about how STR investors learn, adapt, and specialize over time.
Where investors say they are buying next
Across all current STR investors, future acquisition interest concentrates in a relatively small set of market types.
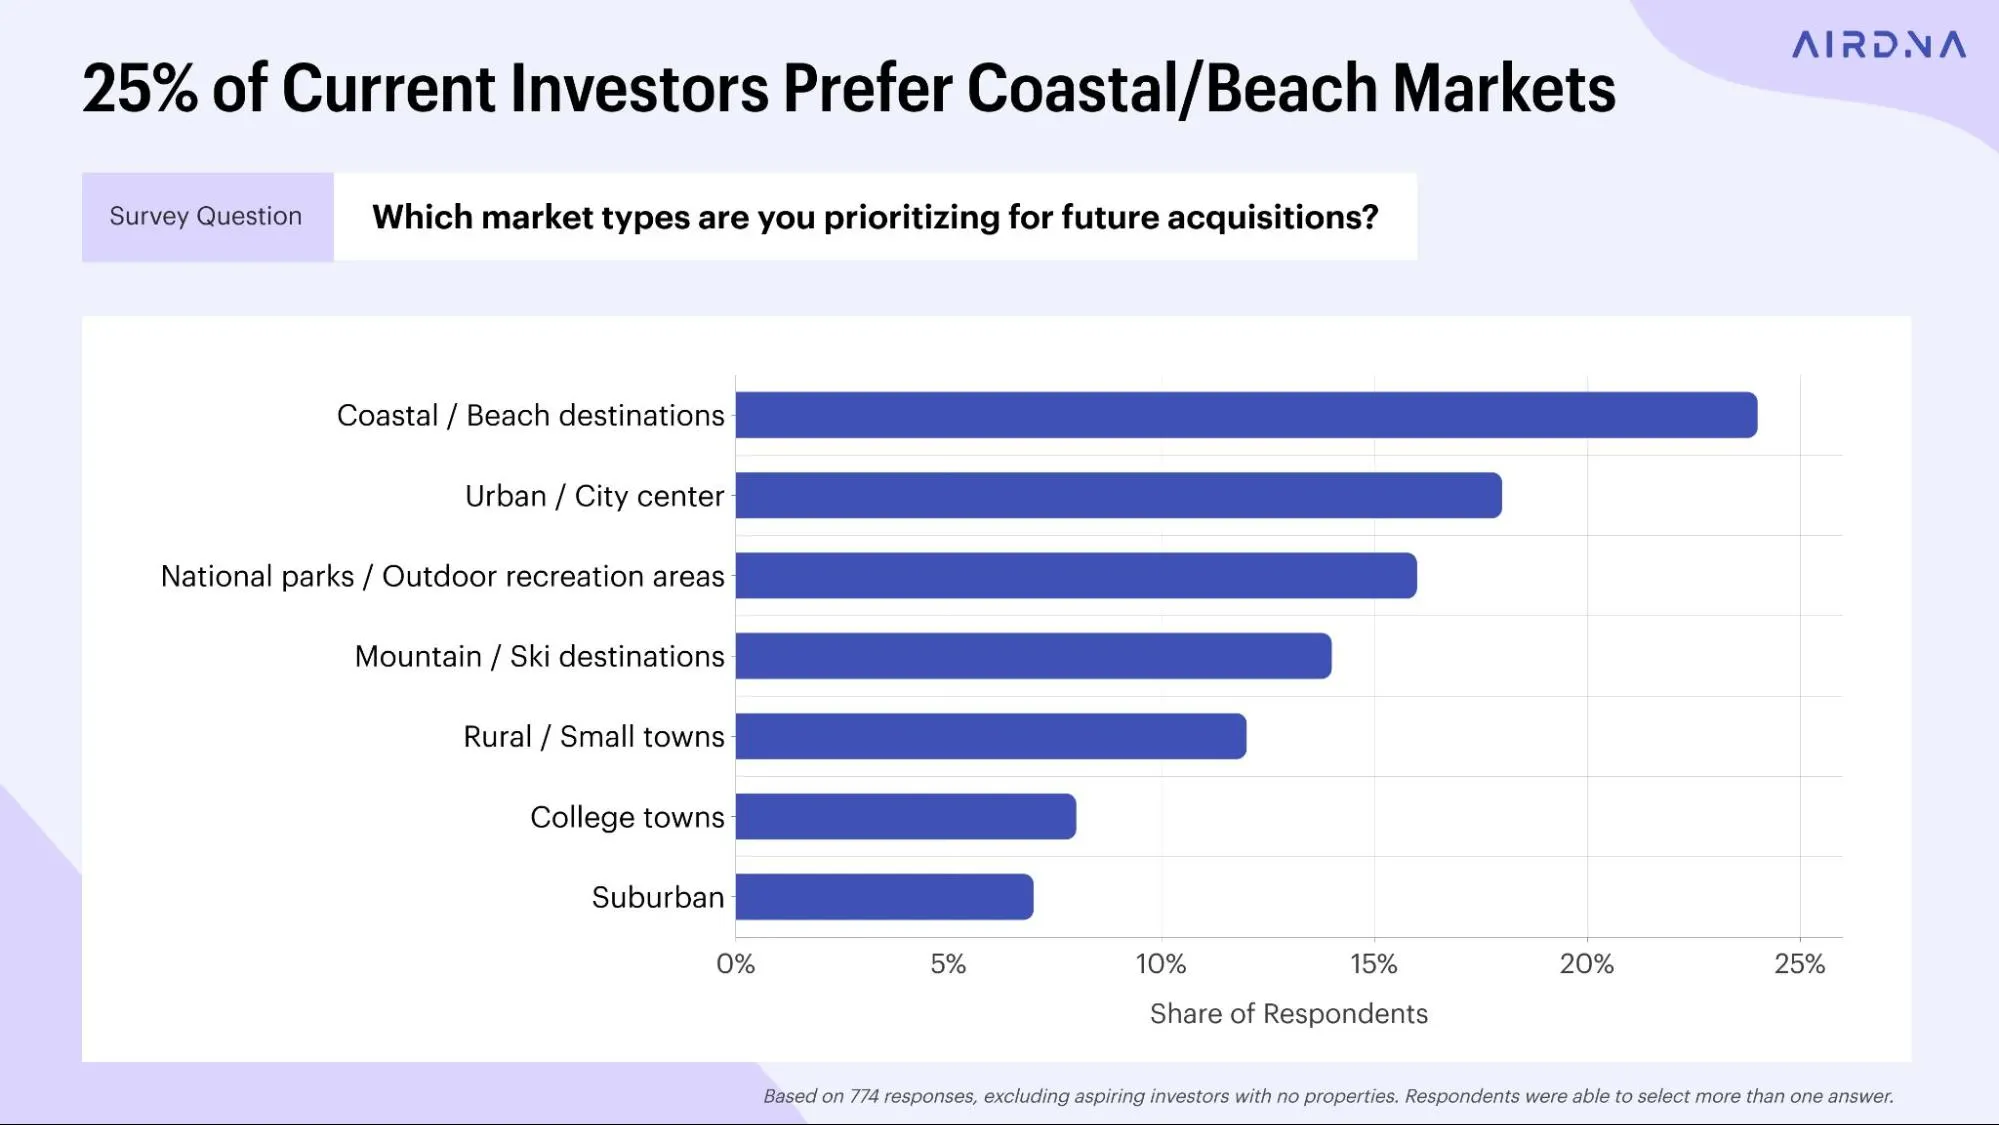
Coastal/beach destinations rank as the most frequently targeted markets, followed by urban and city center locations. Outdoor-oriented destinations, including national park adjacent and mountain or ski markets, also attract meaningful interest. Suburban and college town markets trail considerably behind.
At an aggregate level, this mix suggests continued focus on high-demand, travel-driven destinations with established STR track records. However, this topline view masks an important shift that occurs as investors gain experience.
Market preferences evolve with experience
When market selection is segmented by years of STR investing experience, a clear progression emerges.
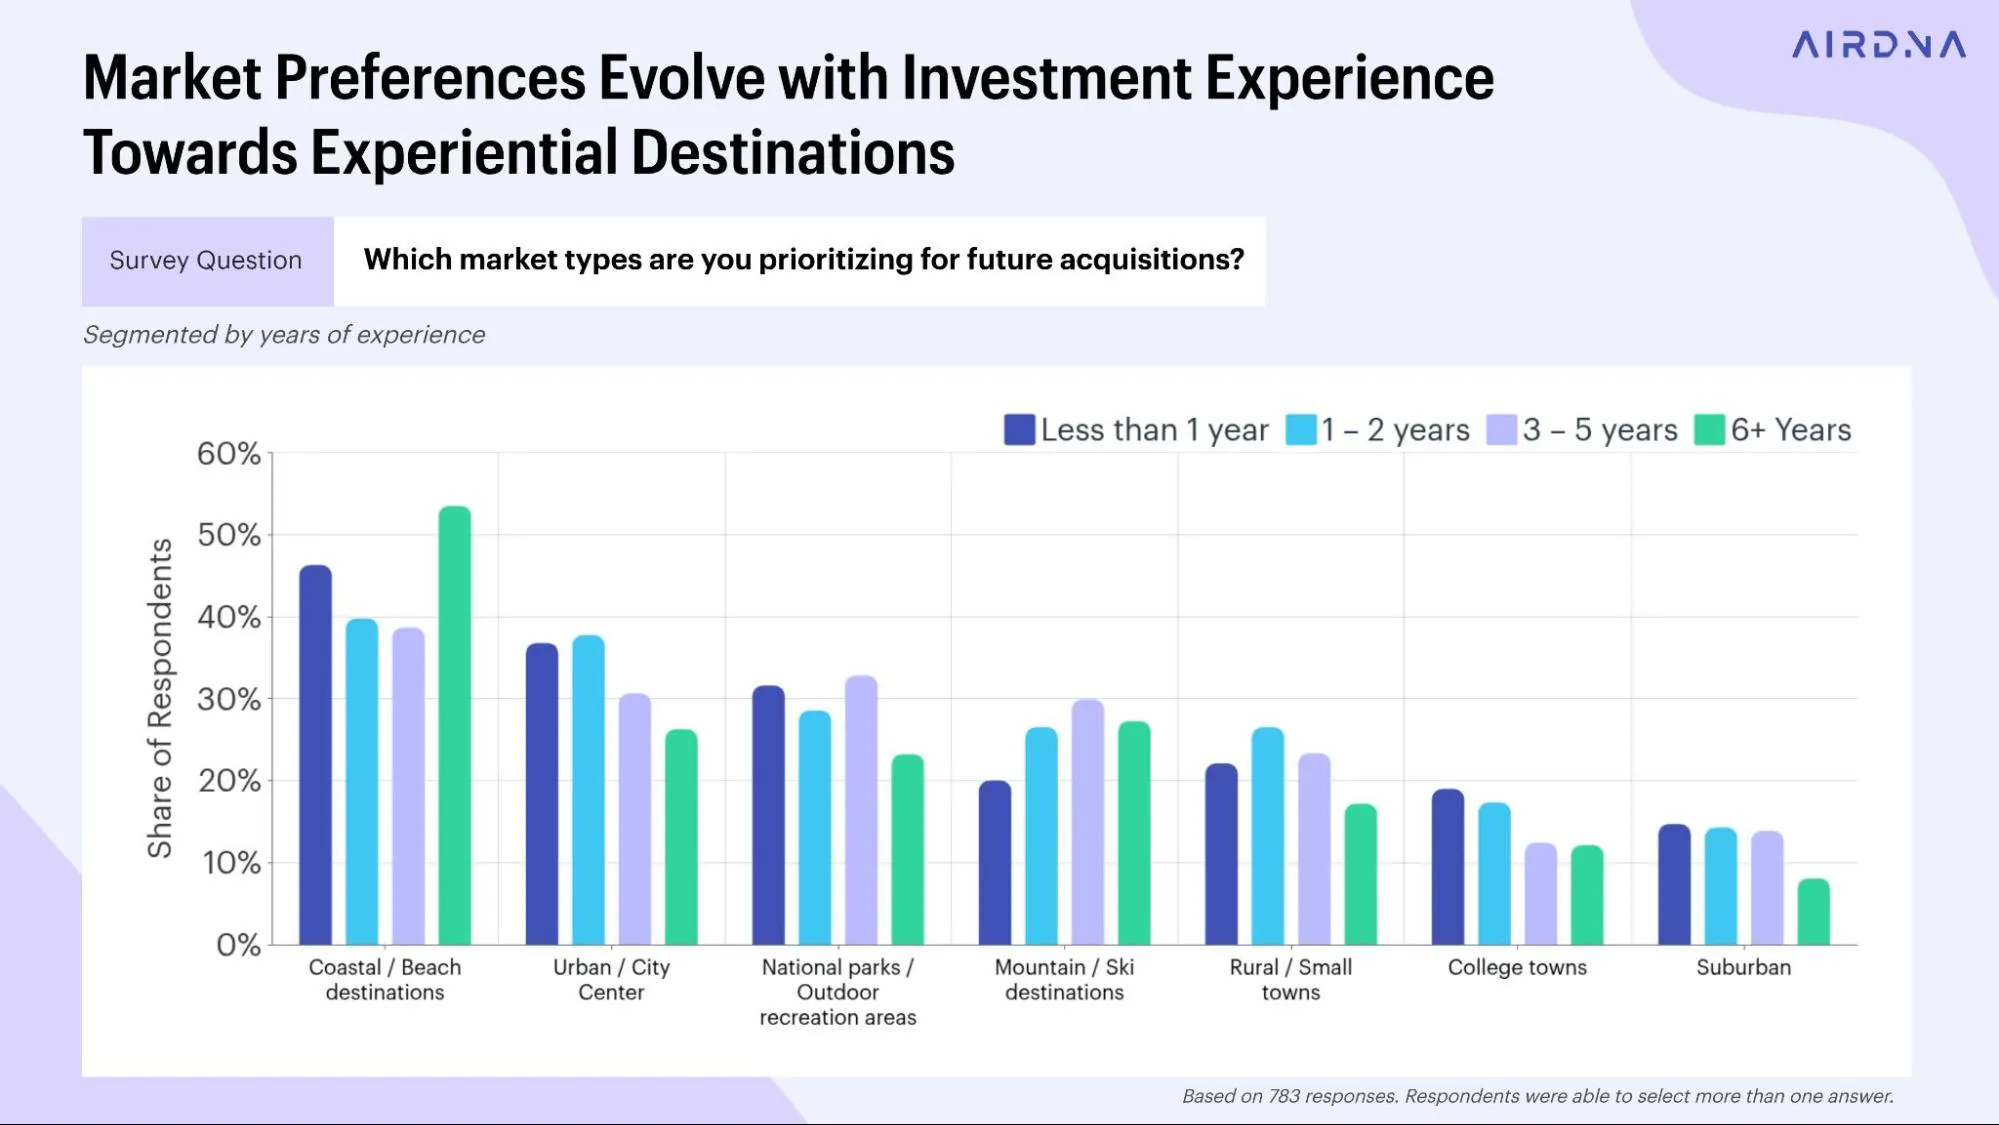
Early-stage investors tend to gravitate toward familiarity. Urban and city-center markets attract outsized interest among newer entrants, likely reflecting perceived liquidity, year-round demand, and easier underwriting assumptions. Coastal markets also rank highly, benefiting from strong brand recognition and clear vacation demand.
As investors gain experience, preferences begin to shift. Mid-tenure investors show increasing interest in outdoor and experiential destinations, including mountain, ski, and national park-adjacent markets. These investors appear more willing to underwrite seasonality, operational complexity, and market nuance in exchange for differentiated demand and reduced competition.
Among the most experienced investors, the pattern becomes more pronounced. Coastal and mountain destinations dominate acquisition interest, while enthusiasm for suburban, college town, and generic urban markets declines. These investors are seeking durable demand drivers, pricing power, and defensible market positioning.
From familiarity to specialization
This evolution reflects a broader learning curve within STR investing.
New investors often start where assumptions feel safest. As confidence and operational capability grow, investors expand their aperture, test new markets, and ultimately concentrate capital where they believe long-term advantages exist.
This progression helps explain several broader market dynamics. It clarifies why destination markets continue to attract repeat capital even as supply growth slows. It also explains why some of the most competitive urban and suburban markets face pressure as experienced operators redirect investment toward differentiated destinations.
Section 7: Prospective Investors and Future Entry
While much of today’s STR activity is being driven by experienced operators, interest from new entrants has not disappeared. Instead, it has become more deliberate, more measured, and more constrained by realism around pricing, financing, and execution.
Interest remains high among non-owners
Among respondents who do not currently own a short-term rental, the vast majority report having actively considered an STR investment in the past 12 months. This indicates that curiosity and intent remain strong, even as fewer first-time investors are rushing into the market.
This distinction matters. It’s a reassessment of timing, affordability, and readiness that drives the slowdown in entry, not a lack of interest.
Cash flow is the primary motivation, not speculation
When prospective investors are forced to select a single primary motivation for entering the STR market, the results are unambiguous.
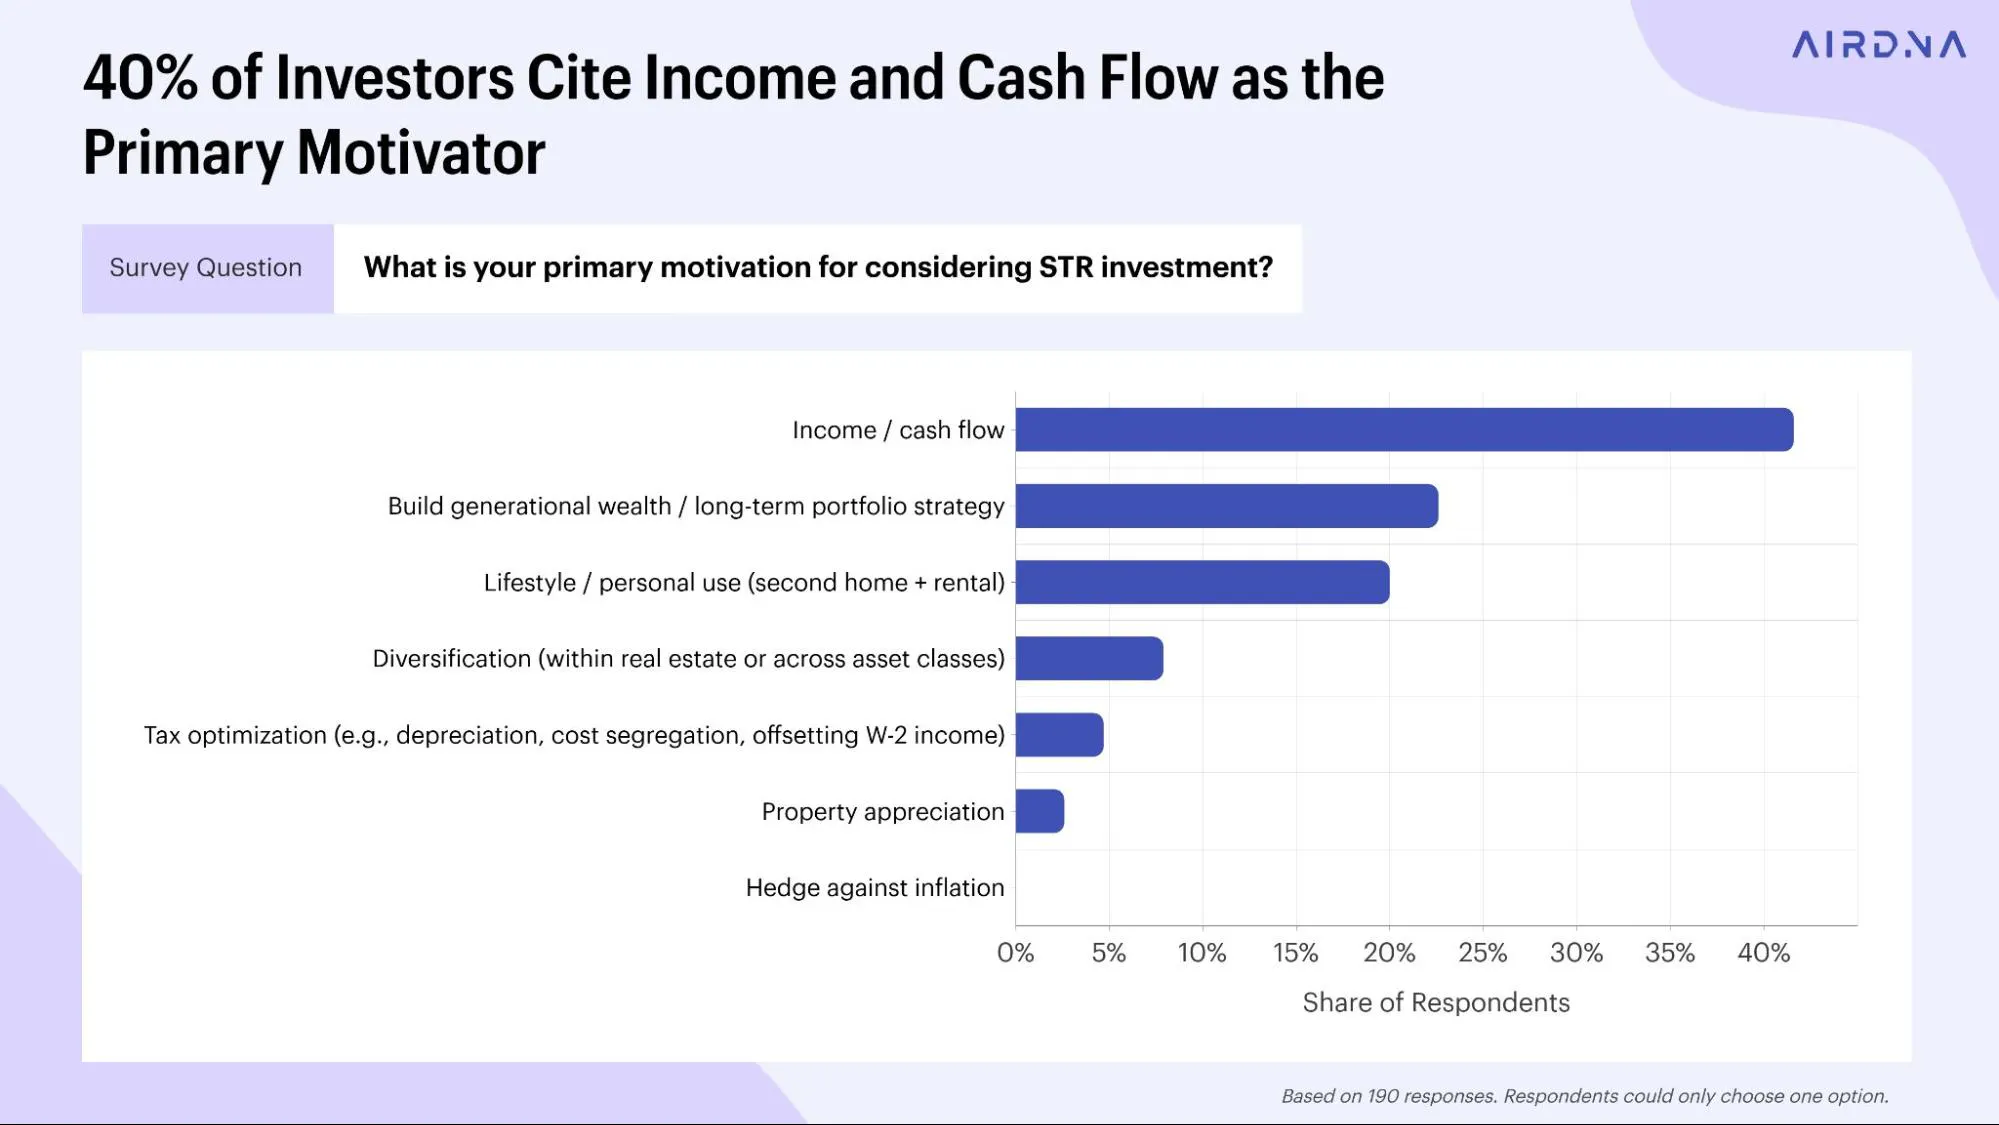
Income and cash flow dominate as the top motivation, followed by long-term wealth building and lifestyle or personal use. Property appreciation alone ranks near the bottom.
Prospective investors are not pursuing short-term rental investing to speculate on asset prices. They are evaluating STRs as income-producing businesses, with cash flow expectations at the forefront.
Barriers to entry are economic, not ideological
Despite strong interest, several factors are keeping prospective investors on the sidelines.
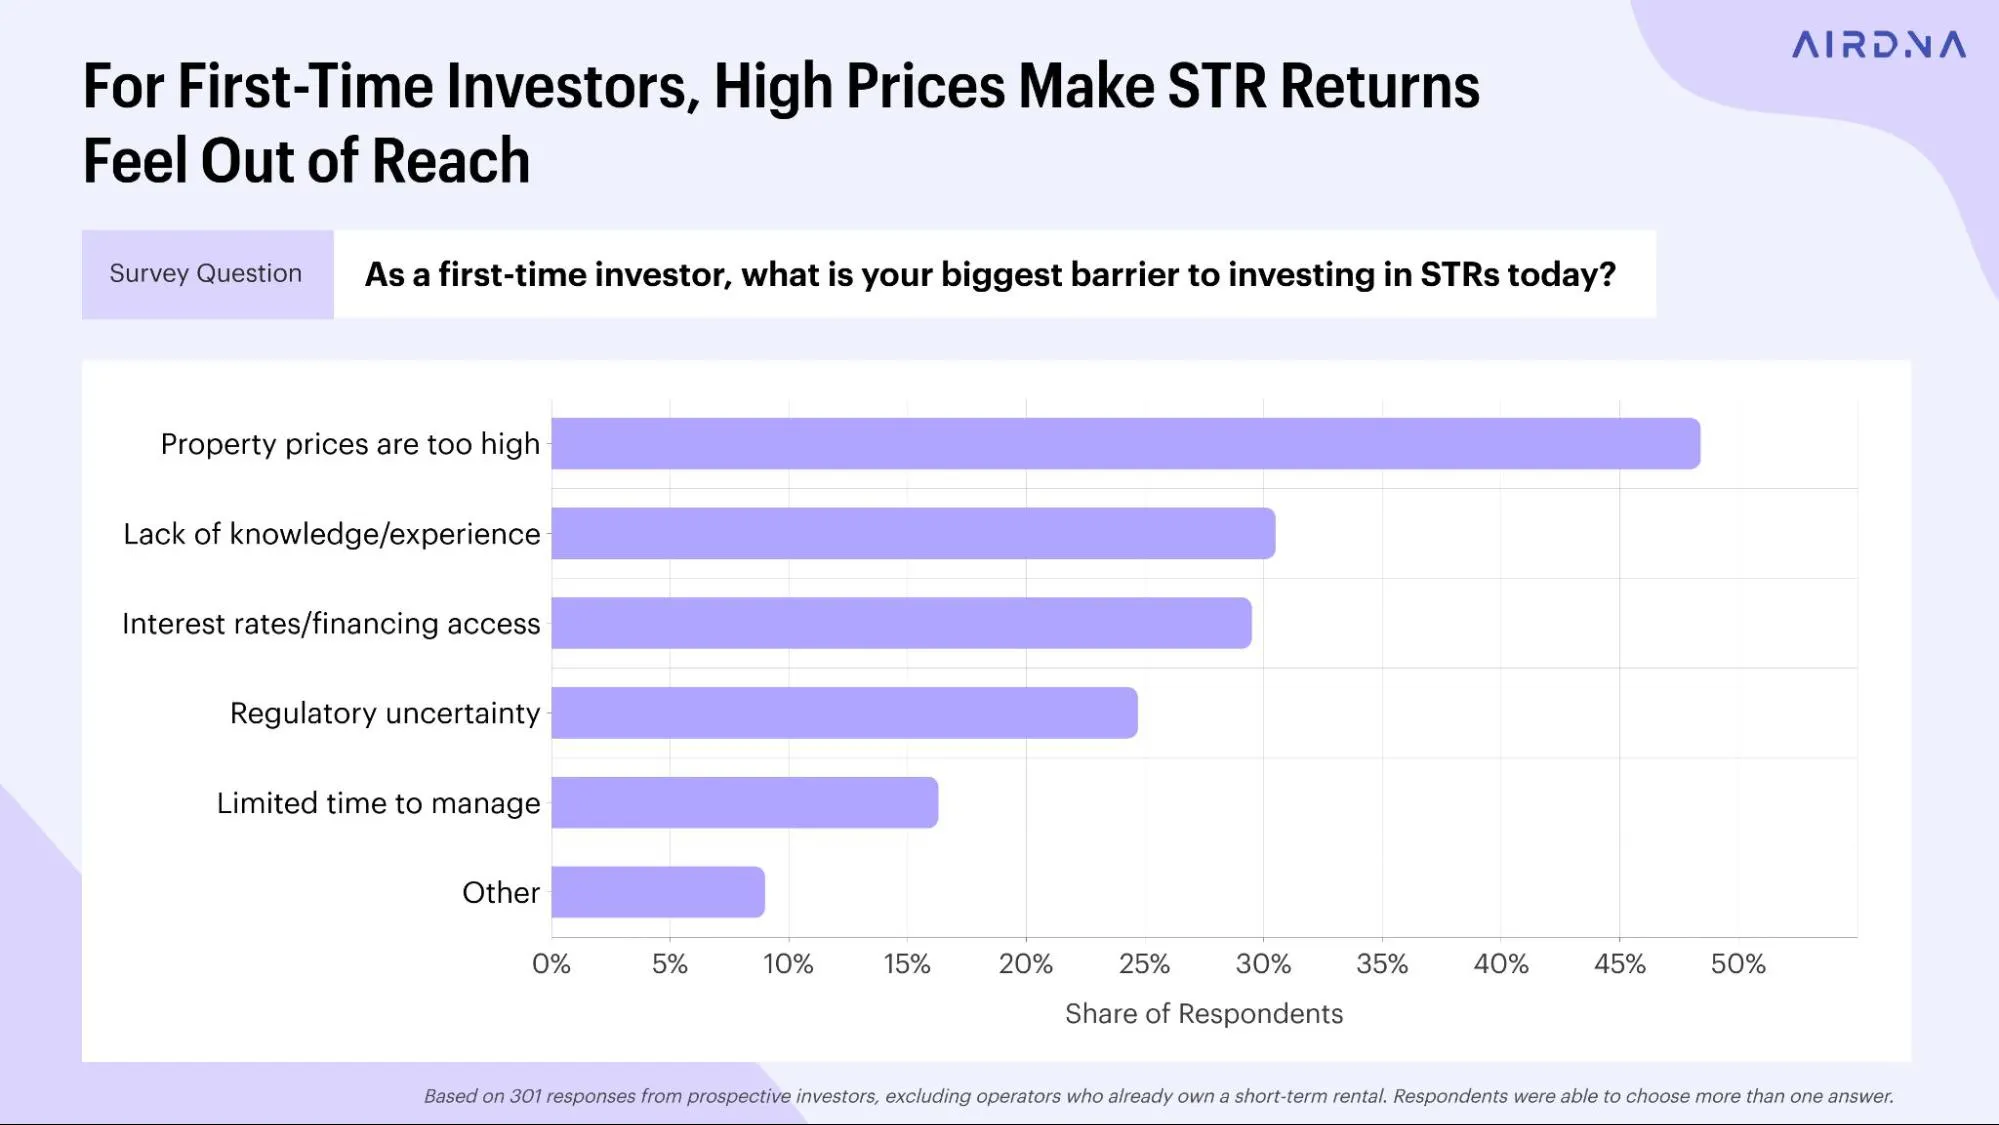
Property prices are the most frequently cited barrier, followed by interest rates and access to financing, regulatory uncertainty, and a lack of experience or time to manage. These concerns closely mirror those of existing investors, but without the benefit of operational context. For first-time buyers, high prices and financing constraints often feel absolute rather than manageable.
This contrast reinforces a core theme of the report: the gap between intent and action is driven less by a lack of interest in short-term rentals and more by uncertainty about achieving reliable, cash-flowing returns in a high-price, high-rate environment without prior experience.
Entry timing and capital expectations point to gradual growth
Most prospective investors expect to buy within one to three years, with a smaller but meaningful share targeting the next 6 to 12 months. Very few are planning entry beyond that horizon.
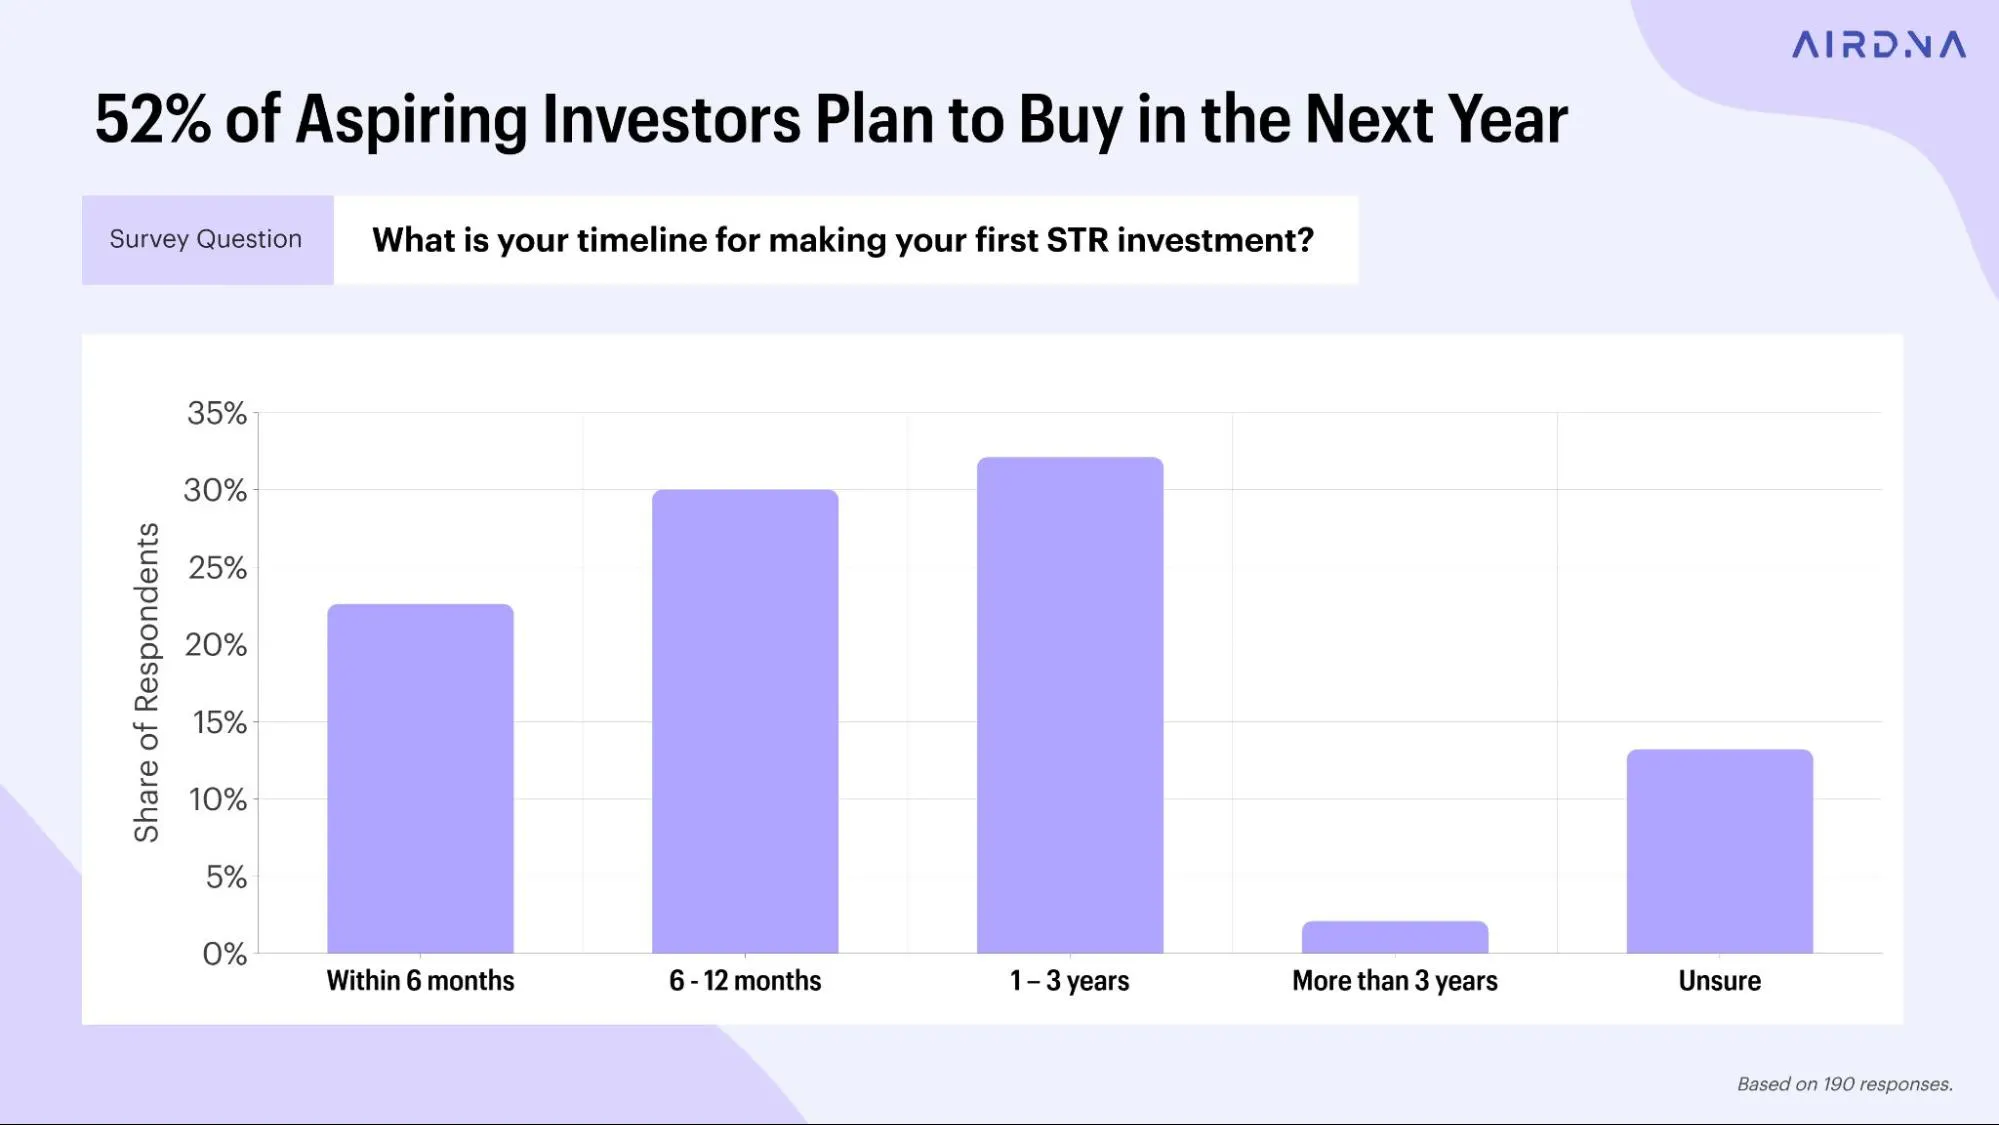
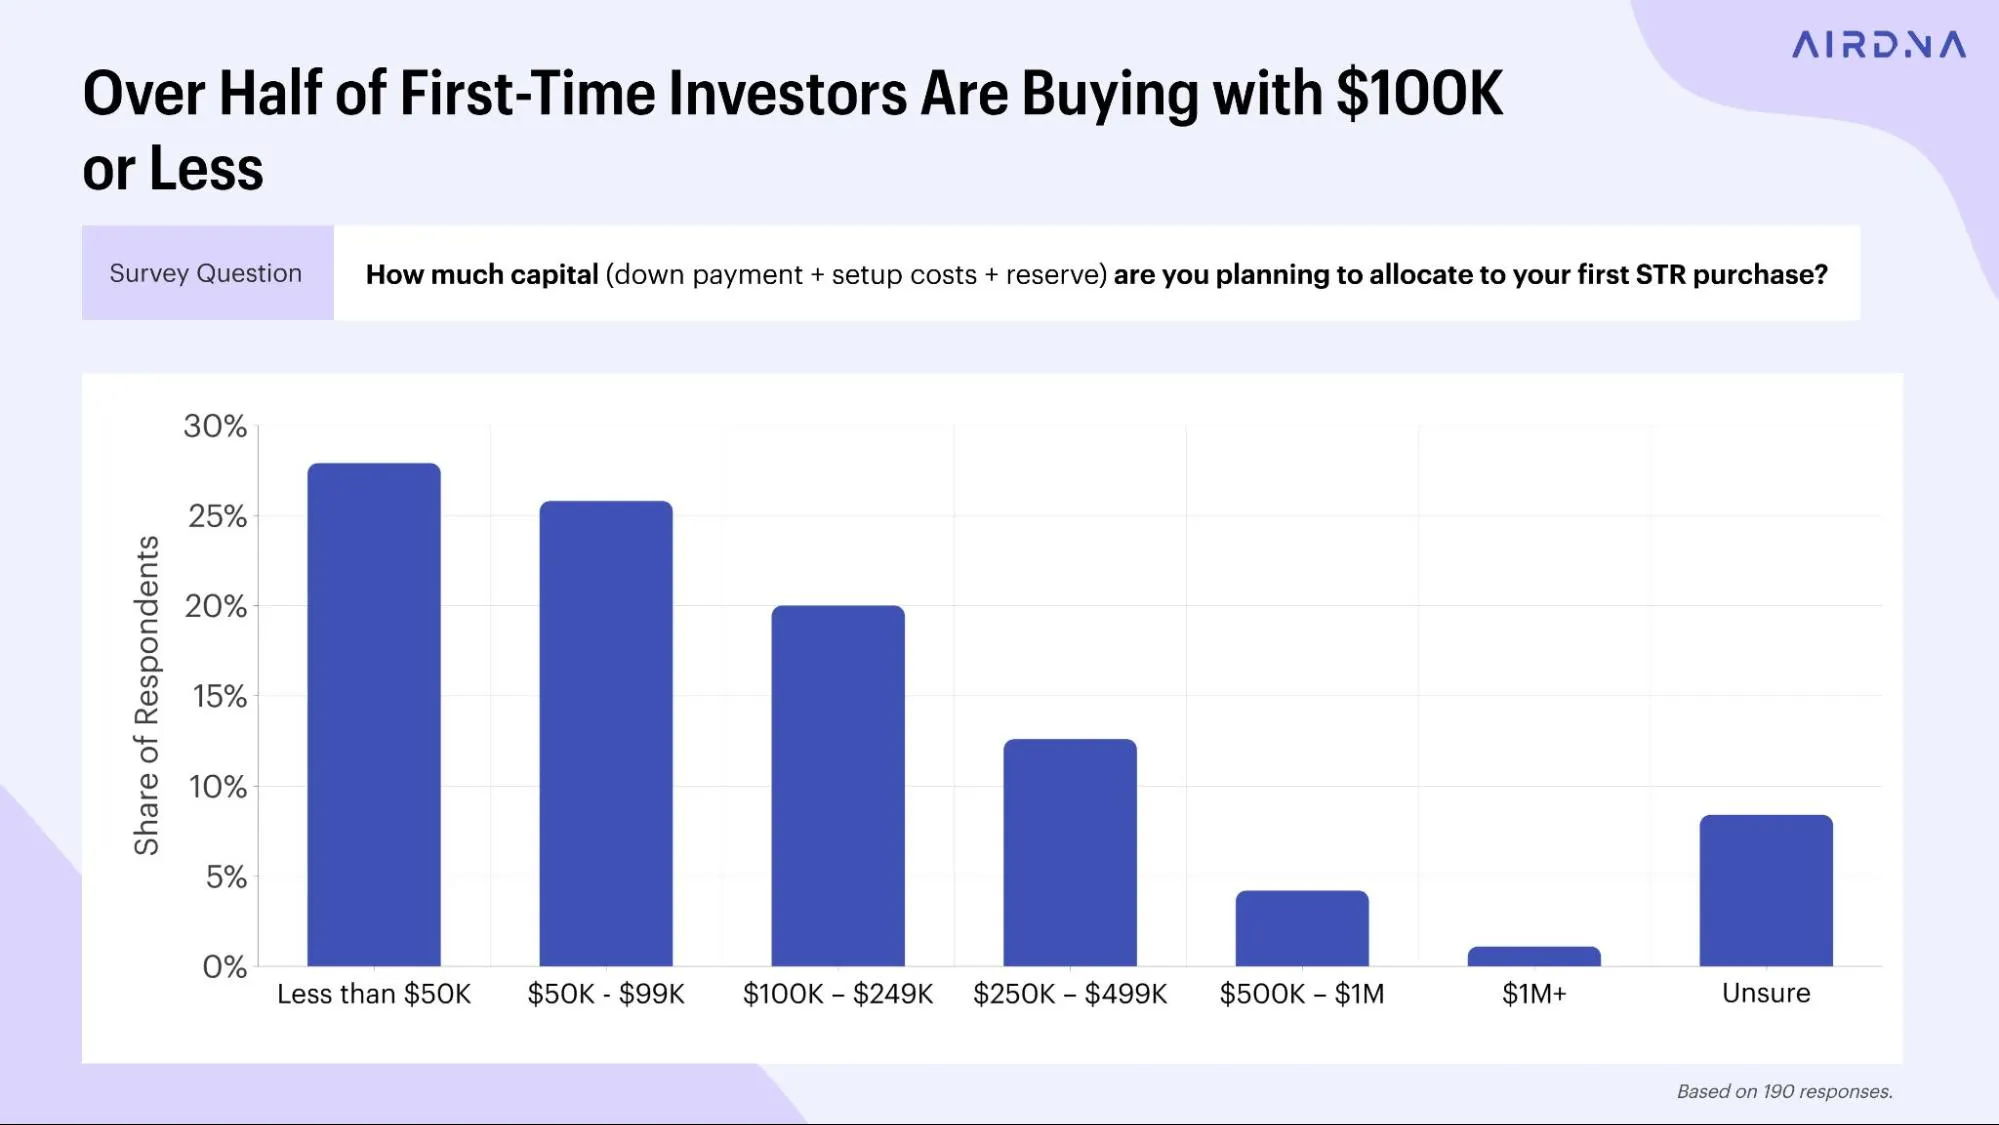
The majority plan to allocate less than $250,000 in total capital, including down payment, setup costs, and reserves. This implies that future supply growth from new entrants is likely to be incremental and price-sensitive, rather than rapid or speculative.
Education gaps reveal the real constraint
When asked where they need the most education before investing, prospective investors consistently point to fundamentals.
Regulations and permitting, market selection, property selection, underwriting, and operations all rank highly. Technology tools and tactical details rank far lower.
This reinforces a critical insight. The binding constraint for new entrants is confidence. Prospective investors want clearer answers to where to invest, what to buy, and how to evaluate returns in a more disciplined market.
Find listings that match your vision
Whether you’re planning to host two guests or twelve, our filters let you study properties that mirror your ideal setup—by bedroom count, bathroom count, or even real estate type.
Conclusion: What This Means for 2026
The 2026 short-term rental investment landscape is not defined by retreat. It is defined by discipline.
This survey makes clear that STR investing has not stalled, but matured. Capital is increasingly concentrated among experienced operators who continue to buy, expand, and adapt, even as conditions become less forgiving. Entry from new investors remains active, but more cautious. First-time entry is shaped by higher prices, tighter financing, and a greater awareness of what it takes to succeed.
Interest rates matter, but they are not shutting down the market. They are influencing how investors underwrite deals, structure financing, and choose markets. Rather than freezing activity, rates are acting as a filter that rewards stronger assumptions, flexible capital strategies, and operational competence.
Market selection has become more intentional. As investors gain experience, they move away from generic or familiar markets and toward destinations with durable demand, pricing power, and defensible fundamentals. This shift helps explain why supply growth has slowed without collapsing and why competition is increasingly concentrated in specific market types.
The result is a market that is growing more slowly and more deliberately. Supply growth appears steadier and more disciplined, driven by operators who understand their costs, their demand drivers, and their risk exposure.
For investors, this environment favors data-driven underwriting, realistic return expectations, and a professional approach to operations. For the industry, it signals continued maturation rather than contraction.
And for AirDNA, it underscores the role of transparency, analytics, and education in helping investors move from interest to action. As the easy money era fades, better data and clearer insight are becoming essential tools for navigating what comes next.
