

 Calculate Revenue
 Research Markets
 Find For Sale Properties
 Compare My Listing
 STR Revenue Calculator
 Custom Comp Sets
 Submarket Insights
 Custom Search Filters
 Rate Recommendations
 Performance Benchmarking
 Competitor Comparison
 Owner Contact Details
 Property-level performance data
 Tourism Insights
 Real Estate Investment Analytics
 About Us
 Sales
Sales Support
 Press
PressAirbnb Occupancy Curves: How to Know When to Hold Your Rates and When to Cut
Published: August 19, 2026

Linda Rollins
Key Takeaways
- An occupancy curve tracks how a date fills up over the year before check-in, and its shape tells you whether demand is still ahead of you or already gone.
- Breckenridge, Colorado's February is 36% sold three months out; its October is under 6% sold at the same point. The same open calendar means opposite things.
- In every market studied, the last four weeks of the slow month accounted for more than a third of everything sold that month.
- The final occupancy a curve reaches decides how hard you fight on price: a market that tops out at 30% leaves far more competition for each remaining night than one that clears 66%.
- Property size changes the picture. In Breckenridge's October, small properties take 58% of their bookings inside 28 days, against 30% for four- to five-bedroom homes.
- In large San Jose/Palo Alto, California homes, weekday nights book far later than weekend nights, so the two halves of the calendar need different pricing.
Stop Guessing Your Nightly Rate
Most hosts price on gut feel. Adapt prices every night on real demand, real competition, and what drives bookings.
Booking Timing Decides Your Next Move, Not the Calendar
You're looking at a month in your calendar that's barely booked, and it starts 30 days from now. Do you cut your rates, or hold?
That's not a question you can answer from the calendar alone. Revenue management is usually framed around how much a night should cost, but the answer depends on something else first: when the guests for those nights are actually booking. In some months, a calendar that is empty 30 days out means most of the demand has already come and gone, and you'll have to be aggressive with your rates to get booked. In other months, it means the demand hasn't arrived yet, and cutting now would hand away revenue you were going to earn anyway.
Your calendar can't tell you which situation you're in. Your market's booking window can, and it answers two questions.
1. When to pay closest attention to your rates
Your booking window is the stretch of time when most bookings for a given date actually come in. If most guests book within 60 days of check-in, that's the stretch when you want to be watching your calendar closely and pricing to how demand is shaping up.
2. How to move your rates
Knowing when people book also tells you how to adjust, based on how much demand is still ahead of you. If 50% of bookings in your market happen within a month of stay and you're still six weeks out, most of the demand is still coming, and cutting rates pre-emptively will hurt your bottom line. But if 80% of stays are normally booked by six weeks out and your calendar is still open, that demand has come and gone without you, and you need to cut rates to get booked. How far you move should also depend on how occupancy in your market is pacing, which we'll cover later.
Occupancy Curves Show You When Bookings Happen
So how do you find out when the guests in your market actually book?
An occupancy curve tracks how a date, or a set of dates, fills up over time. You can look at what occupancy was at every point in the year leading up to those dates: six months out, three months out, four weeks out, one week out. Plot those points and you get a curve that climbs from zero to whatever the final occupancy turned out to be.
The shape of that curve is where the story is. Where it's steep, bookings are pouring in. Where it's flat, almost nothing is happening. A curve that rises steadily from a year out describes a market where guests commit early. One that sits flat for ten months and then shoots up in the final weeks describes a market where they don't.
An occupancy curve also tells you what the final occupancy was for the market, and that shapes pricing decisions too. A curve that ends at 30% calls for a very different strategy than one that ends at 85%. You'll have to fight harder on price for a marginal night when the curve ends at 30%, because there's much more competition for that booking.
Below we look at the occupancy curves of three markets, in the month where guests book furthest ahead and the month where they wait the longest. In each market the two curves look almost nothing alike, and a rate strategy built for one would cost you money in the other.
Breckenridge, Colorado: The Widest Seasonal Gap

February is Breckenridge's peak demand month, and the month when guests book furthest in advance. Ski demand pushes market occupancy to around 77%. October, one of the slowest months of the year, tops out at roughly 30%.
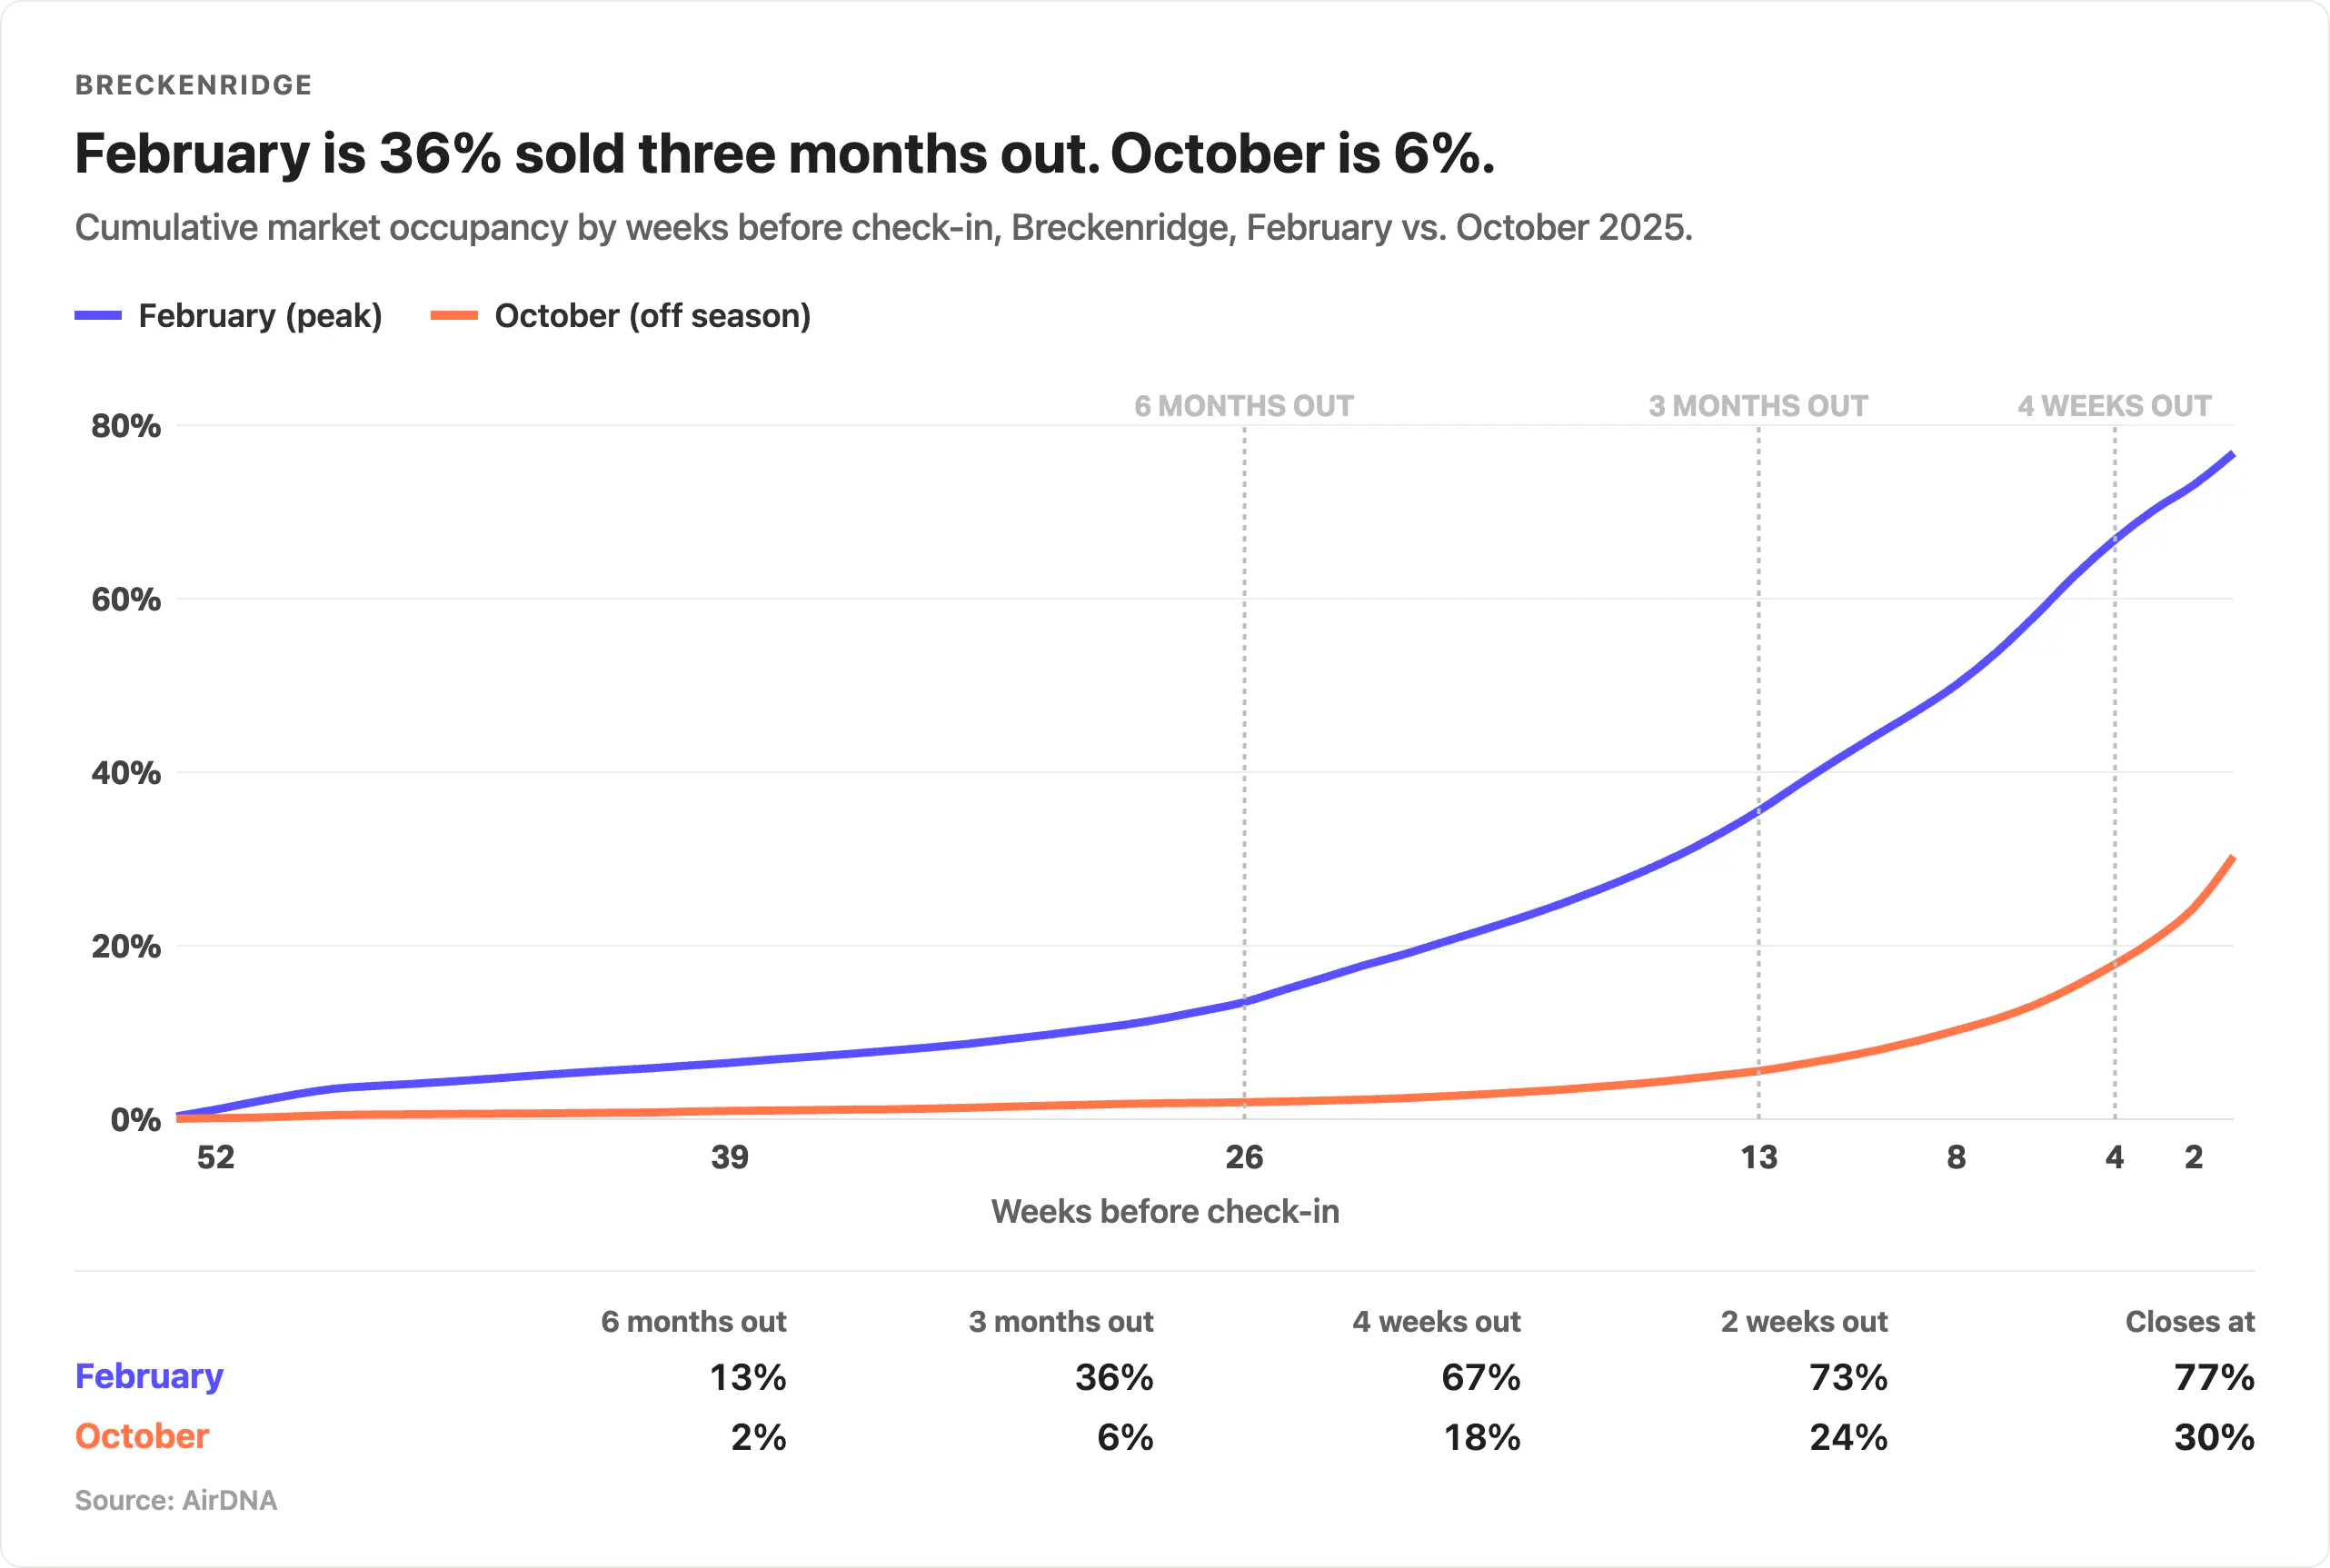
February builds early and steadily. The market is already 13% occupied six months out, 36% at three months, and 50% with eight weeks to go. By four weeks out it sits at 67%, leaving only around 10 percentage points of occupancy still to sell before the month closes at 77%.
The most striking way to see the gap: Breckenridge's February occupancy surpasses October's final occupancy rate at around 15 weeks out. Three and a half months before check-in, February has already sold more of its inventory than October ever will.
October barely registers until the end. Six months out the market is 2% sold, and at three months it's still under 6%, meaning roughly 25 of its eventual 30 percentage points of occupancy are still to come. The curve doesn't start moving until around eight weeks out, when it crosses 10%, and it only reaches 18% with four weeks to go. Nearly half of October nights sold land inside the final five weeks.
What this means for Breckenridge hosts
February and October ask for two very different pricing strategies. A soft February calendar at 90 days out is a real problem, because the market is already 36% sold, roughly half of what it will sell all month. You'll want to watch your February rates closely from six months out through the last month before check-in, when most of the month's selling happens.
A soft October calendar at 90 days out is completely normal, because the market is barely 6% sold and almost everything is still ahead of you. October doesn't need much attention until you're around five weeks out, and then it needs all of it. At 30% occupancy, there's a lot of competition for every remaining booking.
Hilton Head, South Carolina: The Earliest Start

In Hilton Head, guests book furthest ahead for February, and occupancy reaches 65%. December, when guests wait the longest to book, finishes at 32%.
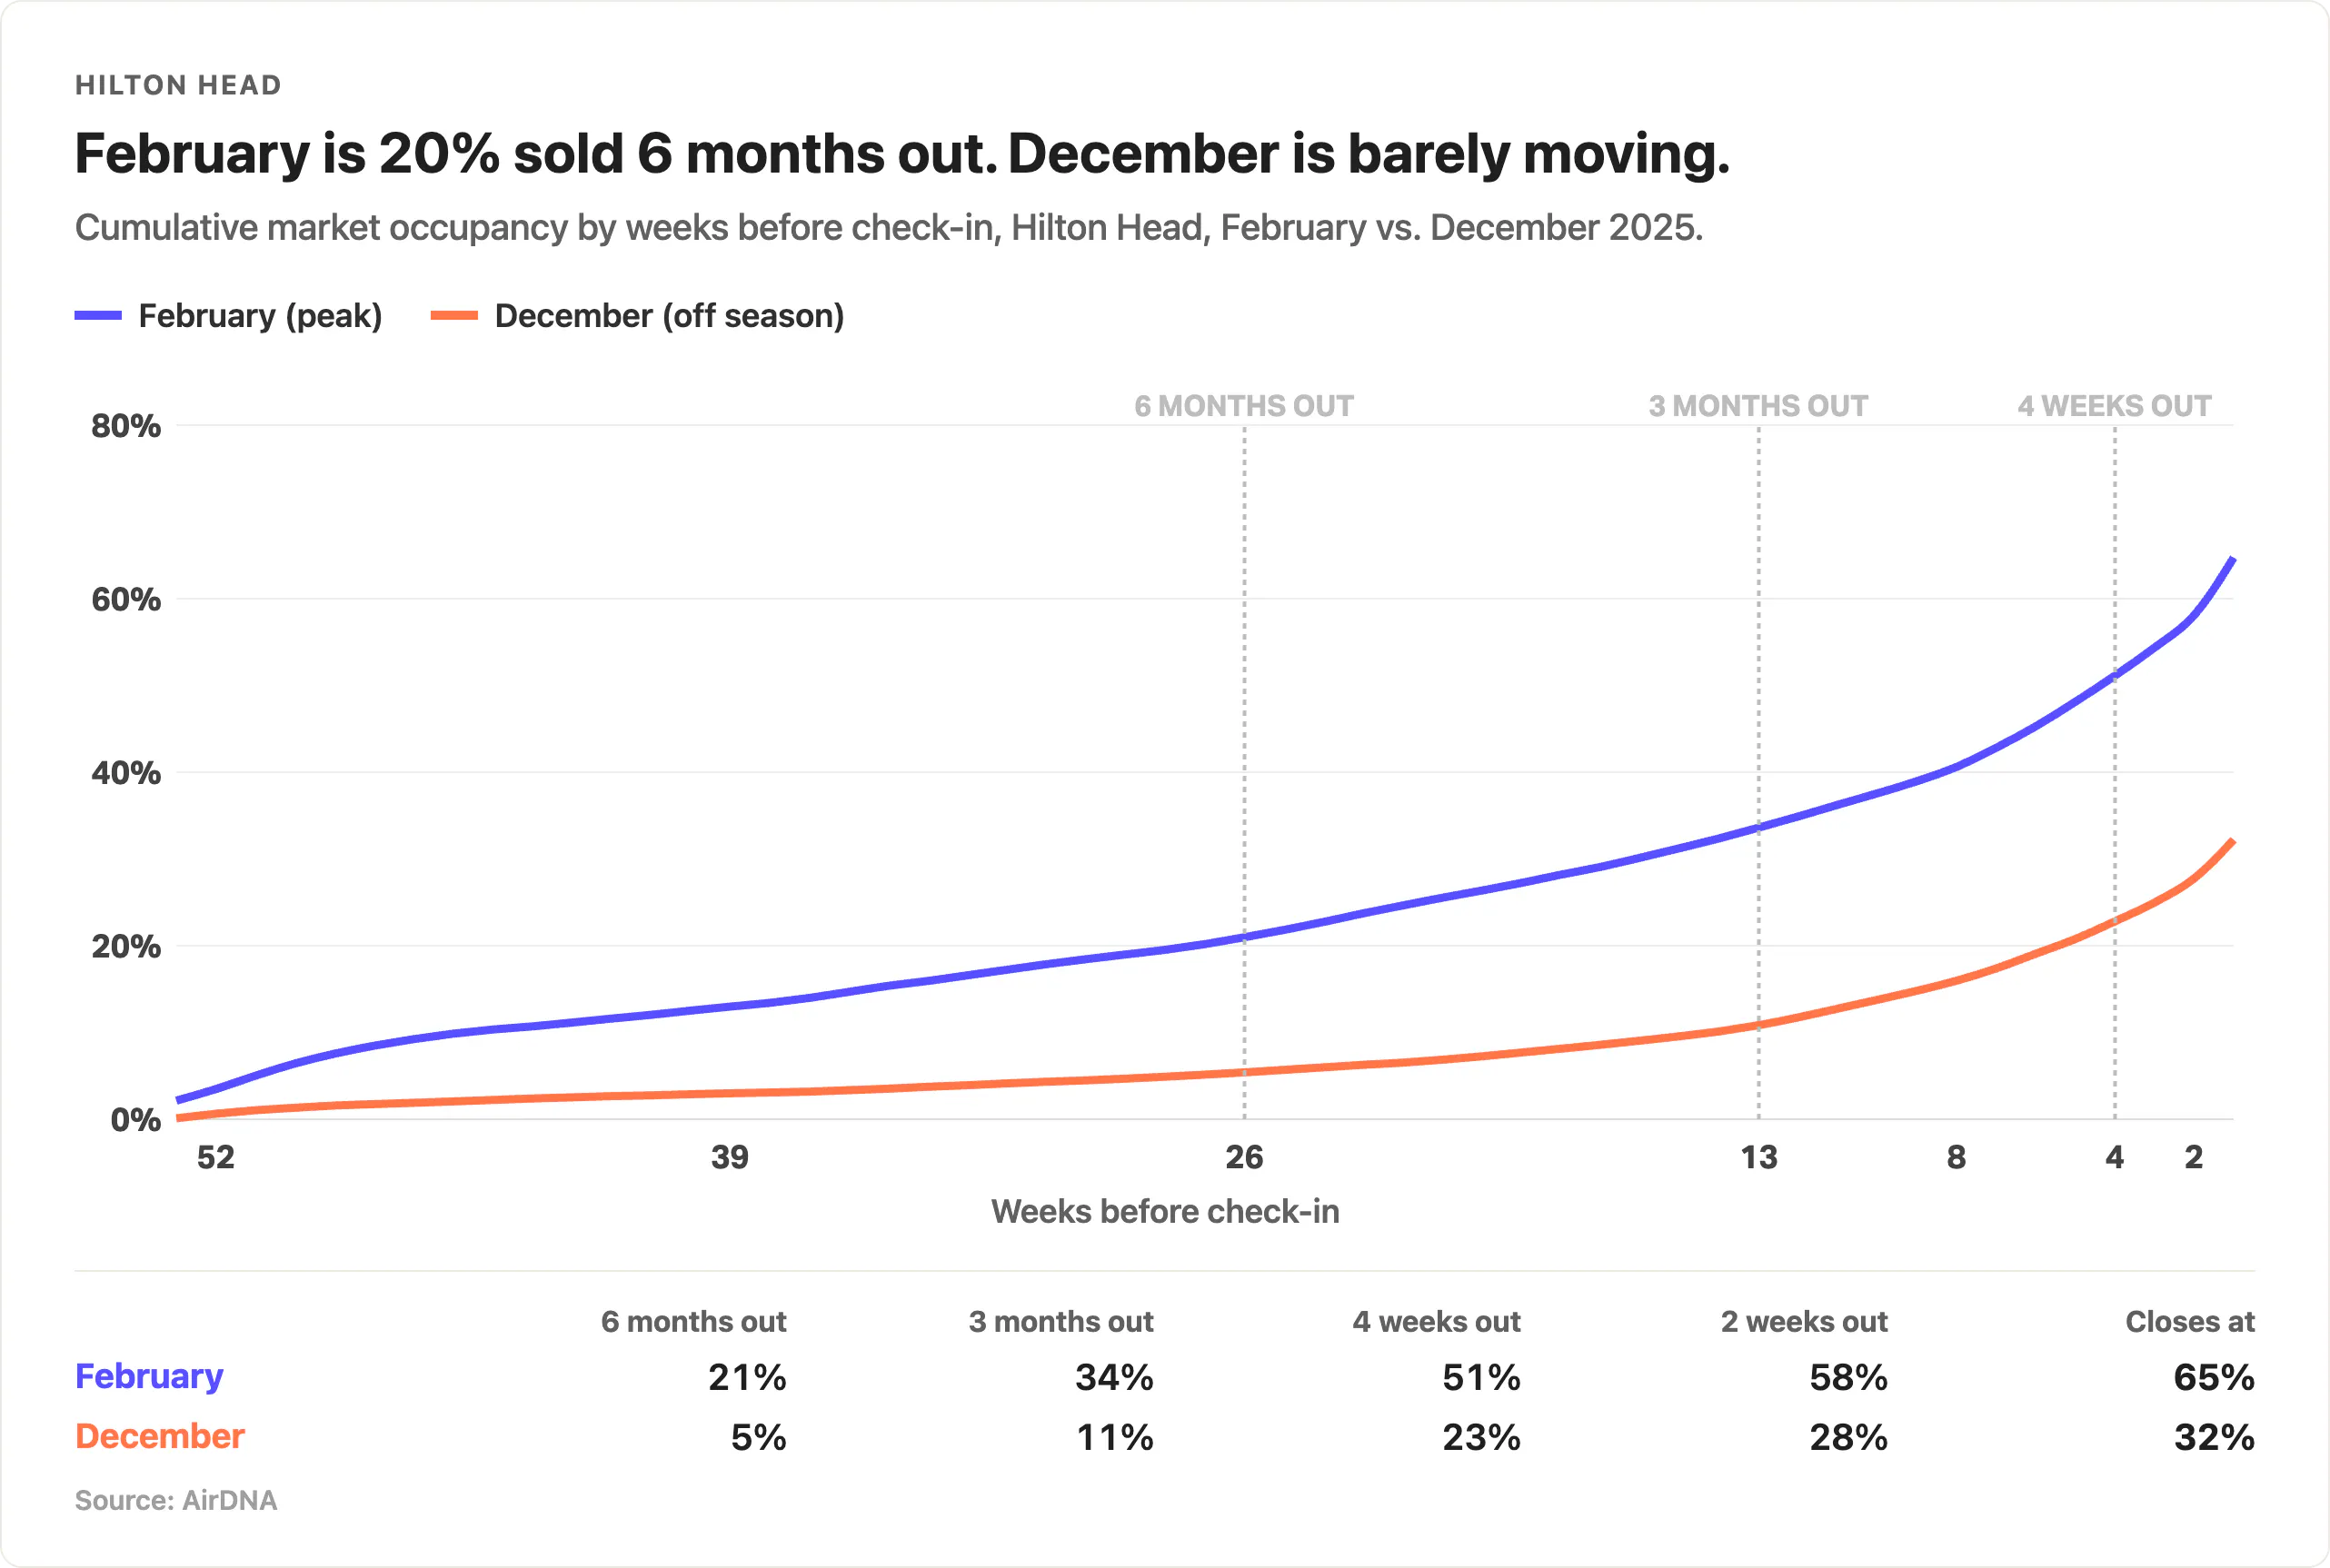
February has an early booking curve. Hilton Head is already 2% occupied a full year out and 21% occupied six months out, as snowbirds securing their winter stays book well ahead of the season. By three months out the market is at 34% occupancy, more than half the level it will finish at.
That early start changes what the last month means. Between four weeks out and check-in, February adds only around 14 percentage points, going from 51% to 65%. There's still demand arriving late, but it isn't going to change the shape of your month.
December starts slow and stays shallow. The curve is at 5% six months out, 11% at three months, and 23% with four weeks to go, finishing at 32%. That final month is worth around 9 percentage points of occupancy, close to a third of everything December will sell.
What this means for Hilton Head hosts
February rates need to be set before most guests are thinking about it. A year out is not too early when a fifth of the market is already sold six months out. December is the opposite. The demand arrives late, so you'll have to be patient through the fall and price competitively in the final weeks, when the bookings are actually being made.
Get Your Adapt Rate
See the rate we'd recommend for your property tonight, based on real demand and your true comp set.
San Jose/Palo Alto, California: A High Floor and a Late Rush

San Jose/Palo Alto behaves differently from both leisure markets above. July, its peak, reaches around 84% occupancy. January, one of its weakest months, still finishes at roughly 66%.
That's the first thing worth noticing. Off-season in this market ends at a higher occupancy than peak season in Hilton Head, which changes how the off-season should be priced. A 30% market is one where most nights won't sell. A 66% market is one where they will, so the January risk isn't an empty calendar. It's a full one sold too cheaply.
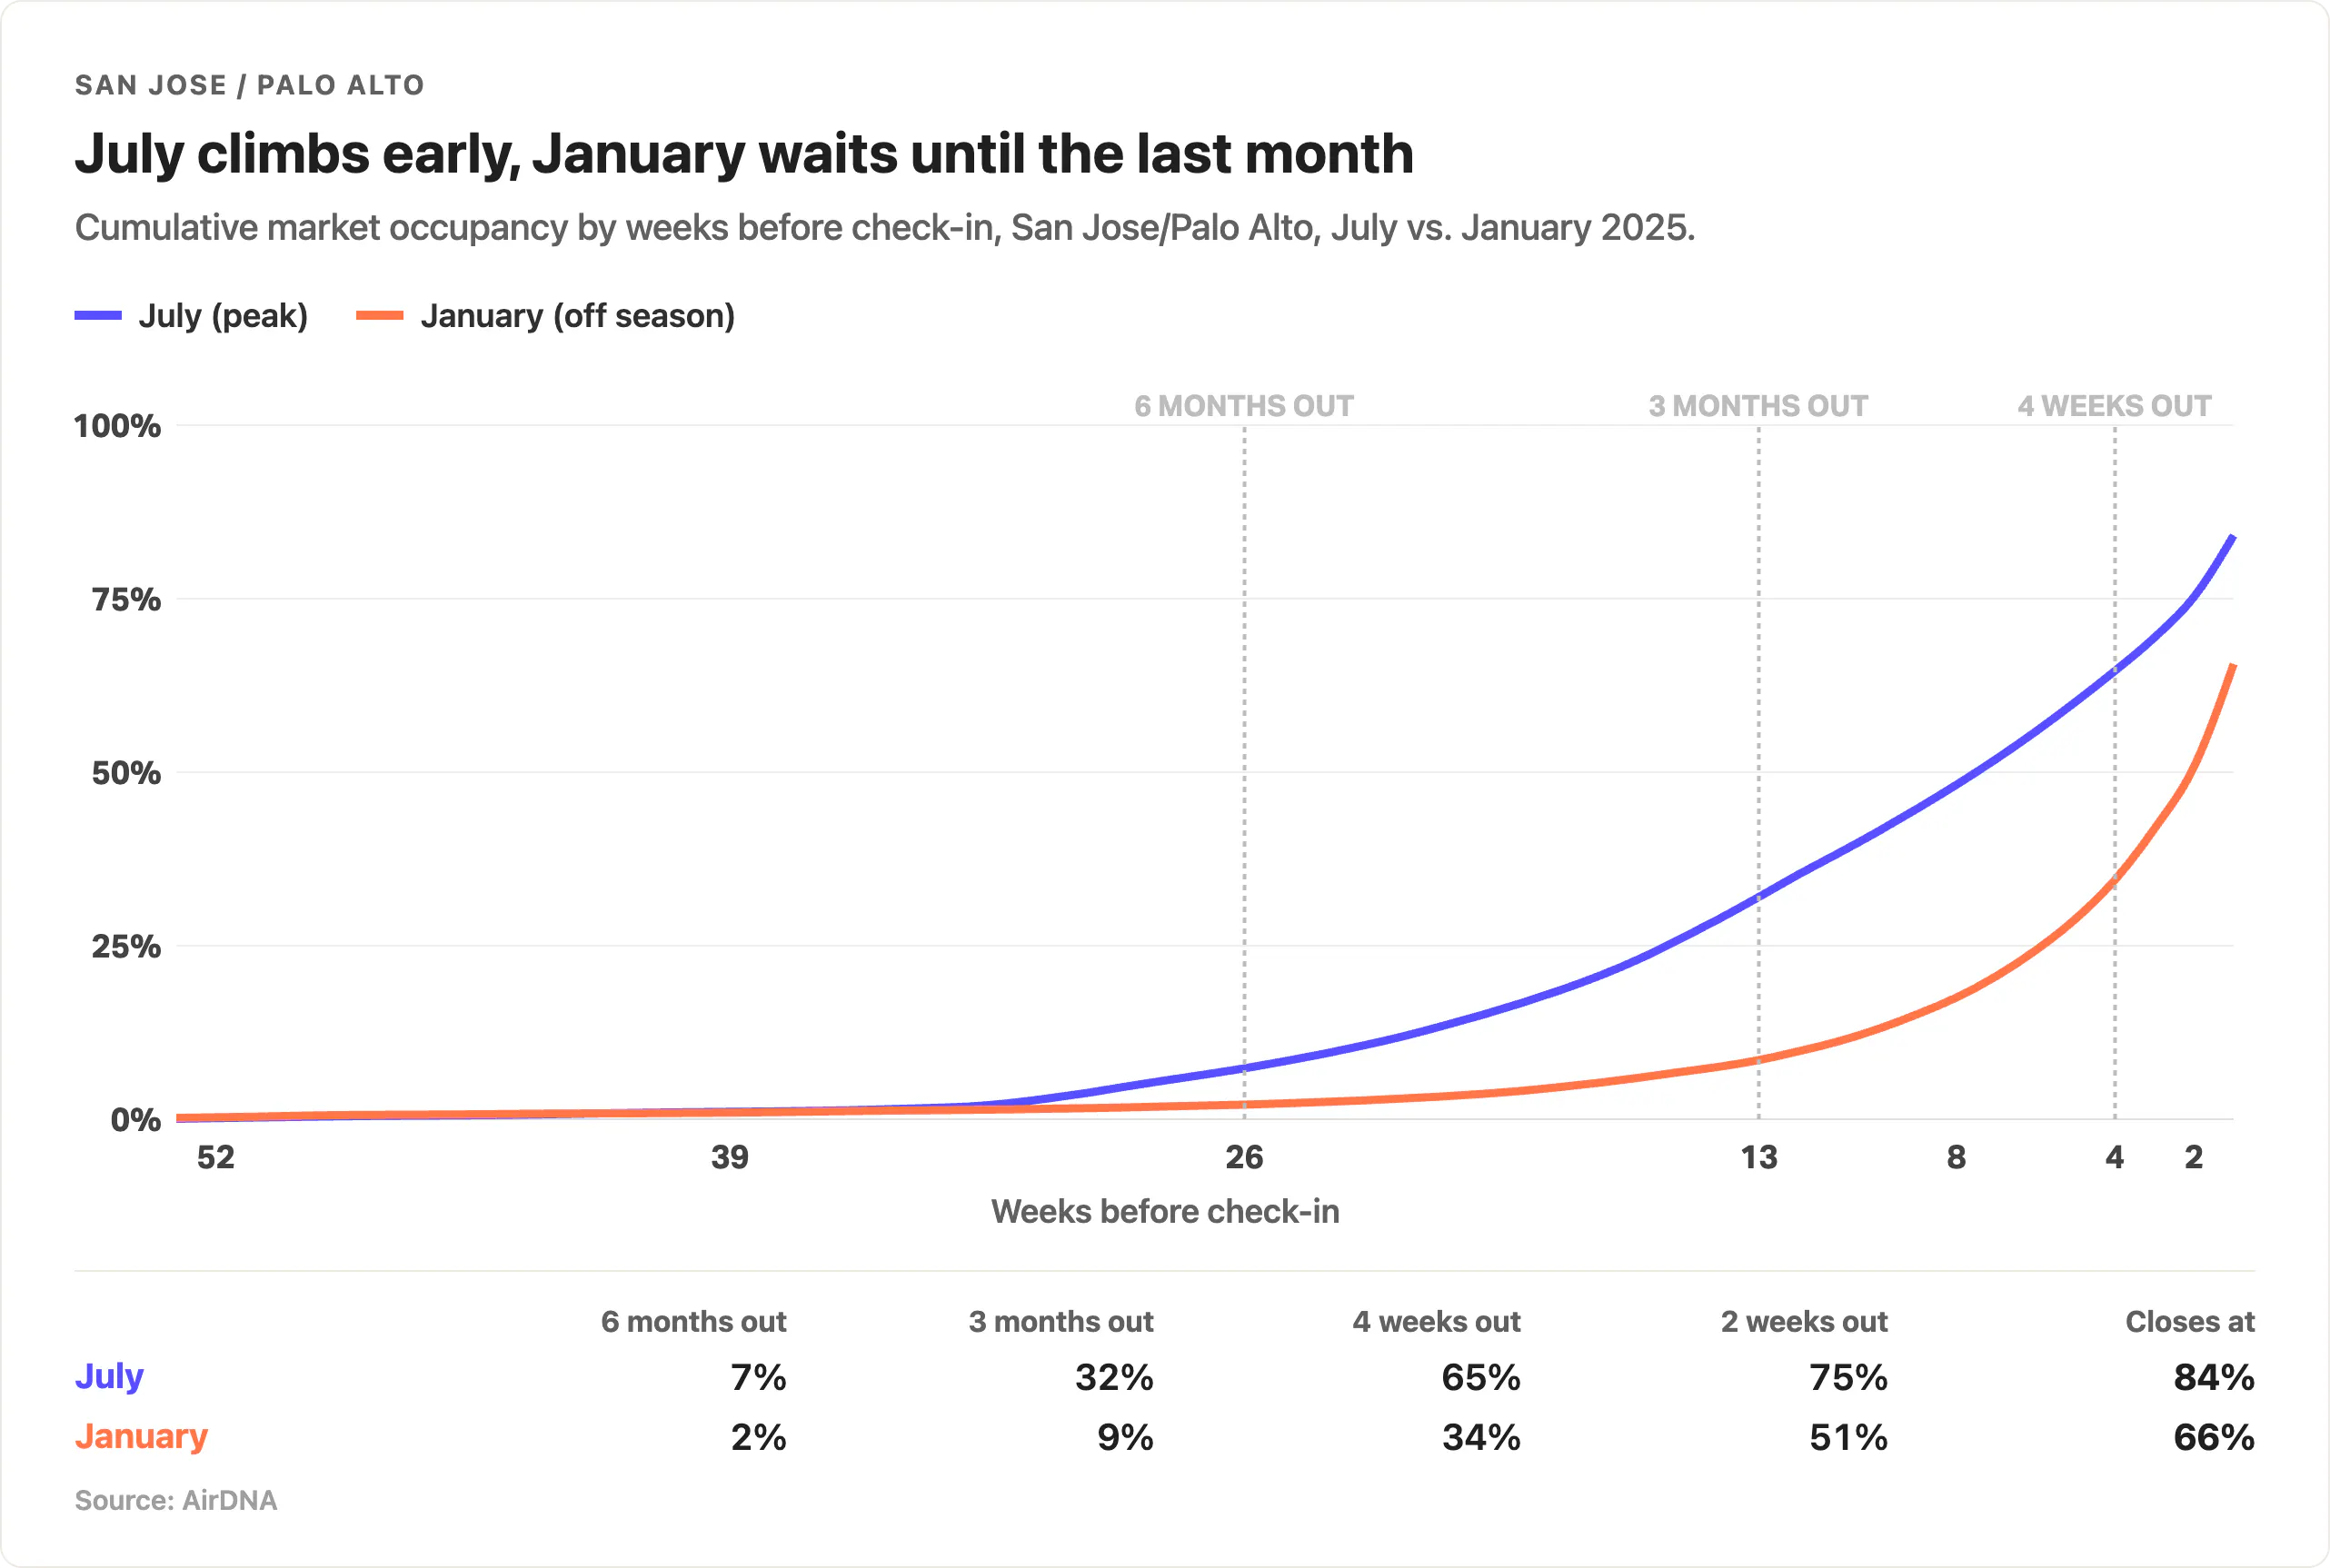
July's curve starts late. At six months out the market is only 7% occupied, against 21% for Hilton Head in February at the same point. July then climbs quickly: 32% at three months, 48% at eight weeks, 65% at four weeks, finishing at 84%.
January is a real late rush. The curve is at 9% three months out and 34% at four weeks. It then jumps to 51% at two weeks out and 66% by check-in, with the final two weeks alone worth around 15 percentage points of occupancy.
What this means for San Jose/Palo Alto hosts
You aren't looking at the long horizon that Breckenridge or Hilton Head hosts are. July rates should be dialed in by April, not the previous autumn. July also finishes at 84% occupancy, close to a sellout, so the odds of any given July night booking are high. Don't discount too early. January calls for the same patience for a different reason: an empty-looking calendar four weeks out isn't cause for panic, because nearly half of what the market will sell still hasn't sold.
Three Pricing Takeaways From These Markets
Three things carry across all six curves.
1. Set your peak season rates earlier than feels necessary
In every market, the high-occupancy month starts building sooner and is further along at every point in the window. Scarcity is what drives guests to commit early, so the months where your rate matters most are also the months where it gets locked in earliest.
2. Be patient in the off-season until your booking window arrives
In every market we looked at, the last four weeks of the slow month accounted for more than a third of everything sold that month. Cutting aggressively before the four-week window discounts nights that might have sold at higher rates. Cutting inside it is where competitive pricing actually earns you more revenue.
3. Let the ceiling decide how hard you fight on price
Breckenridge's October tops out at 30% while San Jose's January reaches 66%. Both are off-season, but in one most nights will go unsold and in the other two-thirds of inventory clears. The lower the ceiling, the more competition there is for every remaining booking, and the more work your price has to do.
Booking Timing by Bedroom Count

Those takeaways are all market-level. Within a single market, booking behavior can differ significantly by property size.
A five-bedroom and a studio aren't competing for the same traveler. One is filling with groups and families, the other with couples and solo trips, and those guests plan on different timelines. Market-wide figures may not describe your booking window at all.
To compare booking trends across property sizes, we grouped bookings by how far ahead they were made. For each property size, we looked at the share of its bookings that arrive in each band, from inside a week to more than six months out.
Hilton Head, South Carolina
Different property sizes can see almost identical booking trends in one season and diverge sharply in another. Hilton Head is the clearest example.
In February, booking timing for zero- to two-bedroom and four- to five-bedroom properties is nearly indistinguishable. Both receive around 26% of their bookings inside 28 days, roughly half inside 90 days, and around 30% more than six months out. Small and large groups commit on the same timeline when demand is high.
December pulls them apart. Smaller properties receive 40% of their bookings inside 28 days, against 25% for four- to five-bedroom properties. At the other end, four- to five-bedroom properties receive 41% of their bookings more than 90 days out, compared with 26% for the smaller ones.
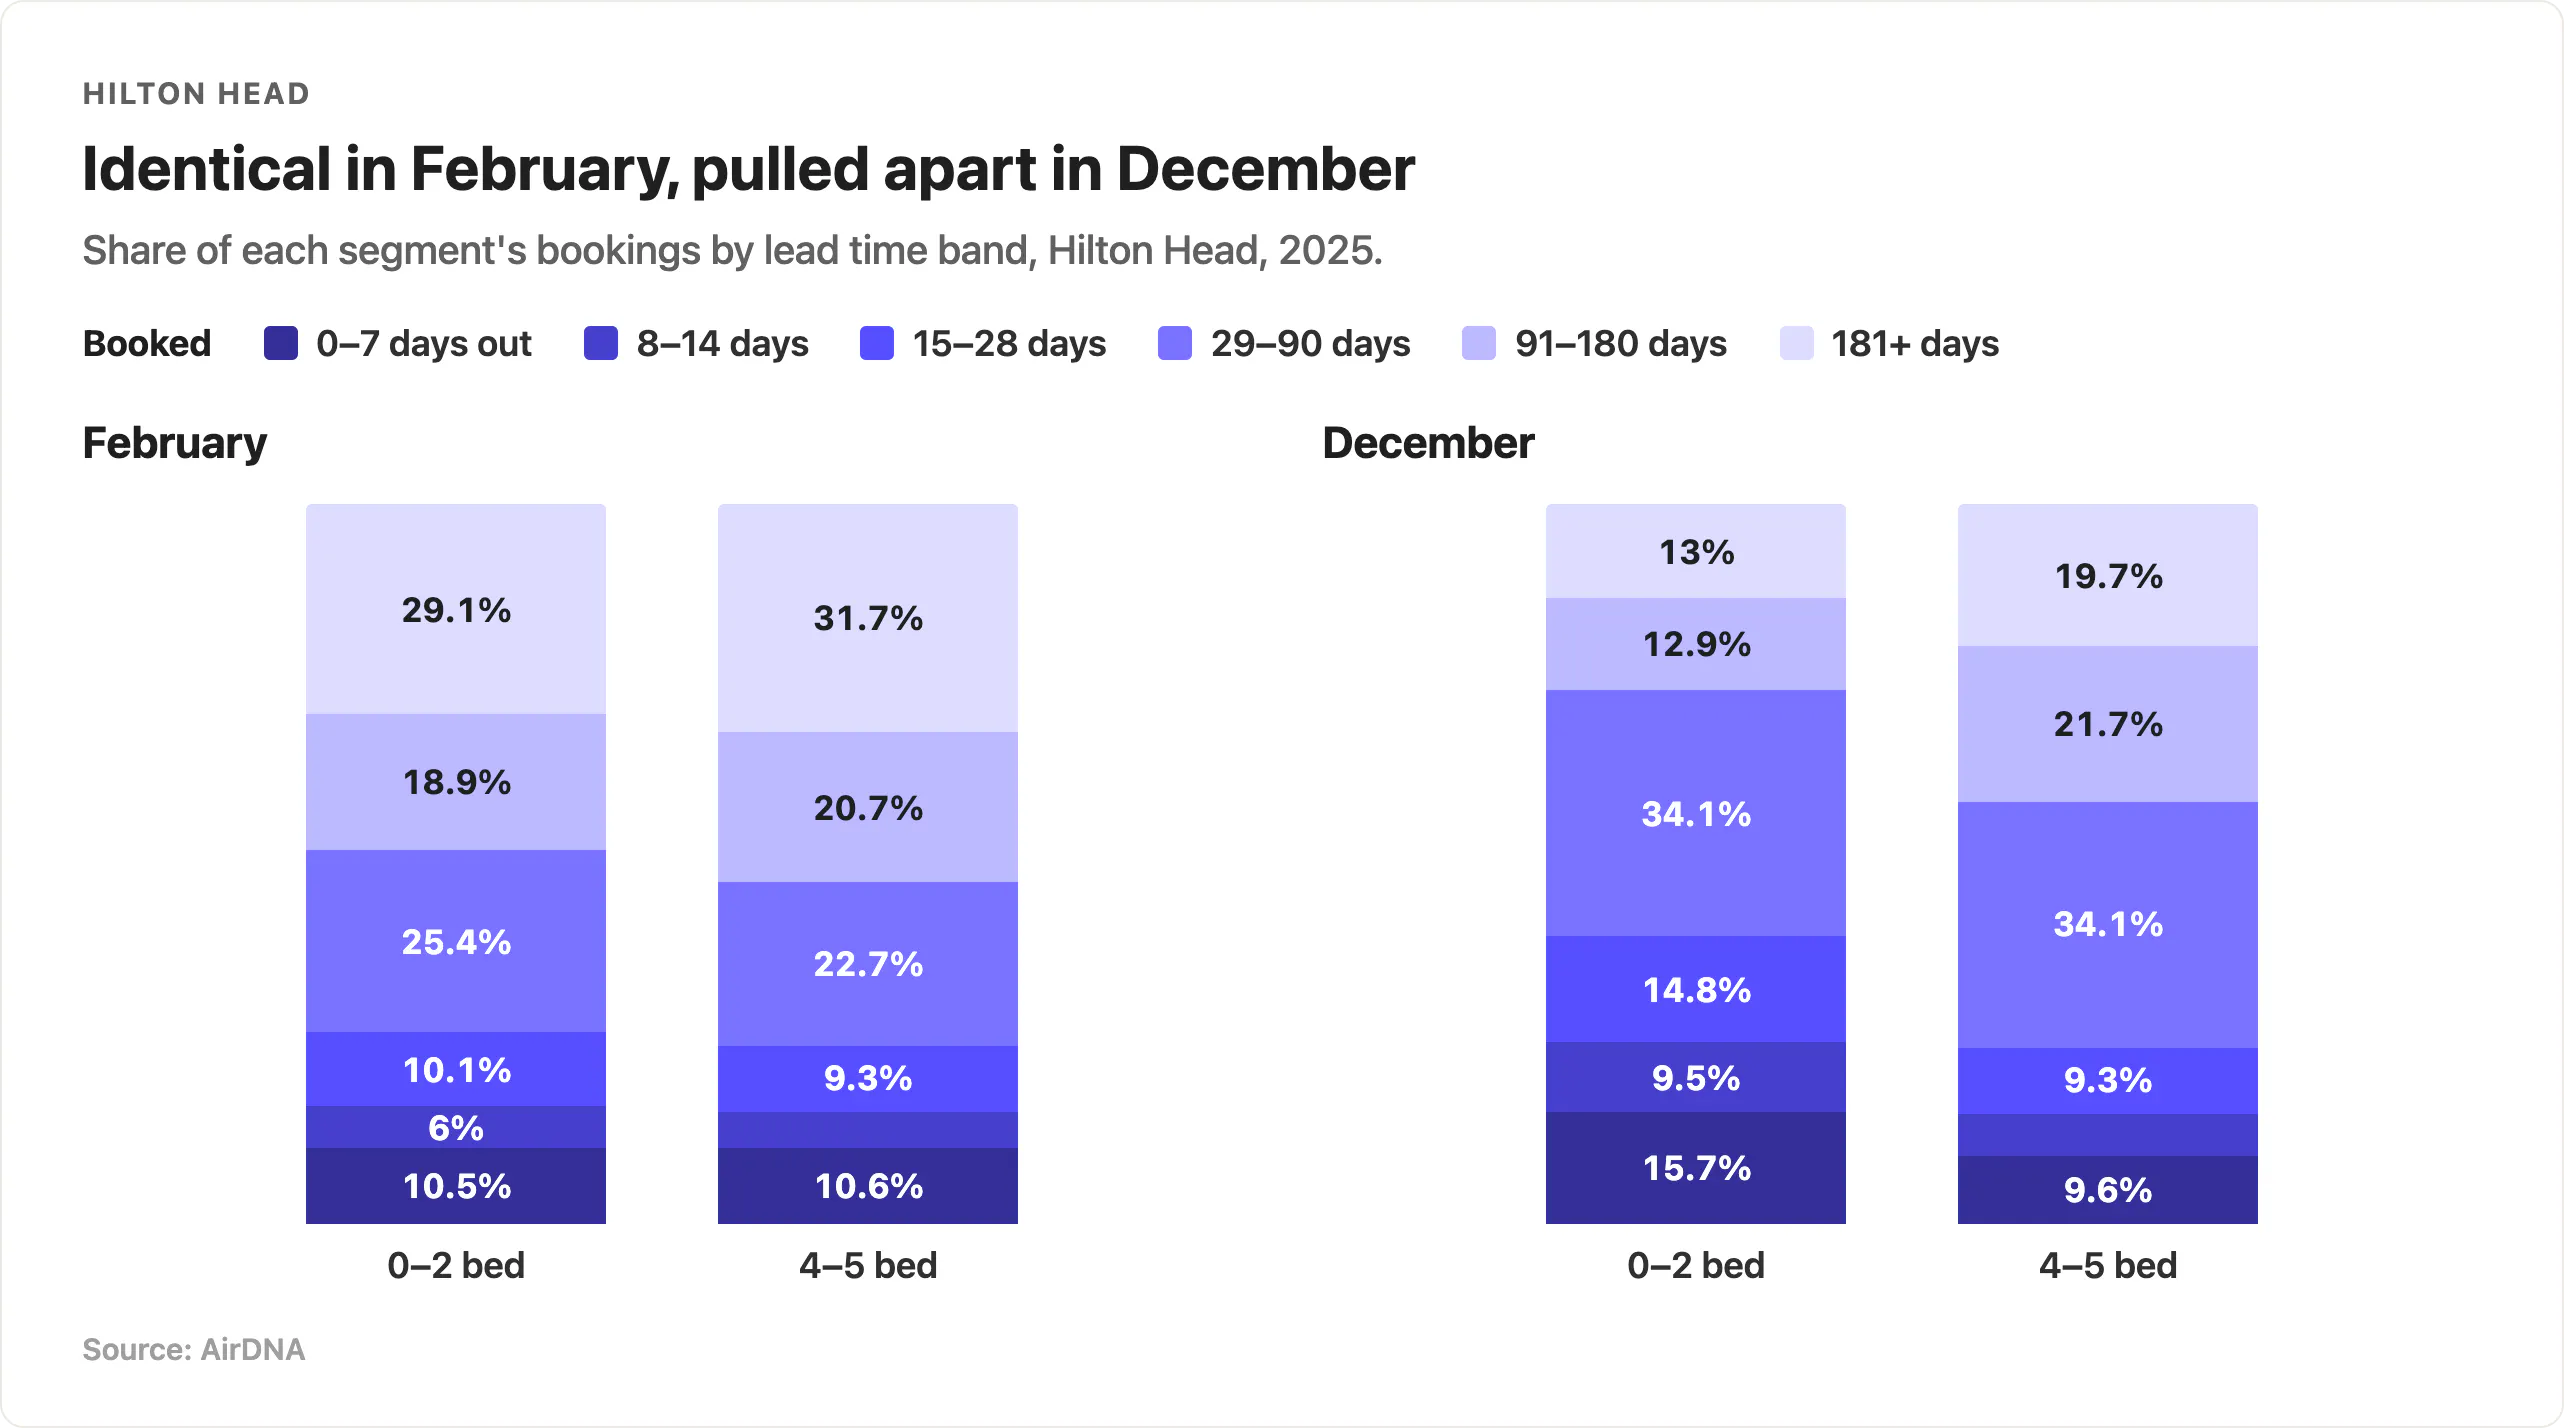
In the off-season, Hilton Head sees many spontaneous trips from small groups booking at the last minute. Larger properties get booked further in advance because of the extra planning a group trip requires.
In December, a studio and a five-bedroom shouldn't be on the same clock. The small property can hold rates into the final weeks and still fill. The larger one may not, so its positioning deserves more attention.
Breckenridge, Colorado
In Breckenridge, larger properties book earlier than smaller ones in both seasons, and the gap is much wider in the off-season.
In February, four- to five-bedroom properties receive 52% of their bookings more than 90 days out, against 39% for zero- to two-bedroom properties. Inside 28 days it's 14% versus 20%, a modest gap but consistently in the same direction.
October is a different picture entirely. Smaller properties receive 58% of their bookings inside 28 days, nearly double the 30% that larger properties receive in the same window. And 24% of small-property bookings arrive in the final week, while larger properties are still doing most of their selling between one and three months out.
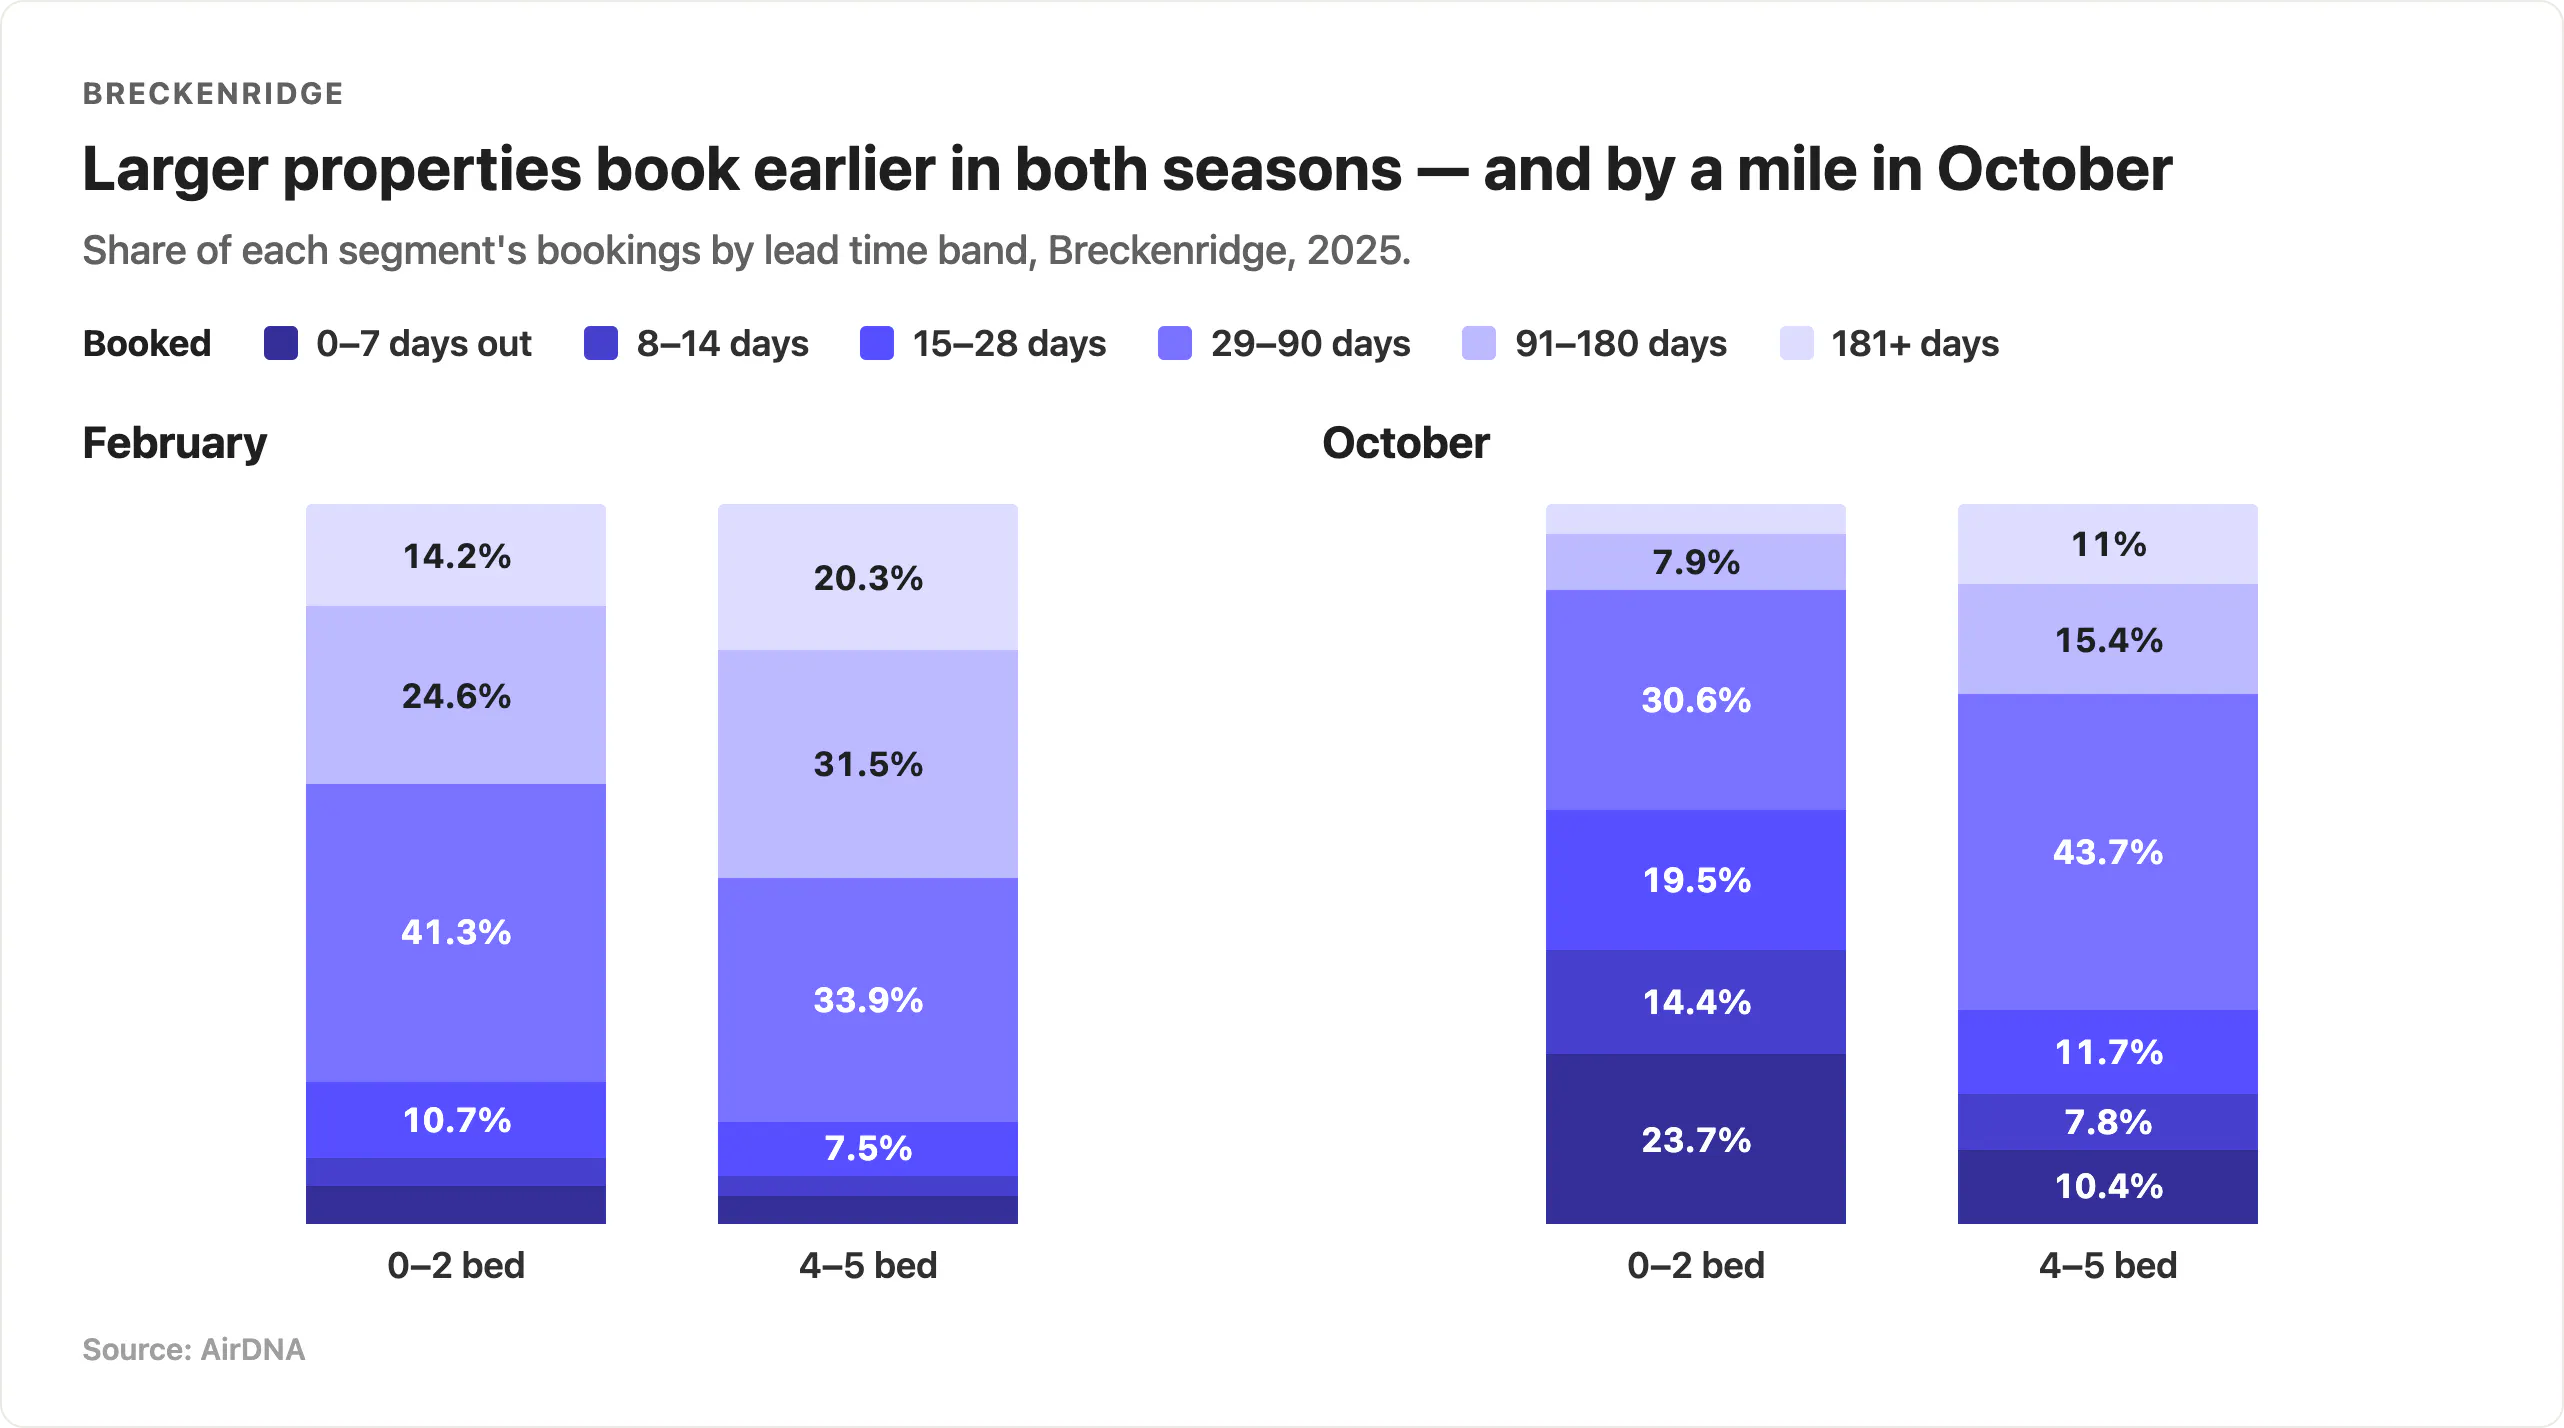
So the takeaway splits by size. Larger properties should have both February and October rates settled earlier, because the demand arrives early in both months. Smaller properties can hold longer into the window, especially in October, when more than a third of their bookings land inside two weeks of check-in.
San Jose/Palo Alto, California
Larger properties generally book further ahead than smaller ones, but not always. In San Jose/Palo Alto, larger properties book later than smaller ones, and only in peak season.
In July, four- to five-bedroom properties receive 40% of their bookings inside 28 days, against 27% for zero- to two-bedroom properties, and 17% arrive in the final week compared with 10%. In January the two segments look much the same, within a couple of percentage points in every band.
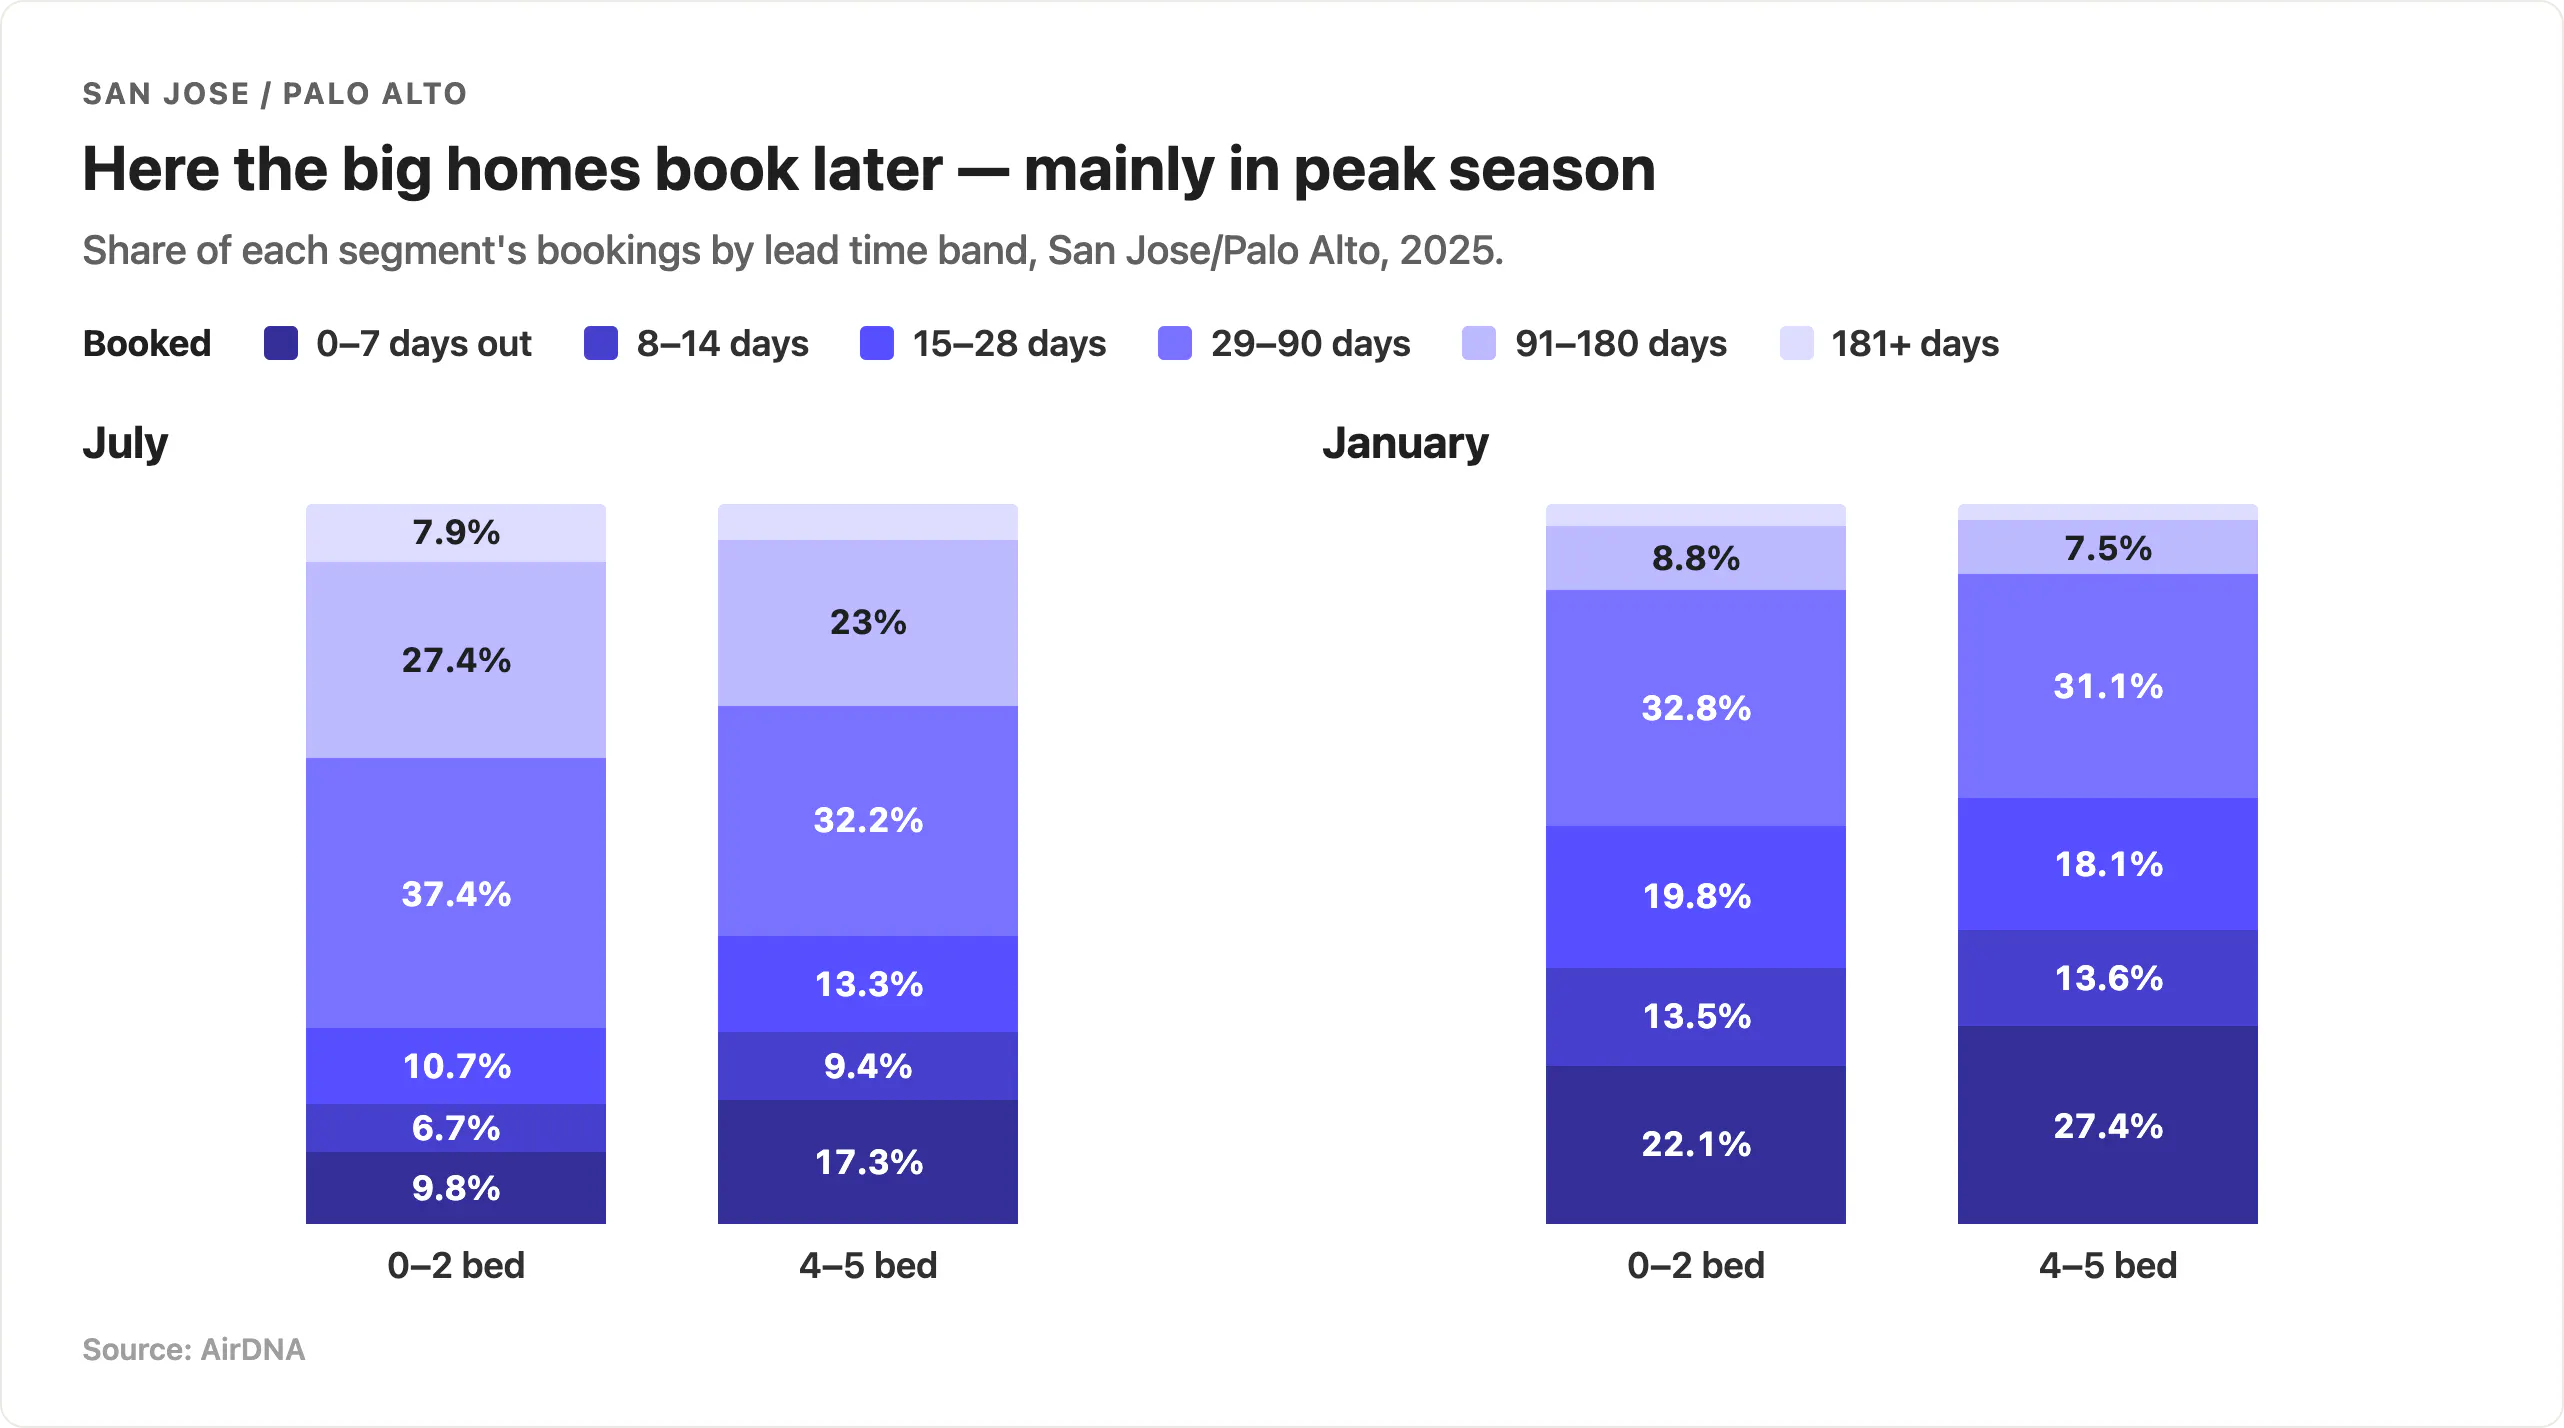
Bigger homes here cater to companies, people relocating, and families traveling for medical care, none of whom know their dates far in advance. That produces more last-minute bookings.
Smaller places serve tourists, and those guests book early because the smaller properties do sell out. In July, occupancy among zero- to two-bedroom properties reaches 86%, compared with 71% for four- to five-bedroom properties. Once the small units are gone, a late booker has nothing left to take but the much more expensive large homes.
San Jose/Palo Alto is a good reminder that the general rules are only starting points. "Bigger properties book earlier" is true often enough to be useful, but it will cost you money if you never check it against your own market.
Weekend and Weekday Nights Book on Different Clocks
Not all days within a month book on the same timeline either. In San Jose/Palo Alto, whether weekday and weekend nights book differently depends almost entirely on property size.
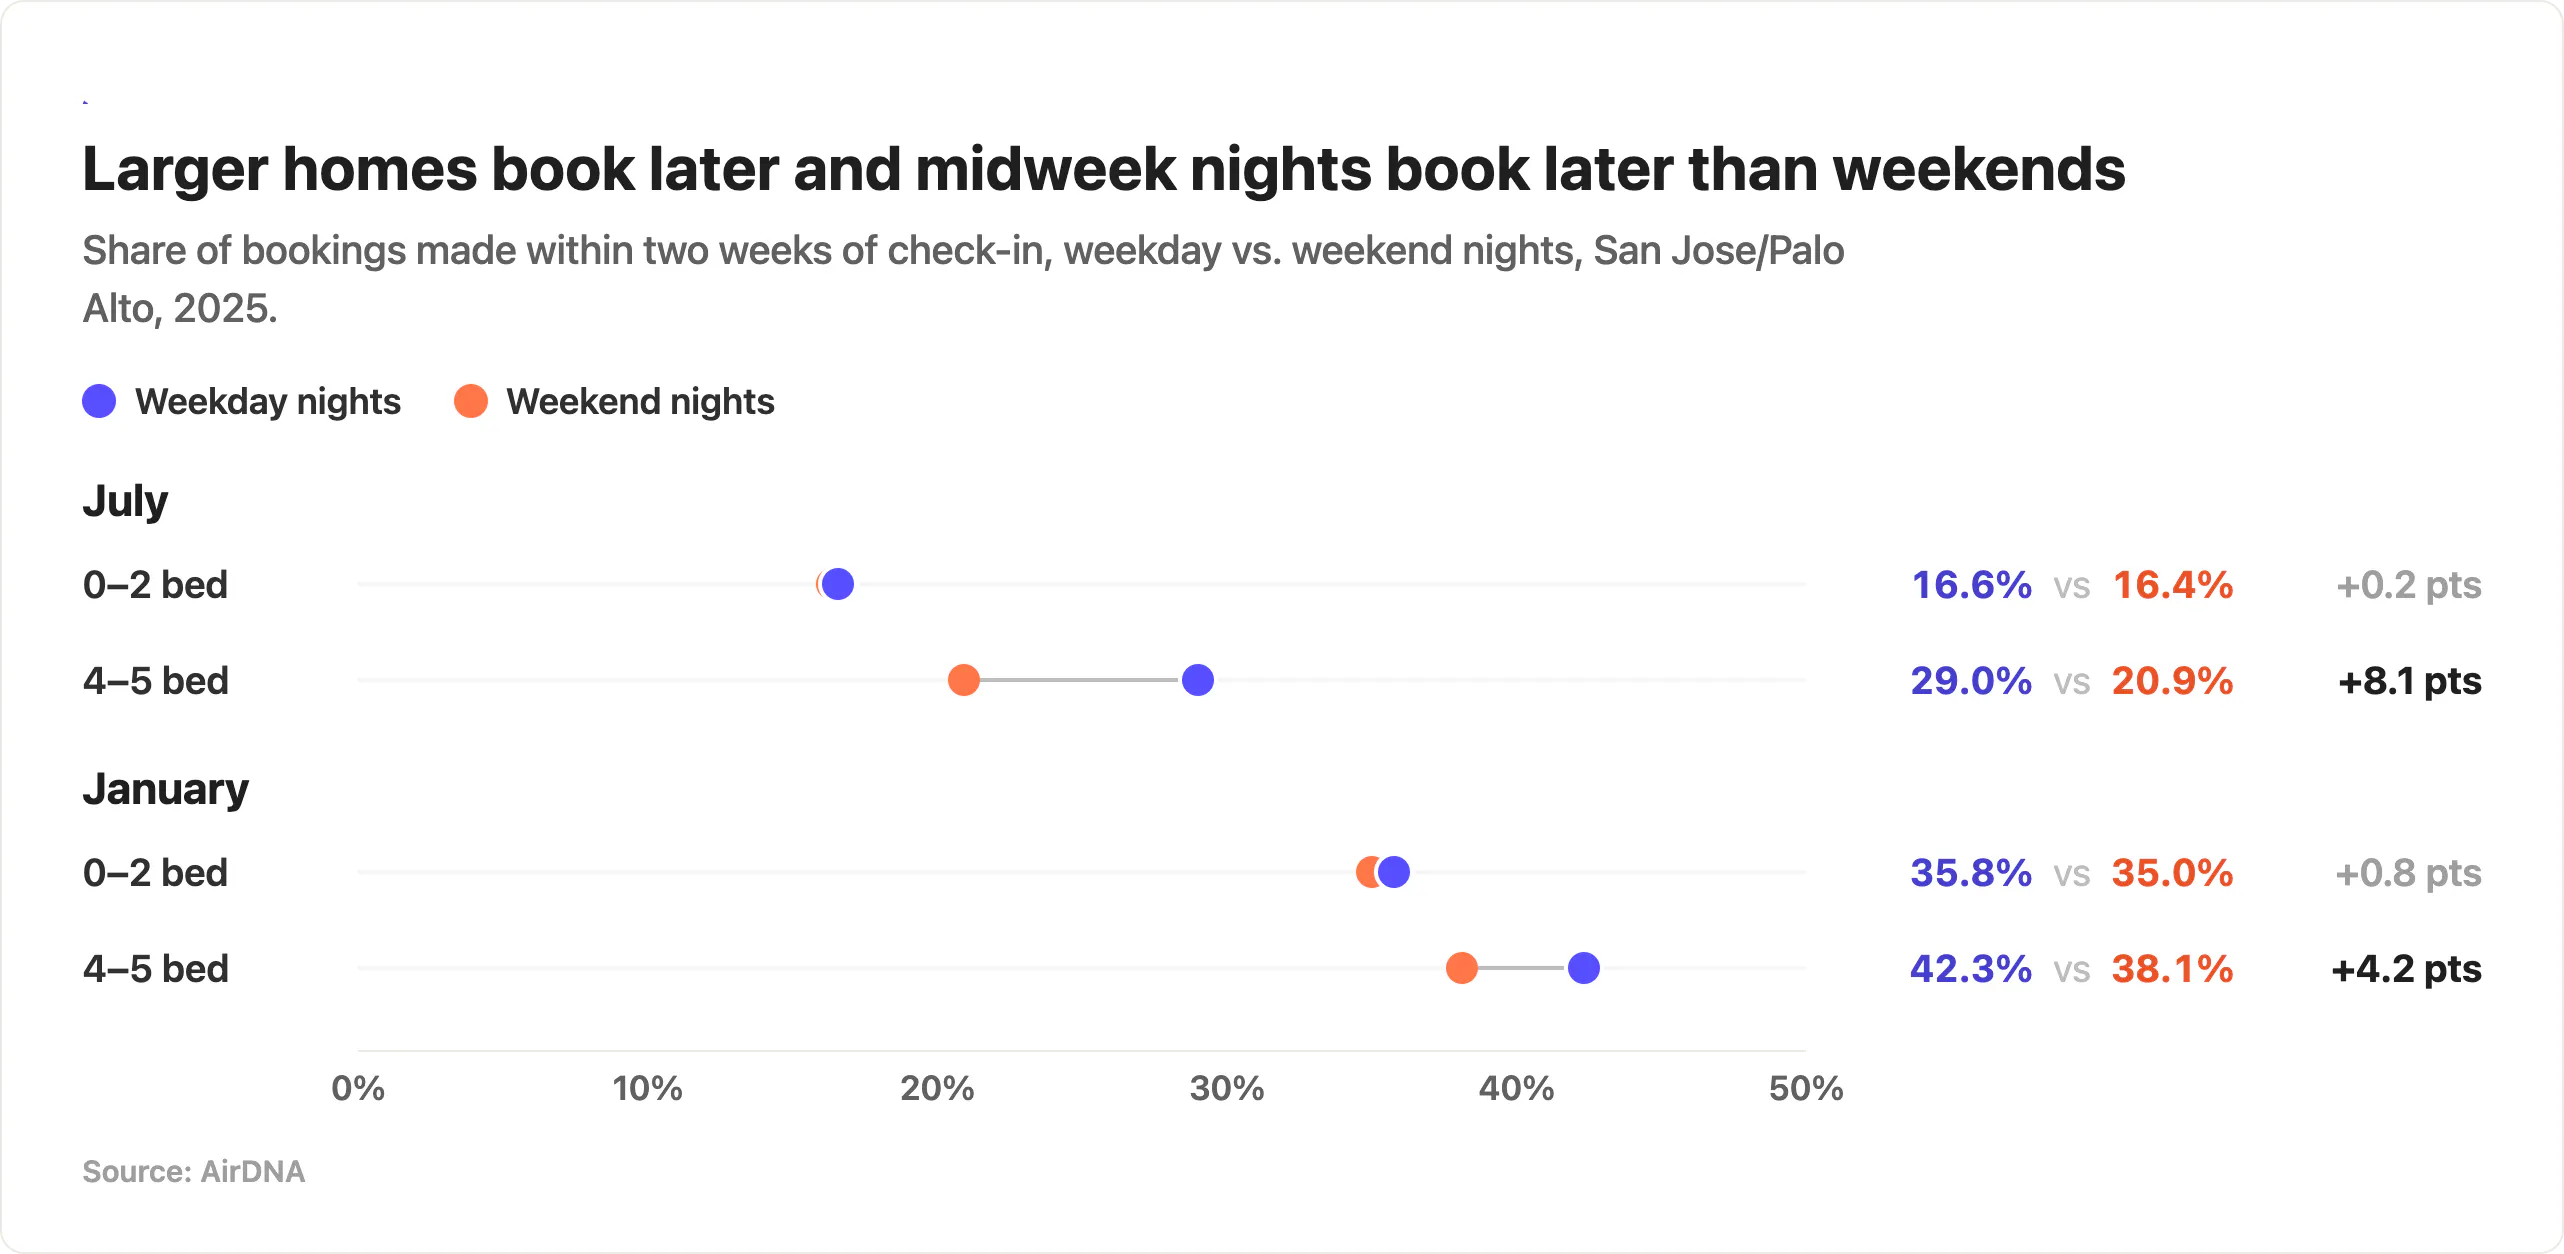
For zero- to two-bedroom properties, the two day types book on effectively the same schedule in peak and low season. In July, 16.6% of weekday stays and 16.4% of weekend stays are booked within two weeks of check-in. In January it's 35.8% and 35.0%.
Large properties are a different story. In July, 29.0% of weekday nights in four- to five-bedroom homes are booked within two weeks of stay, compared with 20.9% of weekend nights, a difference of more than 8 percentage points. In January the gap narrows but the direction holds: 42.3% of weekday nights book within two weeks against 38.1% of weekend nights.
Companies booking for teams, relocations, and families traveling for medical care are the guests in larger San Jose/Palo Alto properties, and that demand is rarely planned far ahead. A team needs a house Monday through Thursday and books it that week. The weekend nights in those same homes come from planned family and group trips, which book on a much more conventional timeline.
For a large home here, the midweek and weekend halves of your calendar need different treatment. Weekends can be priced on a normal planning horizon. Midweek revenue is decided in the final two or three weeks, and it rewards staying competitive right up to check-in.
Holidays and Events Are Their Own Season
Booking timing varies by market, by season, by property size, and by day of week. Holiday and event dates then break the pattern around them, usually by filling much earlier. A single date with fixed, scarce demand, such as a marathon weekend, a festival, or New Year's Eve, can book out months before the ordinary nights on either side of it.
If your market's January is a two-weeks-out market but New Year's Eve books six months out, an open New Year's Eve at 60 days is a very different signal from an open January 12 at 60 days.

Building Your Own Lead Time Calendar
Understanding how far ahead guests book your own property through the year is central to pricing. So where do you start?
Building your own lead time calendar is a good first step. Lead time is the number of days between when a booking is made and when the guest checks in. If you've been operating long enough to have historical booking data, you can calculate it for every reservation on your calendar by subtracting the booking date from the check-in date.
From there you can start asking better questions. What's the typical lead time for weekday reservations versus weekend reservations in each month? What about during holidays and events?
Then look at how those lead times have been changing, both year over year and month to month. Have lead times for your property been increasing or decreasing compared with last year? Have certain months seen a big dip while others went the other way? If you've seen lead times declining in recent months, could it be related to a new pricing strategy you've been trying?
The catch is that your own data can't always tell you why. If your July lead times are shrinking, is that your new pricing strategy or a shift across your whole market? If a week looks soft at 30 days out, is that your rate, or is everyone in the same position? Separating the two takes market data on lead times and occupancy pacing alongside your own.
Let Adapt Do It for You
That's where Adapt comes in. AirDNA's new pricing tool uses market data on lead times and occupancy pacing to adjust your rates for you, on every calendar date, every day.
Blanket lead time rules that move all your rates based on how many days you are from check-in aren't an effective pricing strategy. Dropping prices 15% a month out might work in the summer at a coastal destination, when 75% of expected bookings have already happened, but it's the wrong move in low season, when 40% of bookings happen within a month of stay. Adjusting properly means a different answer for every date on your calendar, by month, by day of week, and around holidays, checked against how your market is pacing this year. That's 365 decisions, and they change every week.
Adapt makes those decisions for you, every day, for every date on your calendar. Dates still early in their booking window are protected: your rate holds, because the guests for that night mostly haven't started looking yet, and discounting into an empty window only means selling the same night for less. As a date moves into its booking window, Adapt starts adjusting with the demand. For dates coming up soon that still aren't booked, it prices to fill, because an empty night earns nothing.
Adapt also looks at how occupancy is shaping up this year versus last. If occupancy among comparable properties is running ahead of last year's curve, Adapt holds your rates longer even when you're past the normal booking window. If those properties are pacing behind, and behind consistently, it moves your price sooner than it otherwise would.
Pricing isn't only a question of how much a night should cost. It's a question of when the guests for that night are deciding, and whether your rate is right at that moment. Adapt keeps it right, on every date, every day, all year.
Track Your Performance Free
Connect your listing and see how it performs against its comp set. Free, no rate syncing required.
Frequently Asked Questions
What is an occupancy curve?
An occupancy curve tracks how a date, or a month of dates, fills up over the year before check-in. It plots what occupancy was six months out, three months out, four weeks out, and so on, climbing from zero to the final occupancy the market reached. The shape shows when bookings actually arrive, and the end point shows how much of the market's inventory ever sells.
What is a booking window?
Your booking window is the stretch of time before check-in when most bookings for a given date come in. If most guests in your market book within 60 days of check-in, that 60-day stretch is your booking window, and it's when your rate decisions matter most.
What is lead time in short-term rentals?
Lead time is the number of days between when a booking is made and when the guest checks in. You can calculate it for any past reservation by subtracting the booking date from the check-in date, which is the basis for building your own lead time calendar.
Should I cut my rates if my calendar is empty 30 days out?
It depends on your market's booking window for those dates. In Breckenridge, Colorado, an open February calendar at 90 days out is a problem because the market is already 36% sold, while an open October calendar at the same point is normal because the market is barely 6% sold. Without knowing where you are in the window, a rate cut is a guess.
Do larger properties always book further in advance?
No. It's true often enough to be a useful starting point, and it holds in Breckenridge and in Hilton Head's December, but San Jose/Palo Alto reverses it in peak season: four- to five-bedroom properties take 40% of July bookings inside 28 days, against 27% for zero- to two-bedroom properties. Check the pattern in your own market rather than assuming it.
Do weekday and weekend nights book on the same timeline?
Not always, and property size decides it. In San Jose/Palo Alto, zero- to two-bedroom properties book weekday and weekend nights on effectively the same schedule, but in four- to five-bedroom homes 29.0% of July weekday nights are booked within two weeks of stay against 20.9% of weekend nights.
How does Adapt use booking timing?
Adapt uses market data on lead times and occupancy pacing to set a rate for every date on your calendar, every day. Dates still early in their booking window hold their rate, dates moving into the window get adjusted with demand, and near-term unbooked dates are priced to fill. It also compares this year's occupancy pacing with last year's, holding rates longer when comparable properties are pacing ahead.
Sync Rates to Your Booking Sites
Set your strategy once, and Adapt pushes updated prices to your listings automatically.
ARTICLE SUMMARY
Occupancy curves show when the guests for a given date actually book, and that timing decides whether a soft calendar calls for a rate cut or for patience. Comparing peak and off-season curves in Breckenridge, Colorado; Hilton Head, South Carolina; and San Jose/Palo Alto, California, the same 30-days-out calendar reads three completely different ways. Booking timing also shifts by property size and by weekday versus weekend, which means market-wide averages often won't describe your own booking window.
Linda Rollins
Senior Research Analyst
Linda Rollins is a Senior Research Analyst at AirDNA and a self-managing short-term rental host, which means she understands the market as both an analyst and an operator. She writes research and blogs for AirDNA and for Adapt, its revenue management tool, making her work a go-to resource for investors trying to find and size up the right opportunities, and for operators looking to understand changing market dynamics and find concrete ways to improve occupancy, rates, and guest experience. Her data is regularly cited in major news outlets, and she has a knack for bringing both the numbers and the story behind them. In her free time, Linda enjoys spending time with her family, traveling, and looking for good eats.
