

 Calculate Revenue
 Research Markets
 Find For Sale Properties
 Compare My Listing
 STR Revenue Calculator
 Custom Comp Sets
 Submarket Insights
 Custom Search Filters
 Rate Recommendations
 Performance Benchmarking
 Competitor Comparison
 Owner Contact Details
 Property-level performance data
 Tourism Insights
 Real Estate Investment Analytics
 About Us
 Sales
 Support
 Press
U.S. Review June 2026: World Cup Demand Drives a Stronger Summer
Published: July 17, 2026

Bram Gallagher
Key Takeaways:
- RevPAR rose 4.5% in June as World Cup host cities drove strong pricing gains, with ADR continuing to outperform inflation.
- Higher mortgage rates are slowing new supply, creating a more favorable occupancy outlook for the second half of 2026.
- Labor Day and the start of the college football season are giving fall demand an early boost, supporting strong pacing into the shoulder season.
Inflation, war, and politics couldn't dim the world's appetite for world-class football, and World Cup host cities across the U.S. capitalized in June. RevPAR rose 4.5% year over year, driven almost entirely by a 4.6% increase in ADR compared with June 2025. While the biggest rate gains were concentrated in host cities, every location type recorded ADR growth of at least 2%. The Repeat Rent Index (RRI), which measures pricing among existing operators, rose even faster at 6.8%, highlighting the pricing power that comes with an established review history.
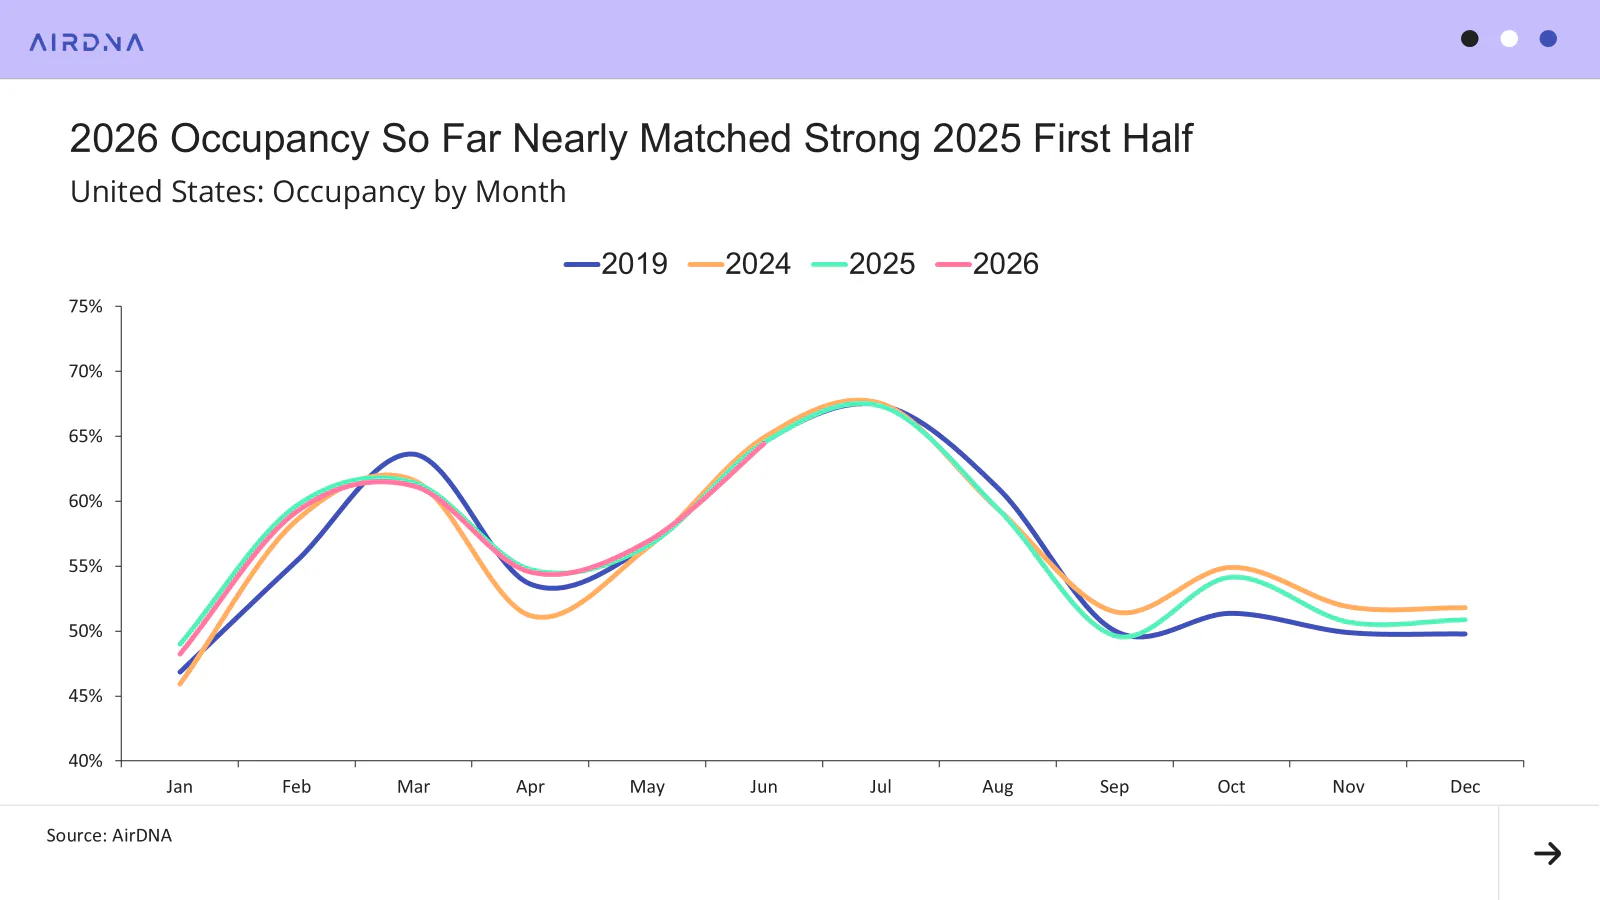
Occupancy was essentially unchanged, down just 0.1% from last year, leaving the market broadly in line with 2025's strong first-half performance. Looking ahead, easier year-over-year comparisons, slowing supply growth, and, knock on wood, stabilizing inflation should support stronger unit-level performance through the second half of the year. Risks remain, particularly if energy prices spike again, but the summer outlook remains encouraging. Looking further ahead, Labor Day and the return of college football are already giving demand pacing a boost across many host markets.
At a Glance: Key U.S. STR Performance Metrics for June 2026
- Revenue per Available Rental (RevPAR) increased 4.5% year-over-year (YoY) to $200.19.
- Available listings reached 1.79 million, a 1.7% increase YoY
- Demand nights were up 1.9%
- Occupancy averaged 64.4%, down 0.1% YoY
- Average Daily Rates (ADR) climbed to $310.64, up 4.6% from last year
- The Repeat Rent Index (RRI) rose 6.8% YoY
- Total nights booked were up 2.5% from 2025
Economic Outlook
Bad news is good news again, as markets responded to a weaker-than-expected jobs report with renewed hope for Fed rate relief. The U.S. added 57,000 jobs in June, well below May's revised total of 129,000. Although the unemployment rate edged down from 4.3% to 4.2%, that was largely because the labor force participation rate fell to 61.5%, its lowest level since the pandemic and, before that, 1976.
The June report followed three months of stronger labor market performance that had led many economists to question whether the Fed could shift its focus away from inflation. While market consensus, unlike Oxford Economics, still expects a rate hike to be more likely than a cut this year, June's weaker jobs data has brought those odds much closer to even.
Even so, with immigration remaining very low, fewer new jobs are needed to maintain full employment, and the labor market continues to look broadly stable. Inflation, meanwhile, continues to accelerate. The Personal Consumption Expenditures (PCE) Price Index rose 4.1% year over year in May, up from 3.8% in April. Excluding food and energy, which have been disproportionately affected by the war in Iran, core PCE increased 3.4%, up from 3.3% in April and still well above the Fed's 2% target.
Higher Interest Rates Weighing on Available Listing Growth
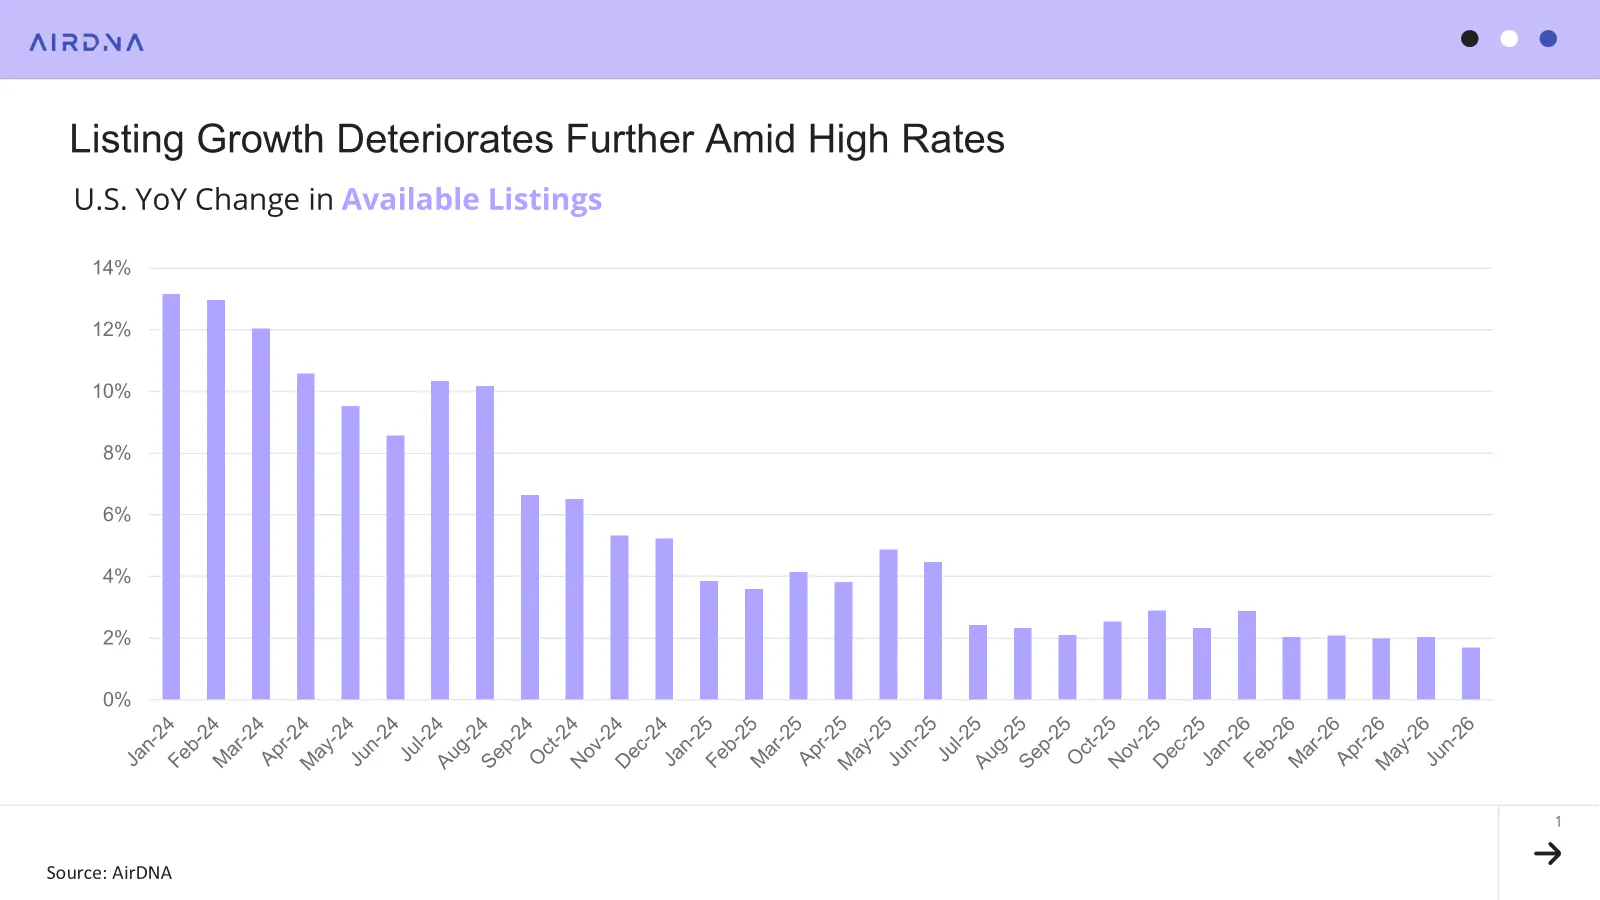
After briefly dipping below 6% in February, mortgage rates climbed in response to the shipping crisis in the Strait of Hormuz. Although rates eased slightly in June, they remained elevated at 6.43% as of July 2. With home prices expected to stay firm, borrowing remains expensive and housing transactions subdued. As a result, the anticipated surge in new short-term rental listings has failed to materialize, with available listing growth slowing to 1.7% in June, the first time it has fallen below 2% since the pandemic.
The relationship between mortgage rates and new listing growth remains striking. New listings show a strong negative correlation with mortgage rates on a six-month lag, likely reflecting the time between identifying an investment opportunity and bringing a property to market. Across the full period from January 2021 to June 2026, the correlation is -0.68, strengthening to -0.93 since June 2022. The relationship is just as clear when viewed visually.
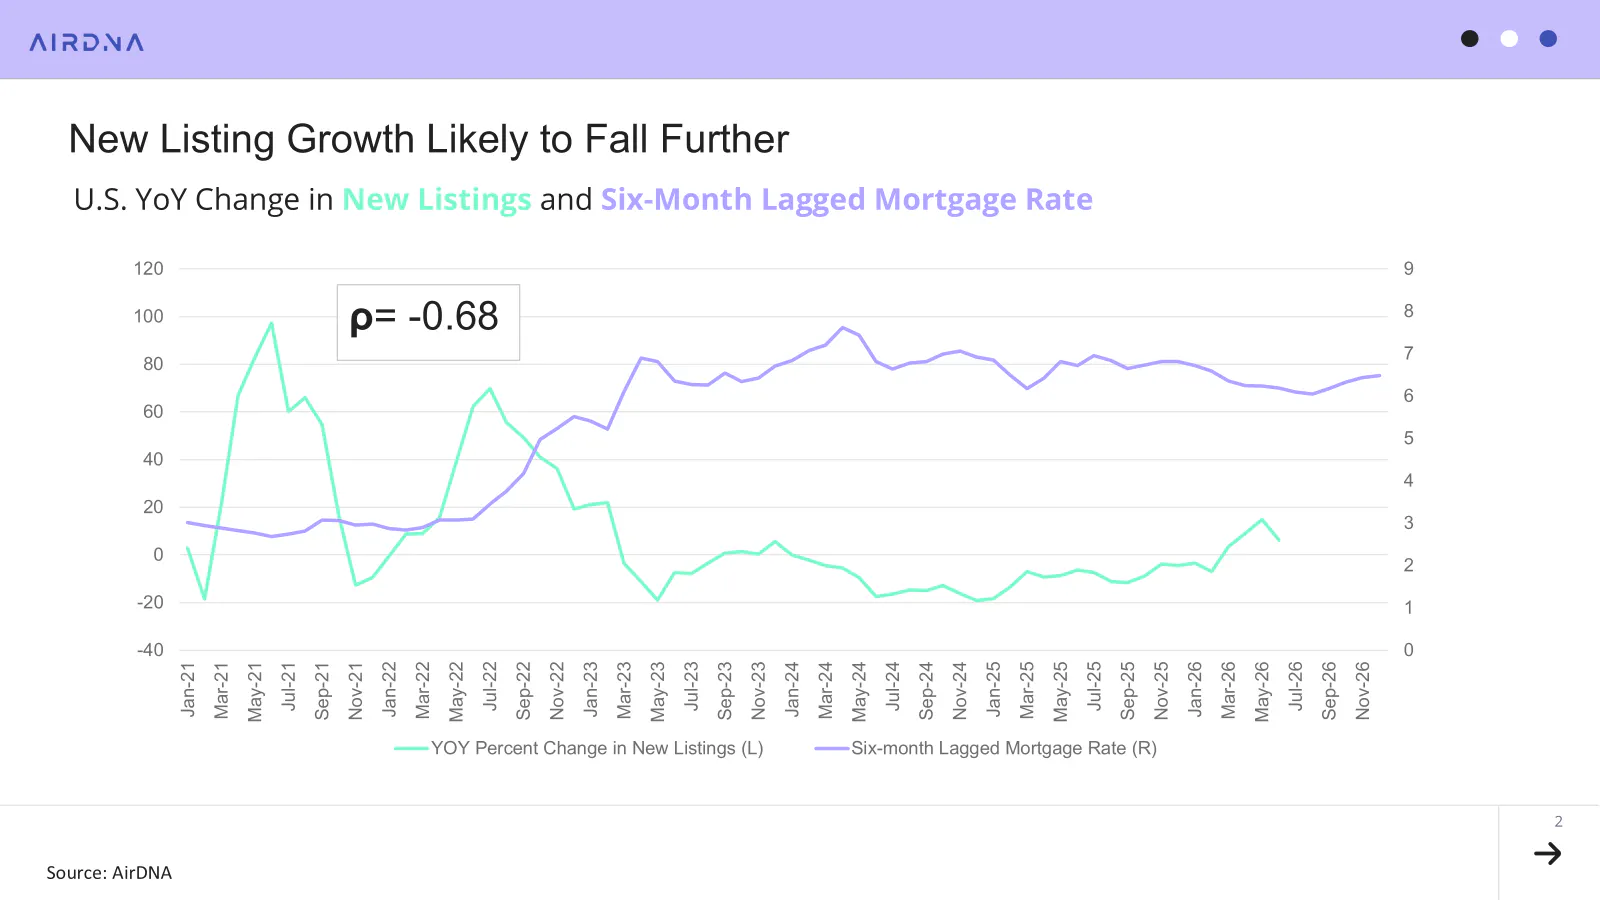
Current growth in new listings is likely a delayed response to the nearly 80-basis-point decline in mortgage rates between June 2025 (6.82%) and February 2026 (6.05%). Since then, rates have climbed back to 6.49%, which should continue to weigh on new listing growth through the rest of the year.
There is one offsetting factor. Available listing growth slowed sharply in July 2025, falling from 4.5% in June to 2.4%, creating easier year-over-year comparisons for the second half of 2026. Those easier comps should help support listing growth even as higher mortgage rates continue to weigh on underlying market fundamentals.
Demand Is Building Into the Second Half
Demand grew 1.9% in June, its fastest pace since October 2025. Booking growth also remained strong at 3.8%, virtually unchanged from May (3.9%). Throughout 2026, bookings have consistently outpaced realized demand, suggesting further demand growth as those future reservations convert into stays.
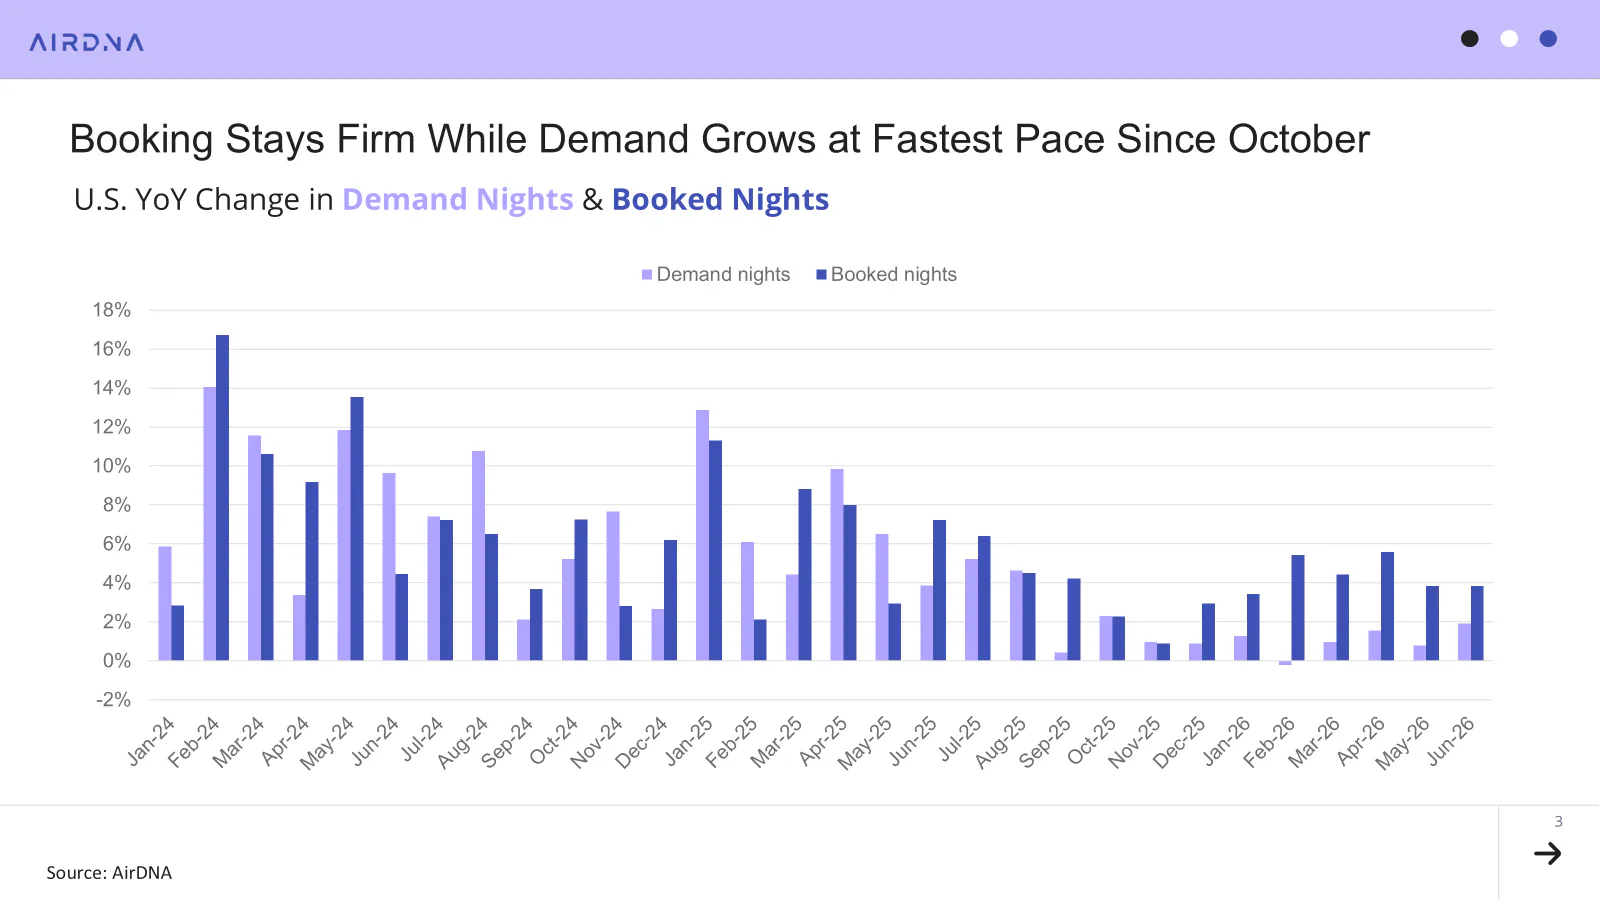
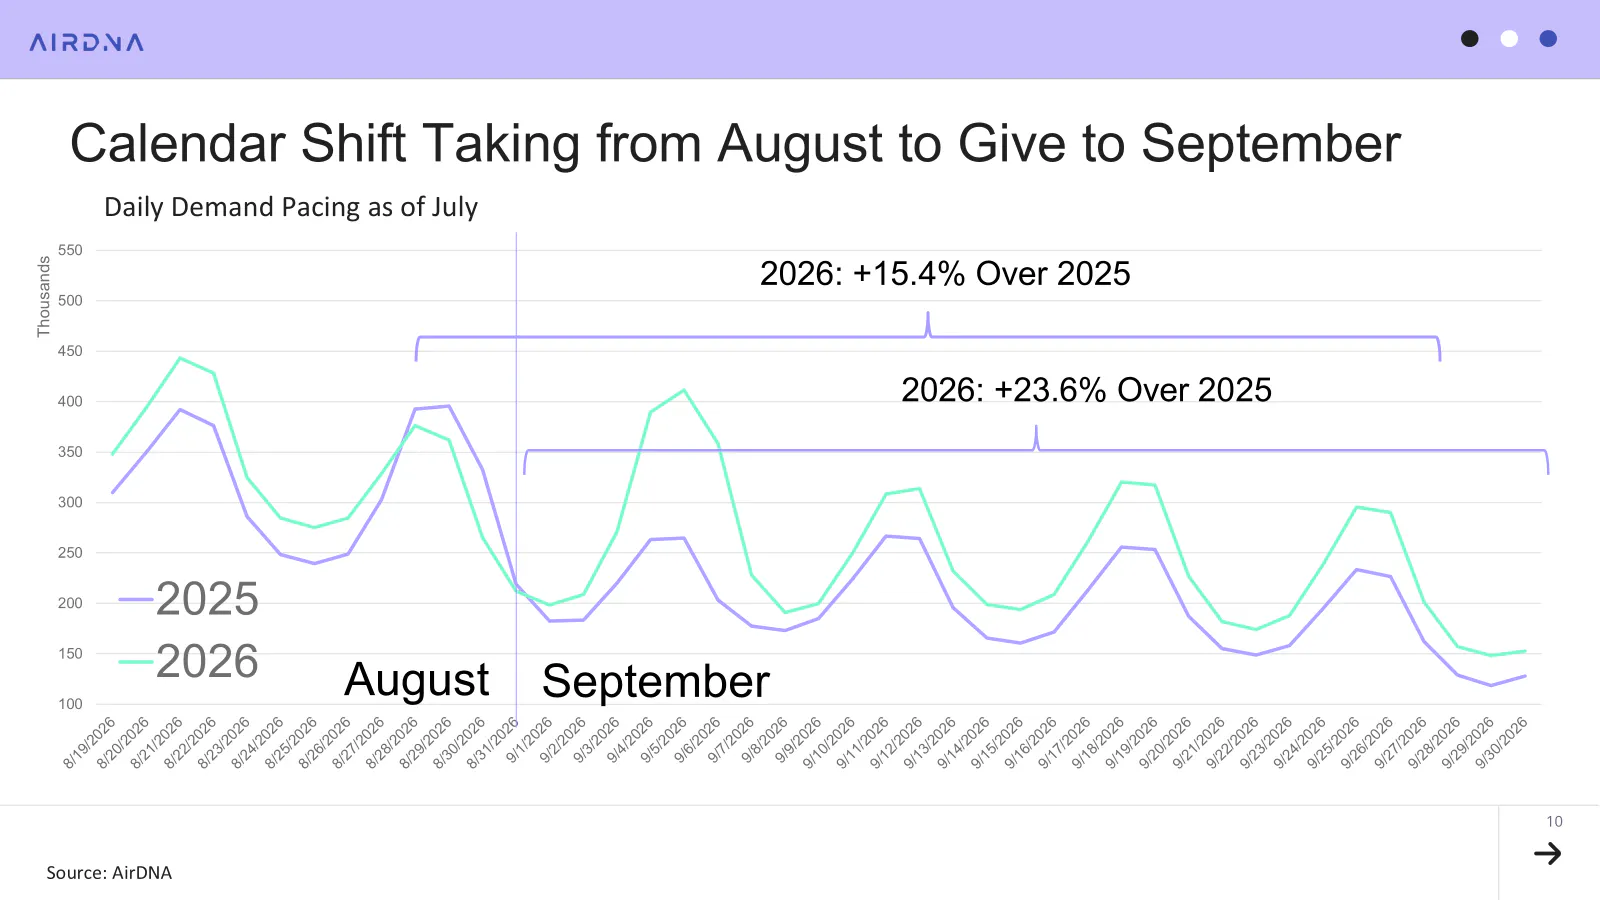
Looking ahead, demand pacing remains encouraging, particularly through the shoulder season. Some caution is warranted, however, as part of that strength reflects easier year-over-year comparisons. September, in particular, faces a weak comparison after Labor Day shifted into August last year, making this year's September appear stronger at August's expense.
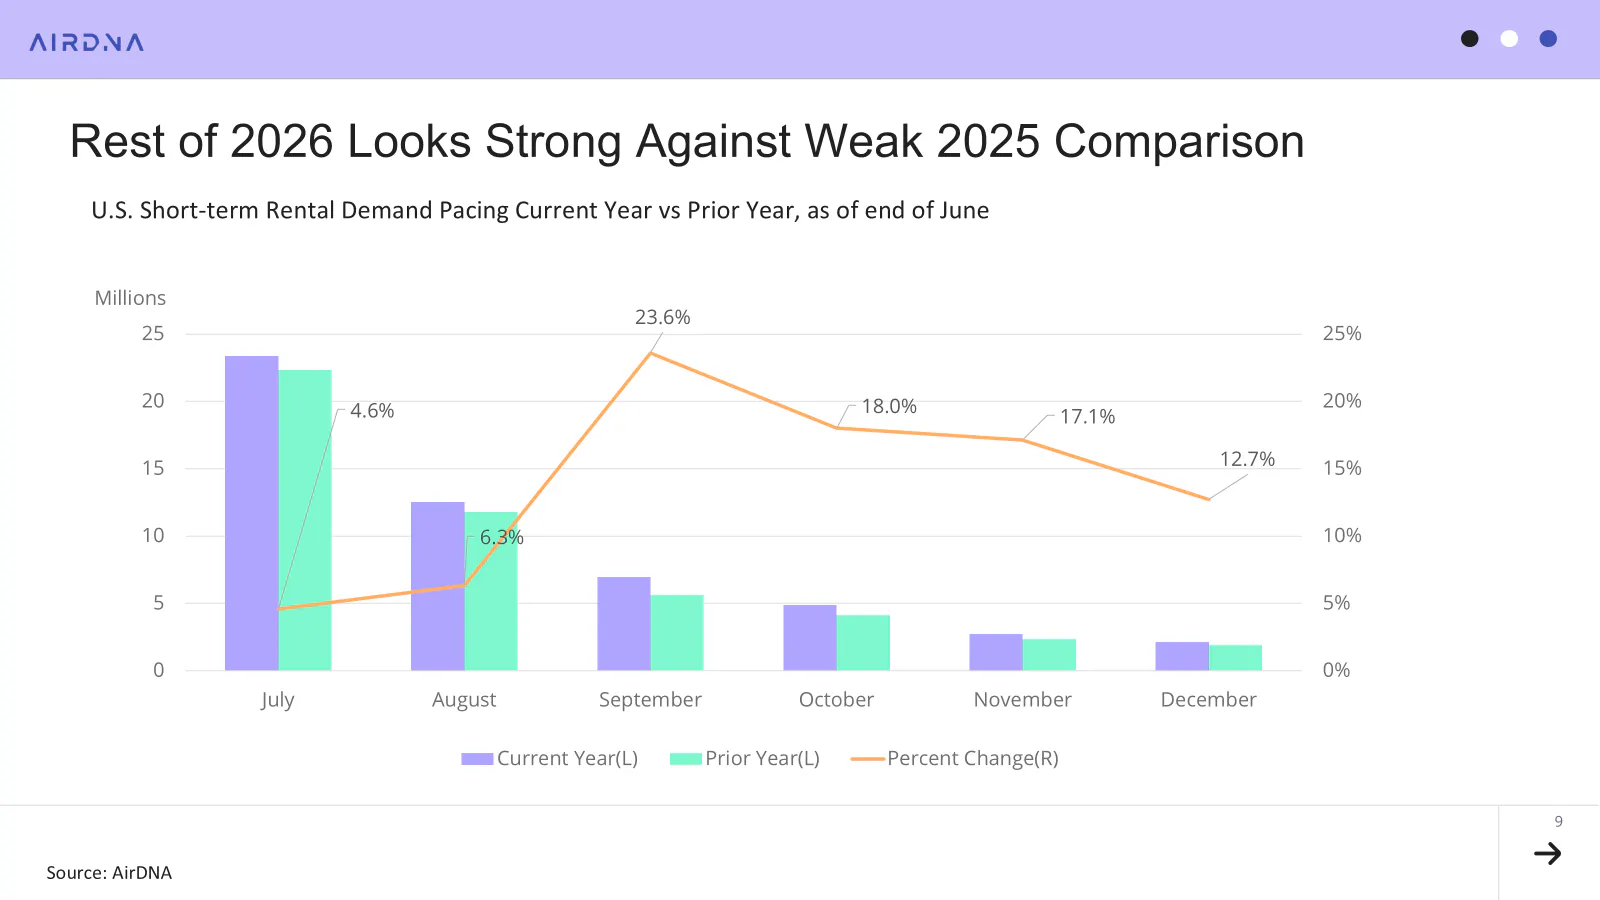
Even so, those easier comparisons should help support occupancy through the second half of the year. So far, 2026 has closely mirrored 2025, with year-to-date occupancy down just 0.4%. Because the first half of 2025 was the stronger period, the comparisons become more favorable from here. Combined with slower supply growth, AirDNA expects occupancy to finish the year slightly ahead of 2025.
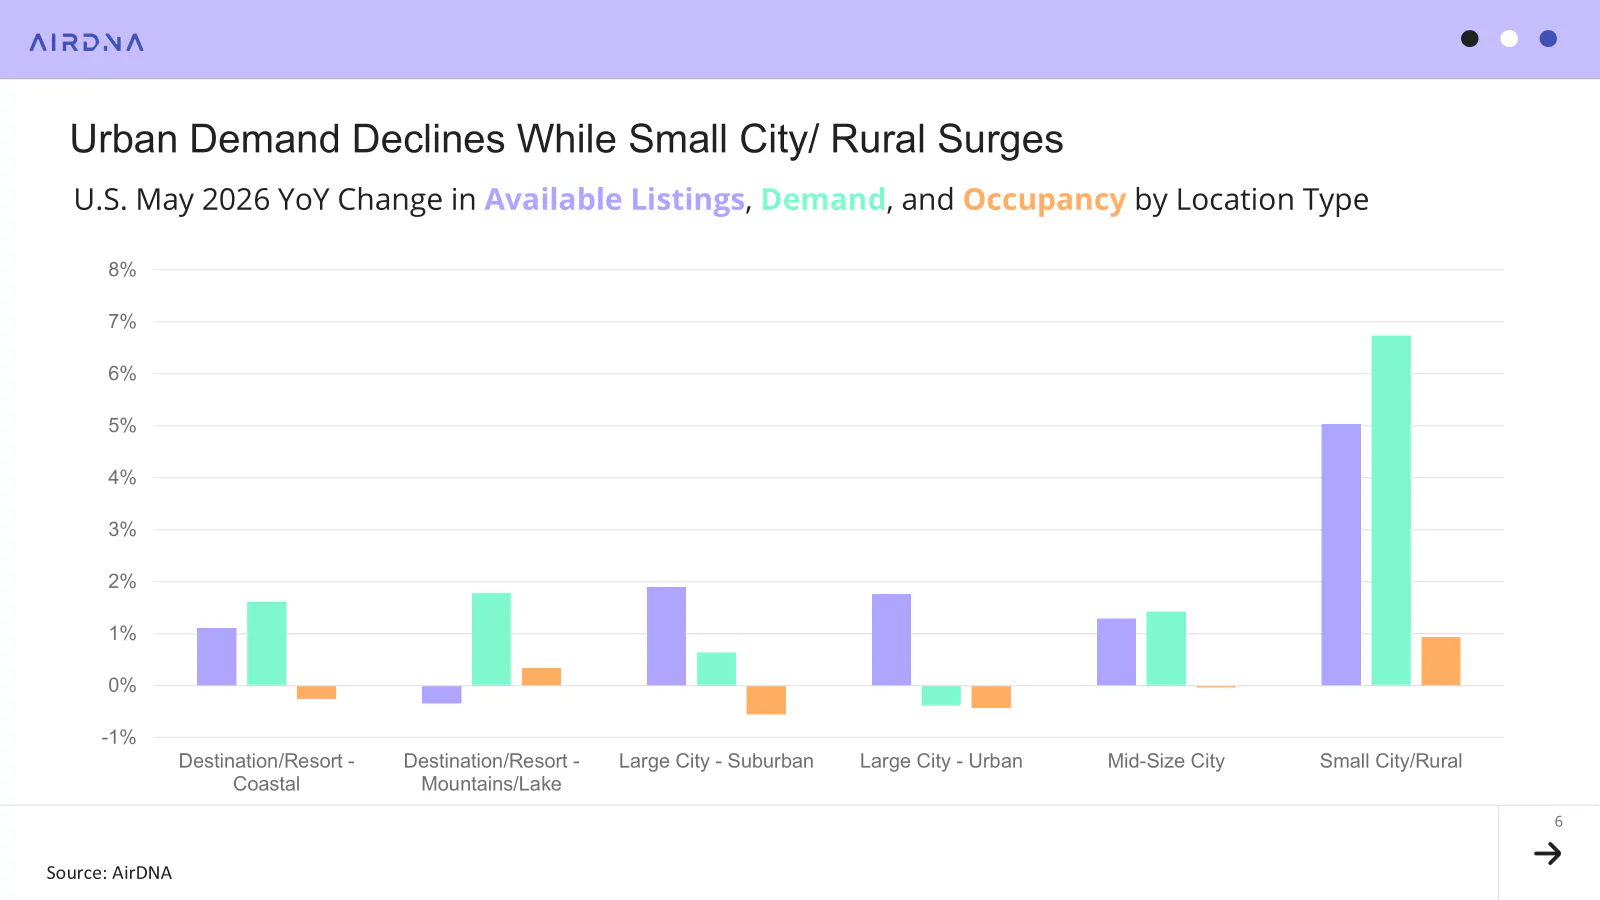
It would be tempting to attribute June's stronger demand entirely to the World Cup, but the data suggest a broader story. Urban markets, despite hosting the tournament, were the only location type to record lower demand than last year (-0.4%).
Instead, the strongest performance came from small city and rural markets, where demand increased 6.7%. Continued supply growth has helped these markets accommodate rising demand, while occupancy still increased 0.9%, showing that demand outpaced even the additional capacity. Mountain and lake resorts also posted a modest occupancy gain (+0.3%) as available listings declined (-0.3%), while occupancy in mid-sized cities remained broadly unchanged.
Pricing Power Remains Strong
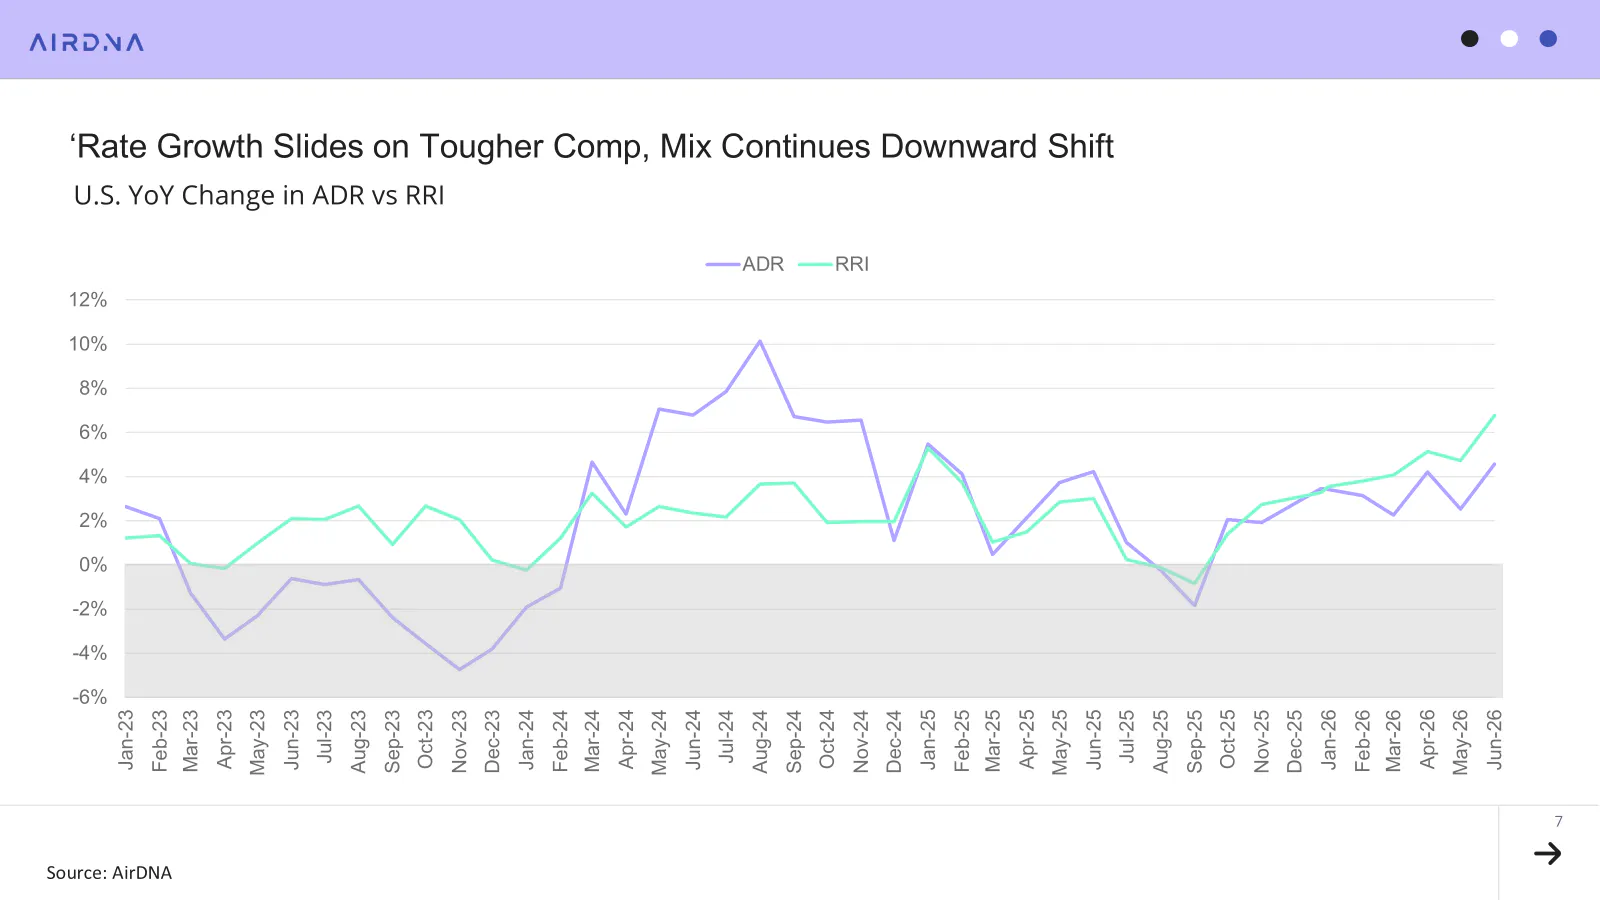
Demand and occupancy have remained broadly flat through the first half of 2026, but ADR has continued to strengthen. In June, ADR rose 4.6% year over year, comfortably outpacing inflation. The AirDNA Repeat Rent Index (RRI), which removes the effect of mix shift and measures pricing changes among existing operators, grew even faster at 6.8%. The gap between the two suggests newer listings continue to enter the market at lower price points, pulling overall ADR below the rates achieved by established hosts.
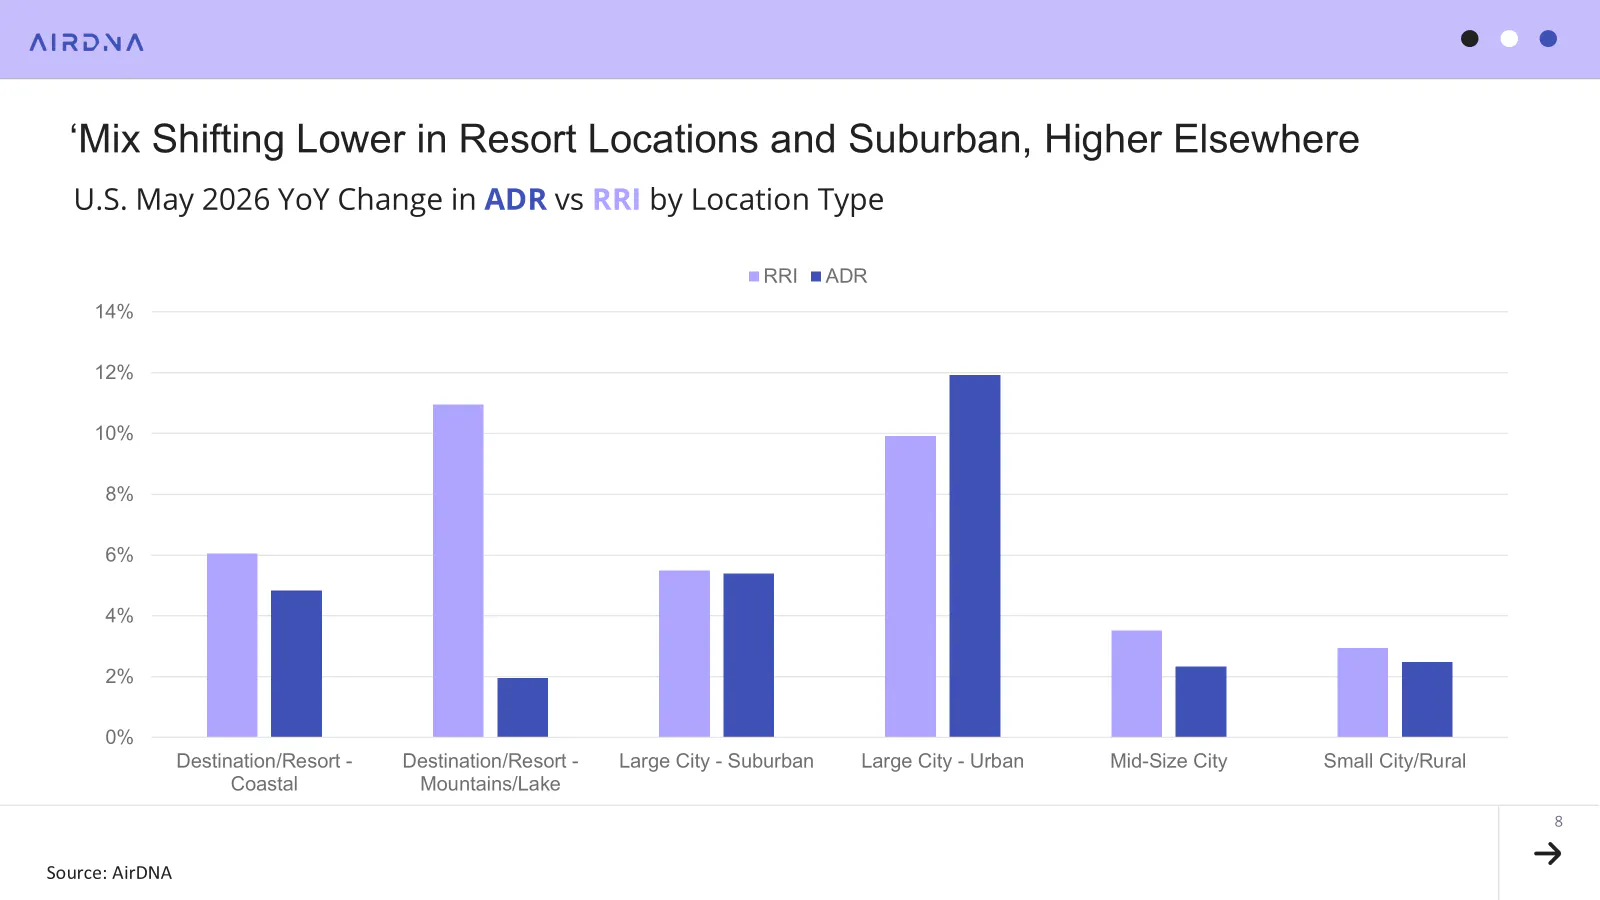
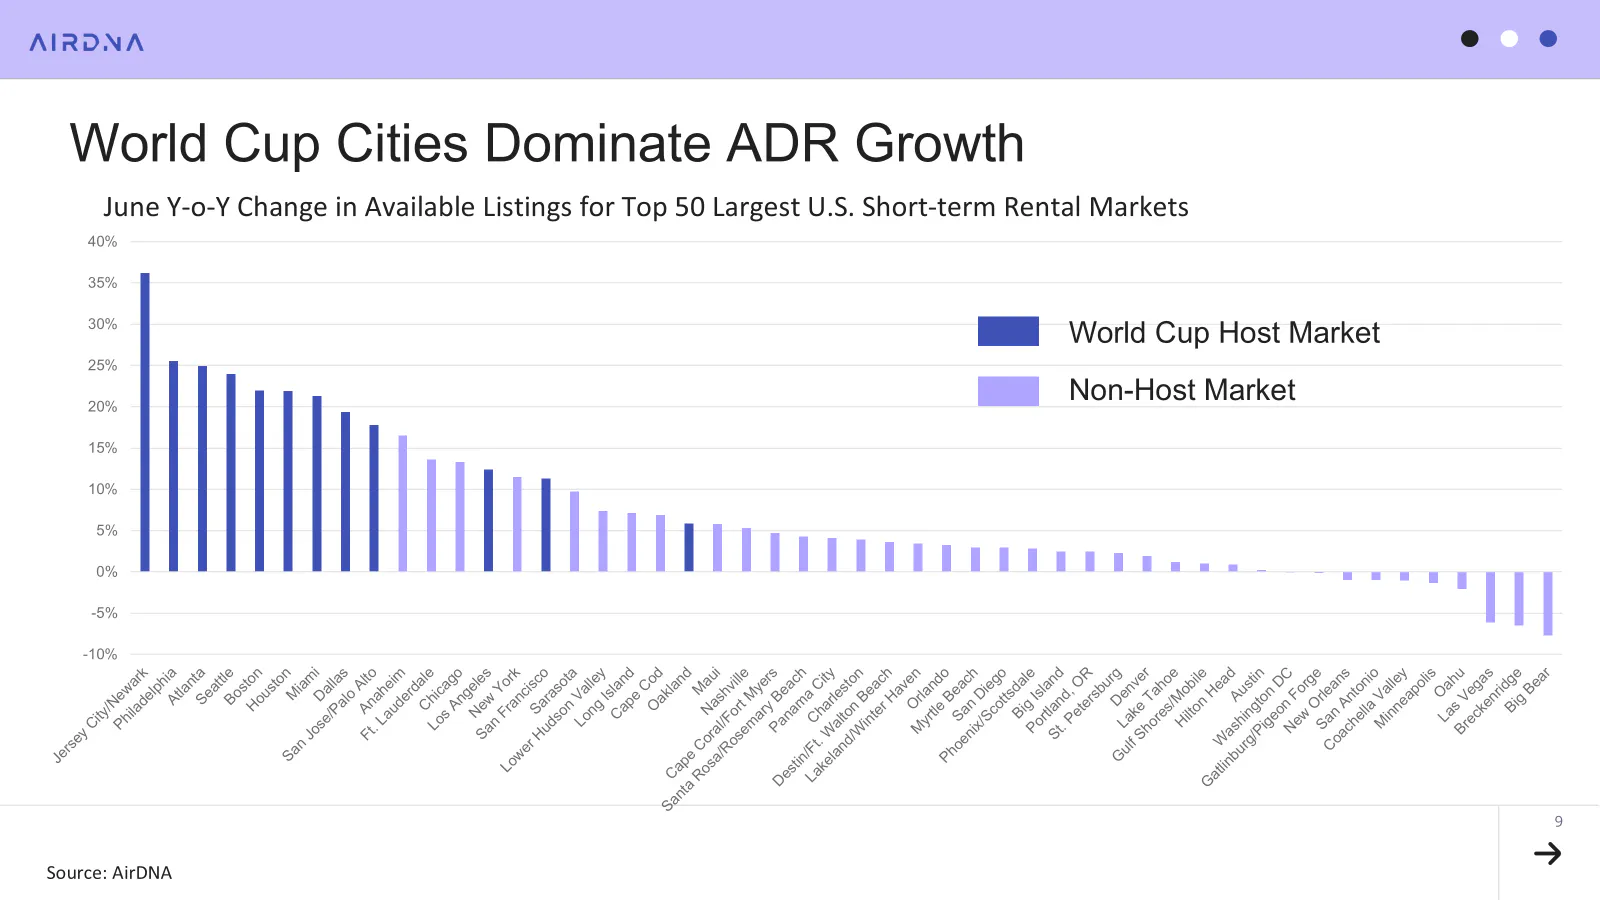
The World Cup was clearly part of the story. Host cities saw much stronger ADR gains than demand gains, making Large City Urban (+11.9%) and Suburban (+5.4%) the fastest-growing location types for rate. Mountain/Lake destinations told a different story, recording the strongest RRI growth (+11.0%) but the weakest ADR growth (+2.0%), a clear sign of significant mix shift within those markets.
The market rankings reinforce the World Cup's impact. The top nine markets for ADR growth were all host cities, and none of the host markets recorded declining ADR in June. By contrast, the largest declines came in Breckenridge and Big Bear, two ski destinations still recovering from this year's severe snow drought.
Labor Day Gives September a Lift
The calendar is giving September an extra boost this year. In 2025, Labor Day weekend fell between August 29 and 31. This year, the holiday shifts six days later, moving the entire weekend into September. As a result, September pacing appears much stronger at the expense of August, although both months continue to look healthy heading into the shoulder season.
The calendar effect is significant. When the pacing window is shifted by three days so the two Labor Day weekends are compared directly, September demand pacing falls from +23.6% to +15.4%. Most of the apparent gain therefore comes after the holiday weekend itself. Comparing Labor Day weekends directly, demand pacing is a more modest but still healthy +3.4%.
Several markets are also benefiting from the start of the college football season. Alabama's home opener against East Carolina on September 5 is driving more than seven times the demand seen over last year's Labor Day weekend in Tuscaloosa. LSU's matchup against Clemson and Wisconsin's game against Notre Dame are also expected to more than double demand in their respective markets.
| Market | Demand Pacing YoY Change |
|---|---|
| Tuscaloosa | 638% |
| Baton Rouge | 466% |
| Green Bay | 240% |
| South Bend | 89% |
| State College | 47% |
| Eugene | 43% |
| Birmingham | 43% |
| Baltimore | 43% |
| El Paso | 42% |
| Bloomington | 39% |
ARTICLE SUMMARY
The U.S. short-term rental market gained momentum in June as World Cup host cities drove strong pricing growth. Discover the trends shaping supply, demand, and performance through the rest of summer and into the fall.
Bram Gallagher
AirDNA Director of Economics and Forecasting
Bram Gallagher is an Economist at AirDNA, specializing in uncovering insights that drive smarter short-term rental decisions. He put his Ph.D. in Economics from the University of Georgia to work researching and forecasting hotel data with CBRE prior to joining AirDNA, as well as teaching economics at a number of universities. In his spare time, Bram enjoys making wooden furniture with hand tools.


