

 Calculate Revenue
 Research Markets
 Find For Sale Properties
 Compare My Listing
 STR Revenue Calculator
 Custom Comp Sets
 Submarket Insights
 Custom Search Filters
 Rate Recommendations
 Performance Benchmarking
 Competitor Comparison
 Owner Contact Details
 Property-level performance data
 Tourism Insights
 Real Estate Investment Analytics
 About Us
 Sales
Sales Support
 Press
PressU.S. 2026 and 2027 Outlook Midyear Update: A Better Year to Own Than to Buy
Published: July 8, 2026

Bram Gallagher
2026 hasn't unfolded according to the script.
At the start of the year, we expected falling interest rates, stronger supply growth, and a solid year for demand. The year had other plans. The conflict in Iran and the energy shock that followed kept inflation and borrowing costs higher than expected, nudging travelers toward value-focused, drive-to destinations and reshaping where the strongest opportunities lie.
Yet the short-term rental market has remained remarkably resilient. Americans continue to prioritize travel, and the wave of new listings we expected never materialized. That slower supply growth has helped occupancy hold above pre-pandemic levels and given existing hosts more pricing power than they had a year ago.
The result is a market that looks different than we expected, but stronger in many ways. The biggest opportunities aren't evenly distributed. Markets with constrained supply continue to outperform, while destinations adding listings faster than demand are losing ground.
The path points up. As inflation eases and the energy shock fades, we expect demand, occupancy, and pricing to strengthen through 2027. Until then, 2026 remains a better year to own than to buy.
At a Glance: U.S. Midyear STR Outlook (2026–2027)
- Occupancy has remained resilient as new supply growth slowed more than expected.
- Average Daily Rates (ADR) and Revenue per Available Rental (RevPAR) continue to outperform expectations, supported by stronger pricing power.
- Mortgage rates are expected to remain above 6%, keeping new listing growth subdued through 2027.
- Demand is expected to soften through the remainder of 2026 before recovering in 2027 as inflation eases.
- Smaller cities, rural markets, and regional drive-to destinations are expected to outperform as travelers continue to prioritize value.
- Established hosts are benefiting from stronger pricing power, while higher borrowing costs continue to slow new investment.

The First Half Played Out Better Than Expected
We called 2025 a "year of two halves," with a strong start followed by a softer second half. So far, 2026 has delivered the opposite surprise. Despite a tougher economic backdrop than anyone expected, the short-term rental market has remained remarkably resilient.
Momentum has continued to build heading into summer. RevPAR (revenue per available rental) growth improved from around 0.7% year over year in January to roughly 3% in both April and May, while occupancy turned positive in May for the first time this year, rising 0.5% year over year. With easier comparisons ahead, the second half of the year looks well positioned to remain resilient.
Pricing has also surprised to the upside. Both average daily rates (ADR) and AirDNA's Repeat Rent Index (RRI), which tracks pricing for the same listings over time, have continued to rise as hosts respond to higher costs. The fact that RRI is growing faster than ADR suggests established hosts have been better able to recover those costs than the market as a whole.
The housing market tells a different story. Mortgage rates briefly dipped below 6% in February before climbing again after the conflict in Iran began, preventing the spring buying season many hosts had anticipated. The result is fewer new listings than expected, a better year to own than to buy, and a more favorable supply outlook for existing hosts.
Boost Your Rental Revenue
AirDNA’s vacation rental pricing tool uses data-driven recommendations to propose the best daily rates.
The Path Still Points Up
The broad outlook remains intact, even if the route has changed.
Higher mortgage rates are expected to keep supply growth below earlier expectations through 2026, with most new listings concentrated in lower-cost markets such as small cities, rural destinations, and mid-size markets. As rates ease, supply should begin to recover in 2027.
Demand is expected to remain under pressure through the rest of 2026 as inflation and slower income growth weigh on consumer spending. As those pressures fade, demand, occupancy, and pricing should all strengthen into 2027.
The biggest uncertainty remains the broader geopolitical and economic backdrop. Our base case assumes the ceasefire in Iran holds and energy markets continue to stabilize. The biggest downside risk is renewed disruption to global energy supplies. Another wildcard is AI, which could reshape the labor market and, if accompanied by a correction in equity markets, weaken higher-end leisure travel.
The 2026 FIFA World Cup is already reshaping travel patterns, although its impact has been uneven. Mexico's host cities and U.S. markets such as Miami, Florida, and the San Francisco Bay Area, California, are seeing strong demand, while several major host cities, including New York City, New York; Los Angeles, California; Seattle, Washington; and Chicago, Illinois, are seeing flatter growth. Even so, most host markets are benefiting from stronger pricing power, supported by resilient domestic travel and a weaker U.S. dollar.

How We Forecast STR Market Performance
AirDNA's forecasts are generated by a data model that weights a wide range of economic inputs, including income, GDP, employment, the STR Premium, home construction, inflation, the calendar, and major events. Our research team then reviews and adjusts the results to account for factors a model can't easily capture, such as new regulatory changes or shifts in investor sentiment. The result is our best read on where the market is headed.
At the end of 2025, we expected tariffs to give inflation only a short-lived bump, falling interest rates to spur more supply, and tax refunds to push demand growth above 4% in 2026. The year had other plans. The conflict in Iran and the energy shock that followed reignited inflation and pushed long-term interest rates, including mortgage rates, higher than expected.
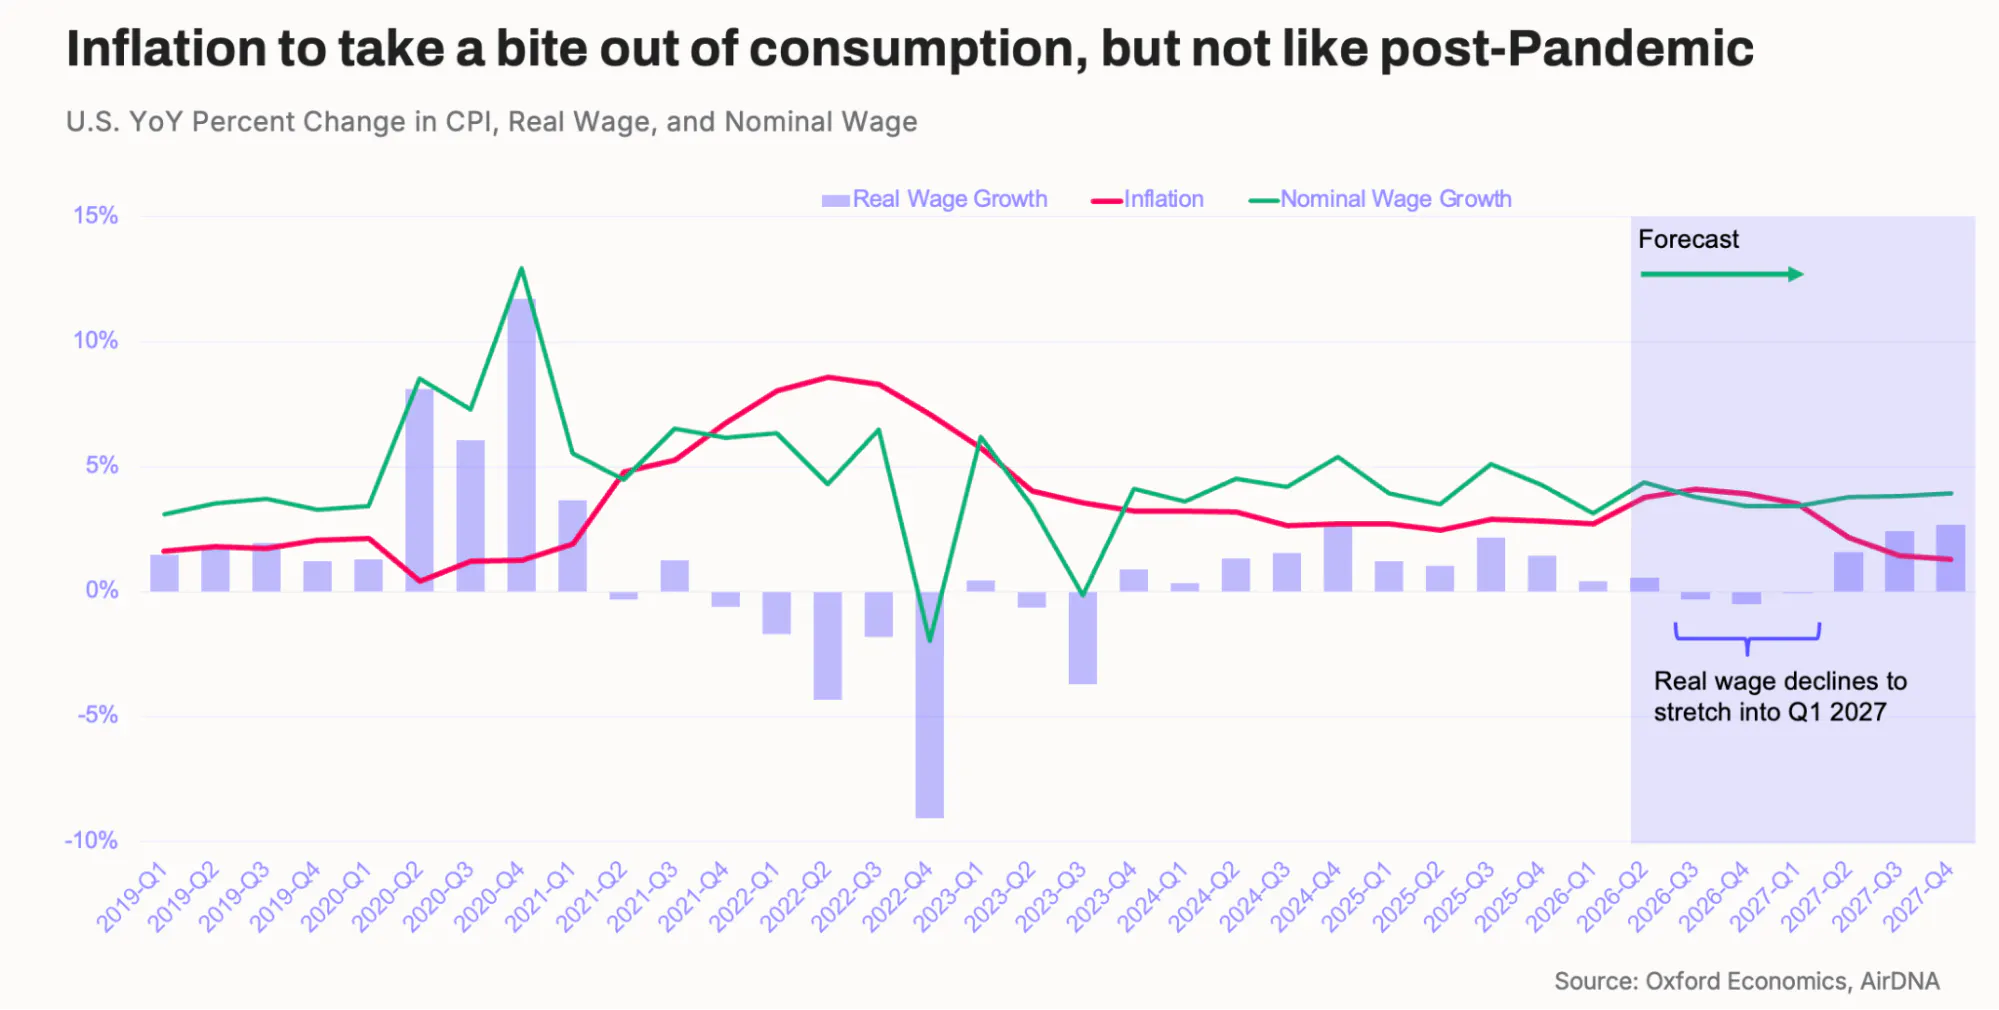
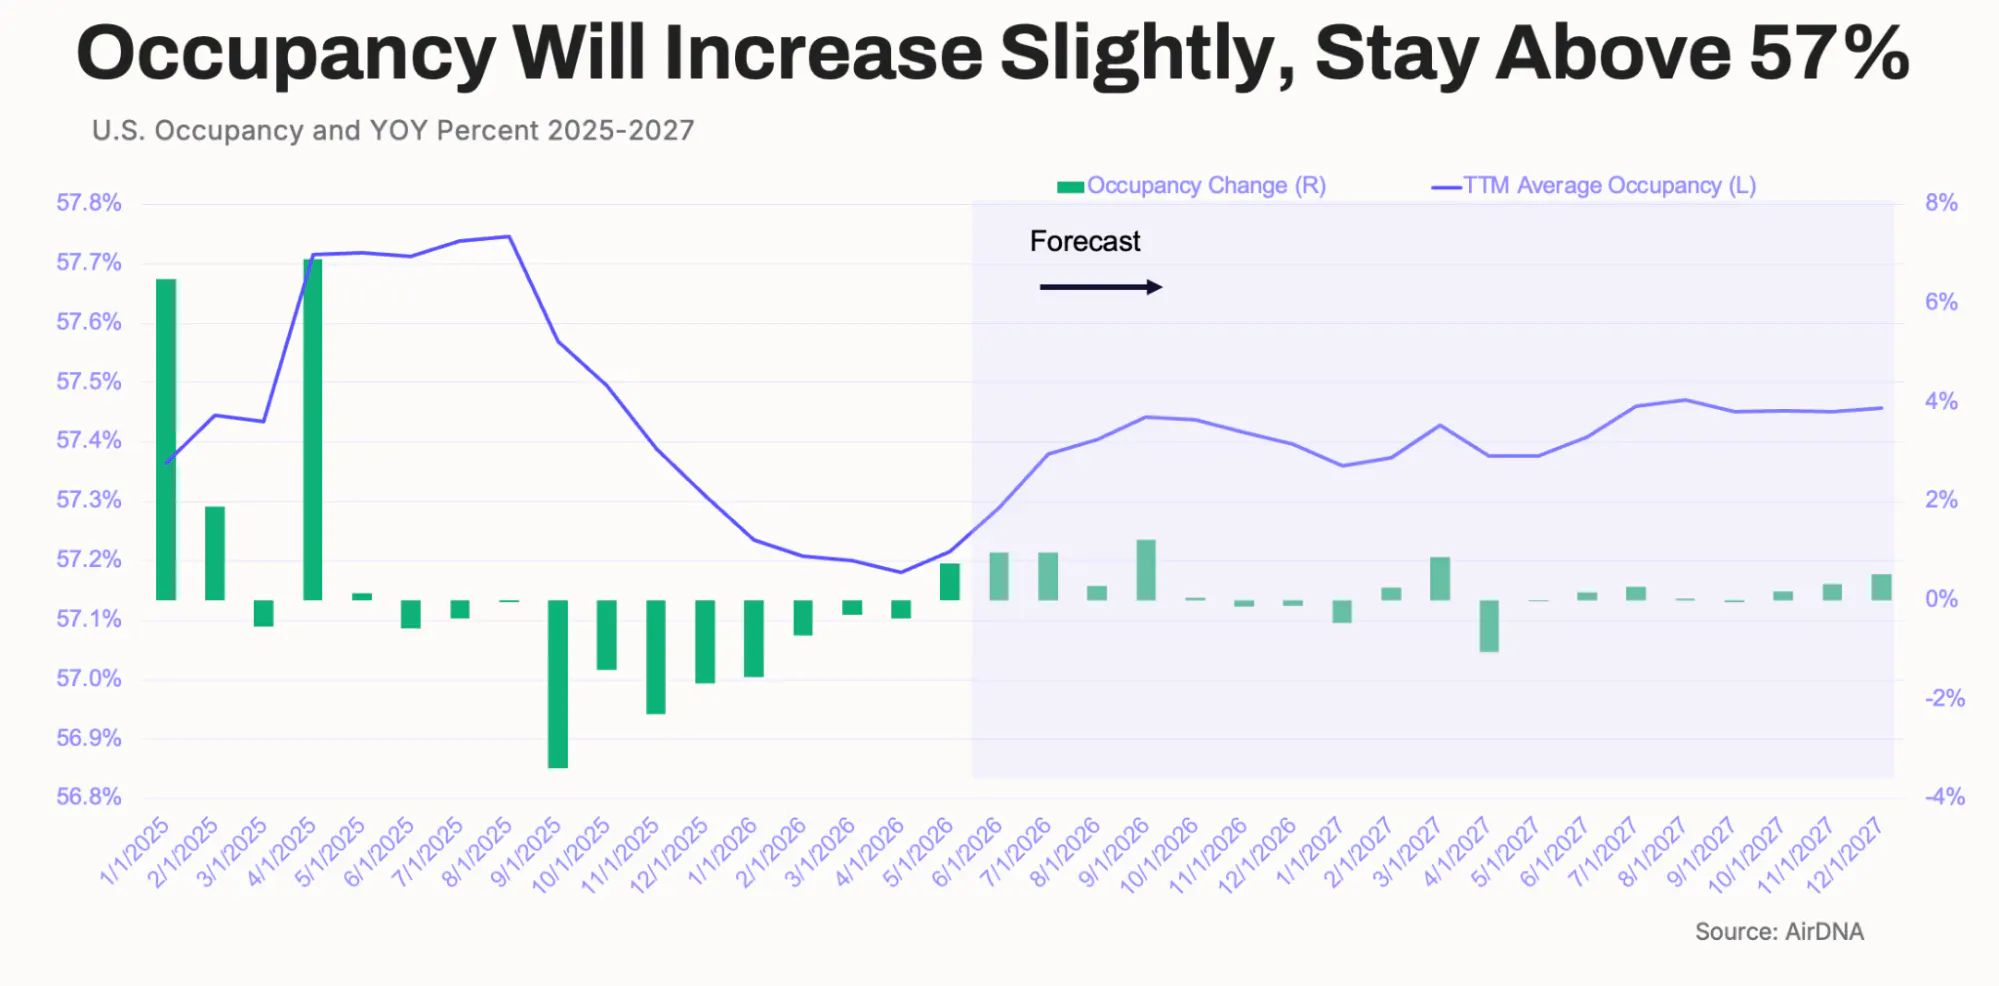
As a result, we've lowered our supply forecast and trimmed demand expectations. But because supply growth has slowed by more than demand, occupancy is now expected to remain above the pre-COVID average of 57% for the foreseeable future. Fewer new listings are tough news for buyers, but a relief for existing hosts facing less new competition. Firmer occupancy also brings more pricing power, even as the effects of higher energy costs and weaker real wage growth continue to work their way through the economy.
Economic Backdrop & Market Expectations
The economy entered 2026 on shaky footing. Job growth slowed during the longest government shutdown on record, while tariffs, although milder than the April headlines suggested, still pushed inflation back toward 3%. At the same time, inflation had begun to ease, unemployment remained low despite weak hiring, and tax refunds were expected to support consumer spending through the first half of the year.
Then the year took another turn. The closure of the Strait of Hormuz in late February created the biggest energy shock in recent memory, disrupting a shipping lane that carries roughly a fifth of the world's oil. Gas prices and producer costs rose quickly, pushing inflation higher just as the effects of tariffs were beginning to fade.
By May, consumer price inflation had reached 4.2% year over year, effectively wiping out the boost from tax refunds and dragging real income growth, which had already been slowing through 2025, to near zero.
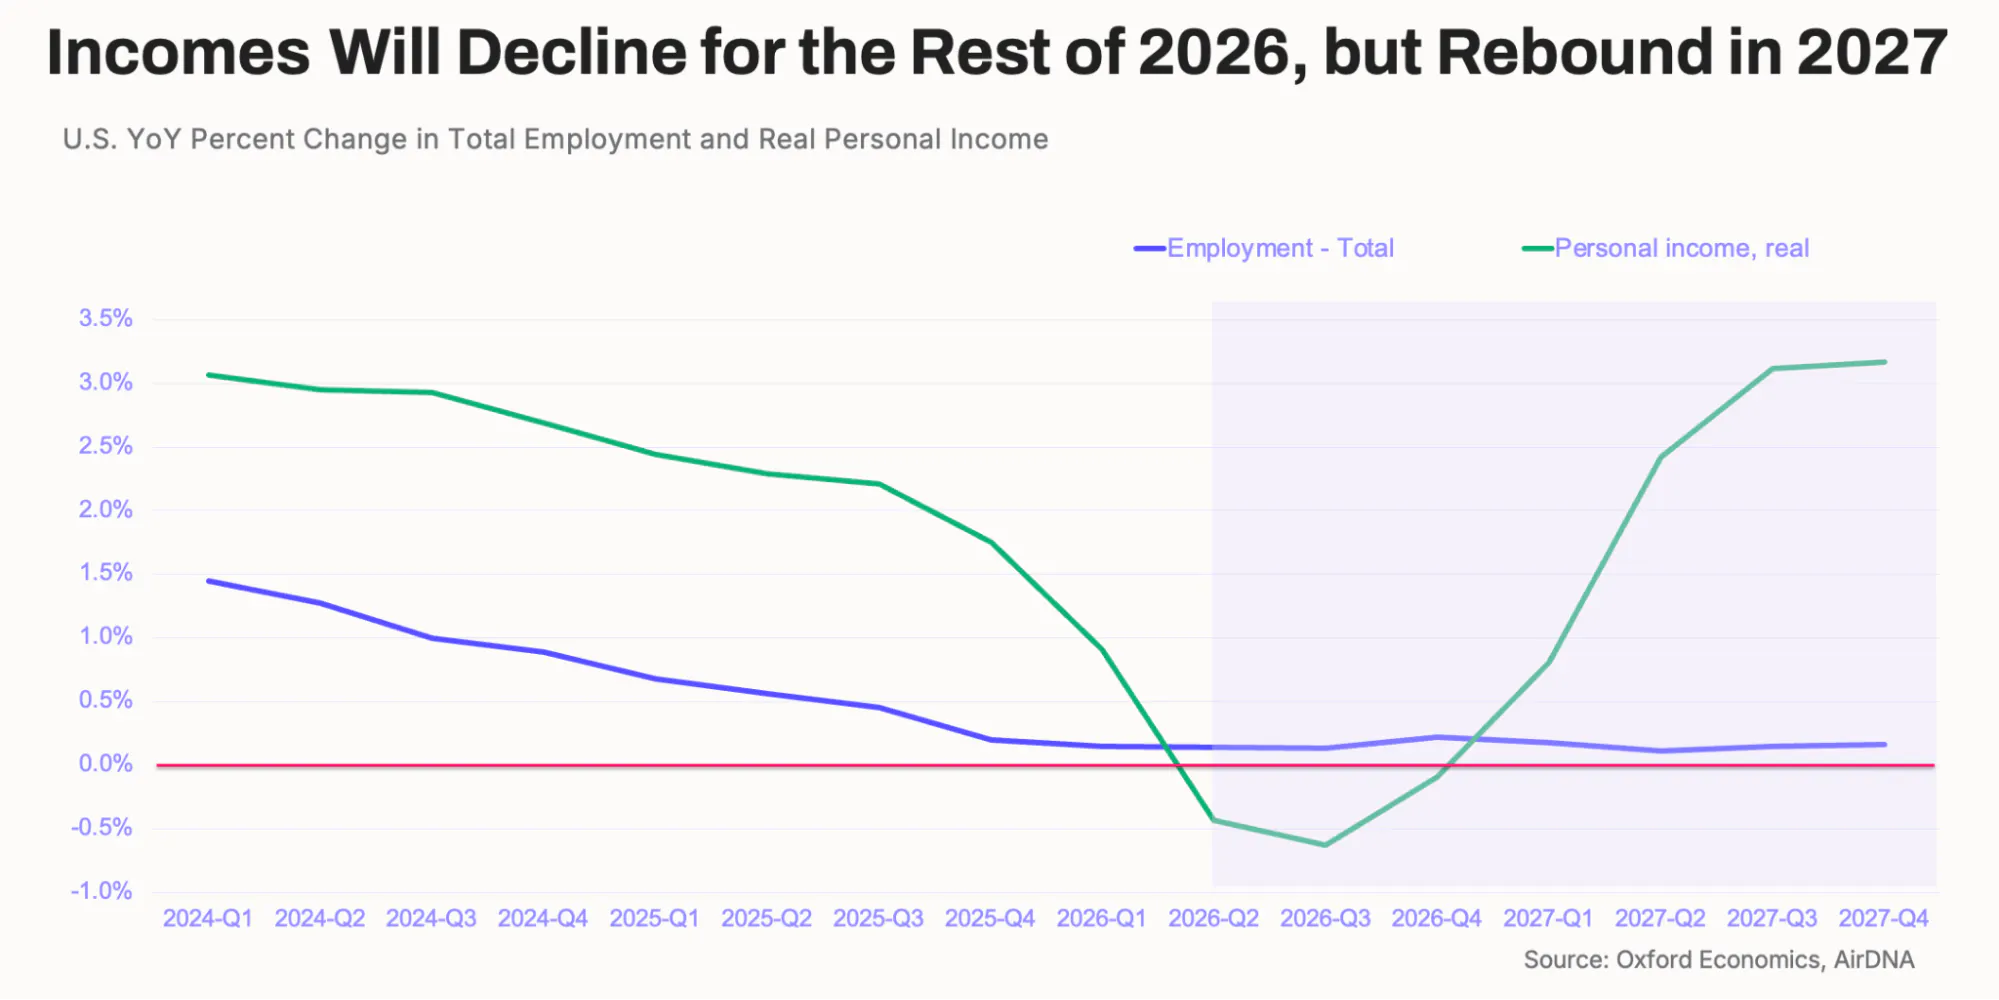
Oxford Economics expects inflation to remain elevated through the rest of the year, eroding real incomes even as peace talks continue. While record releases from global oil reserves helped limit the initial price shock, replenishing those reserves and higher producer costs are likely to keep inflation elevated for some time. Even so, inflation is expected to remain well below the highs seen in 2022.
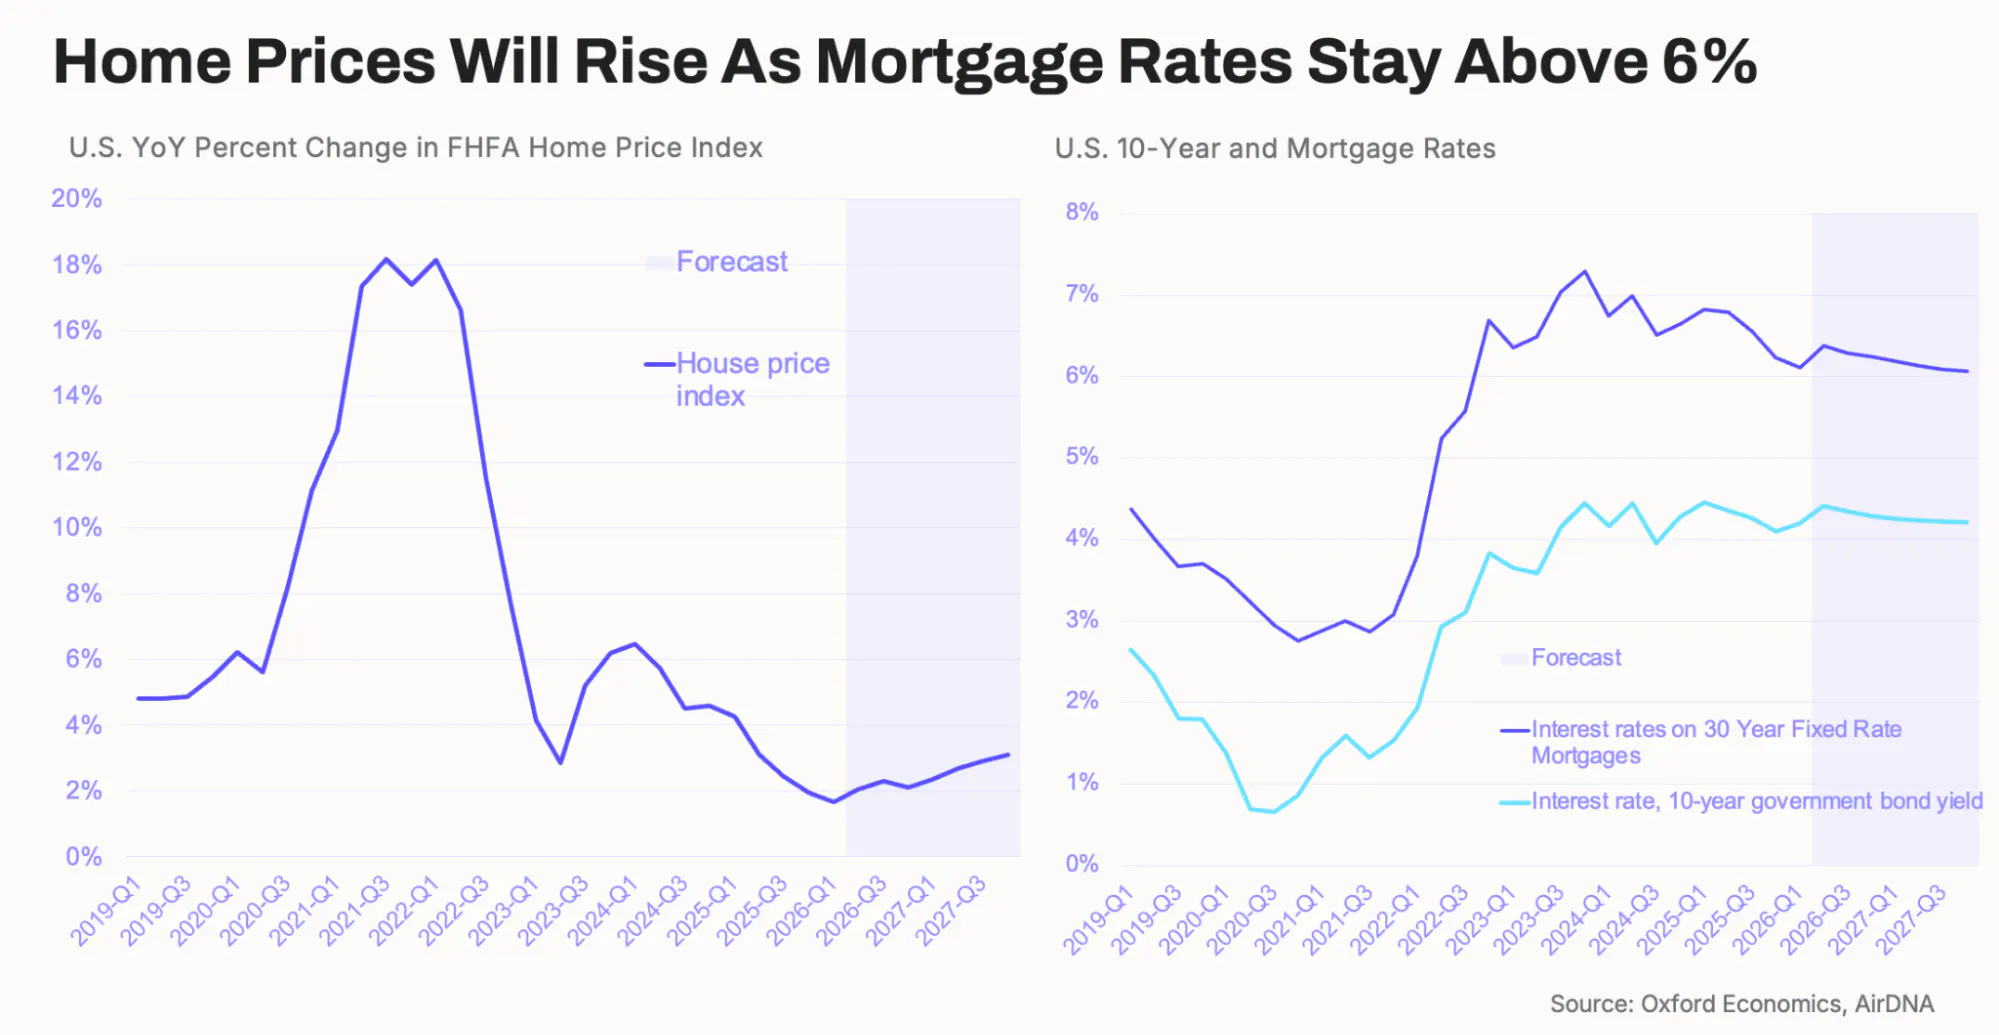
With inflation remaining stubbornly high, the Federal Reserve has little room to lower interest rates. At its June 17 meeting, the first chaired by Kevin Warsh, the Fed held rates steady at 3.5% to 3.75% and raised its inflation outlook to 3.6%. As a result, mortgage rates are expected to remain above 6% through the rest of 2026 and likely much of 2027, continuing to weigh on home buying, construction, and new short-term rental supply.
Smart investments happen here.
AirDNA’s powerful yet easy-to-use tools make hosting and investing a breeze. This means having every insight you need, all in one place, always up-to-date.
Guest Trends: Shorter Trips, Later Bookings
All this uncertainty raises a practical question for hosts: How do you adapt to changing guest behavior?
For the rest of 2026, we expect travelers to continue prioritizing value, flexibility, and regional destinations. As incomes recover in 2027, the focus should gradually shift back toward experiential travel, with international visitors providing an additional boost.
In the near term, travelers are responding to the economy in two clear ways: Booking later and taking shorter trips. Across AirDNA's six location types, booking windows (the time between booking and arrival) have been shrinking since 2023. Urban markets have the shortest booking windows, at just over 20 days on average, the lowest since the pandemic.
Most other market types saw booking windows level off toward the end of 2025, with coastal markets even ticking up slightly in early 2026. Because booking windows tend to respond to economic conditions with a lag, particularly during the summer months, they are expected to shorten again later this year. That also means pacing data can appear softer than demand ultimately turns out to be.
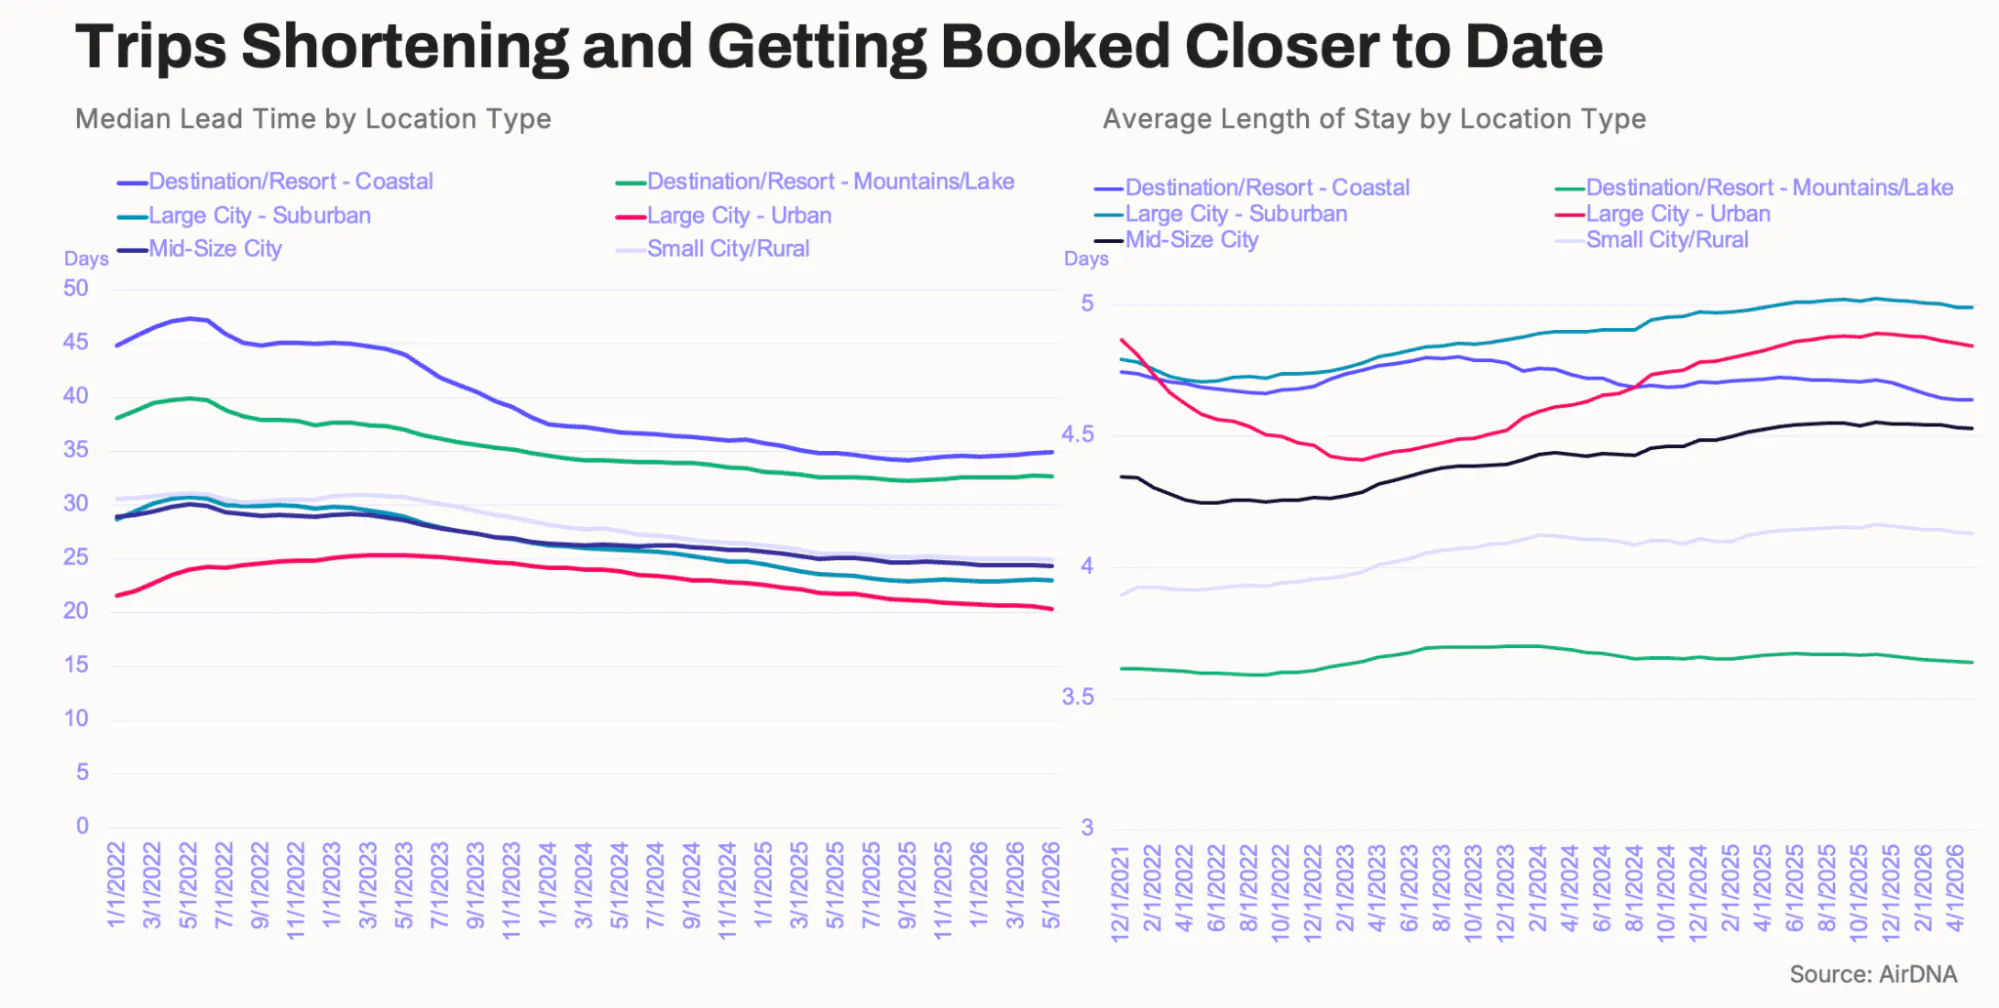
Length of stay is following a similar trend. After increasing through much of 2025, stays have shortened across every location type, with coastal resorts recording their shortest average stays since the pandemic.
For hosts, this makes pricing more challenging. When pacing looks soft, the temptation is to lower rates, but that can simply mean discounting for guests who were likely to book anyway, just later. Monitoring competitor pricing and availability is more important than ever, while more flexible minimum-stay requirements can help capture shorter bookings.
The Slow Return of International Travelers
International guests are a small slice of U.S. short-term rental demand overall, but they carry outsized weight in gateway, coastal, and big-city markets, exactly the places now hosting the 2026 FIFA World Cup. After a rough 2025, our demand data show a slow, uneven recovery in 2026 rather than a clean rebound, setting the backdrop for several of our strongest markets.
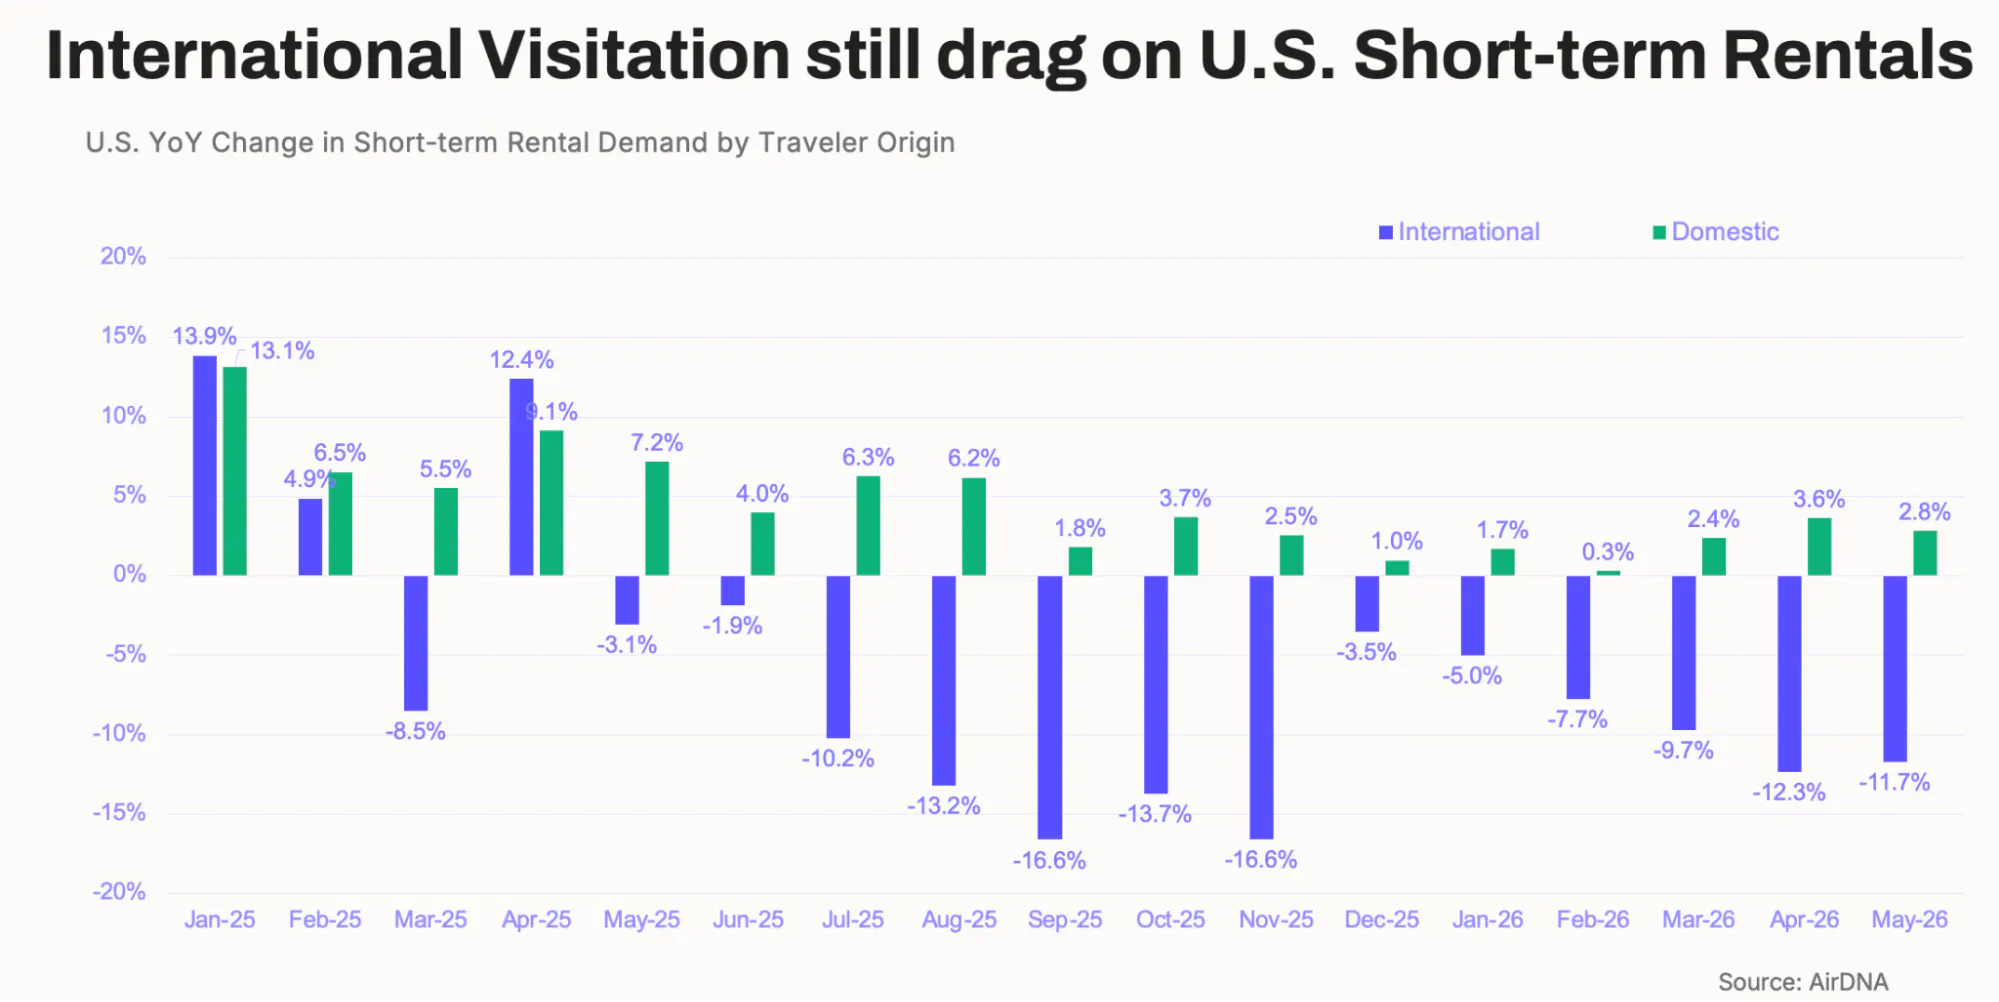
Our own demand data put hard numbers on it. International STR demand turned negative in mid-2025 after the spring tariff shock and hasn't recovered. It fell by double digits through the second half of the year, bottoming out near -17% in September and November, and was still down 11.7% year over year in May 2026. Domestic demand has carried the market in the meantime, but its growth cooled from the low teens in early 2025 to under 3% by May. In short, soft international travel is now a measurable drag on total demand, not just a talking point.
The broader travel data points in the same direction. Official U.S. arrivals fell in 2025, and the national tourism office expects only a slow recovery in 2026 (around +3%), held back by visa and border frictions despite the World Cup and a weaker U.S. dollar. If anything, our STR demand data show a sharper and more concentrated hit than the headline arrivals numbers, reflecting the short-term rental industry's reliance on discretionary leisure travel.
International STR Demand by Source Market
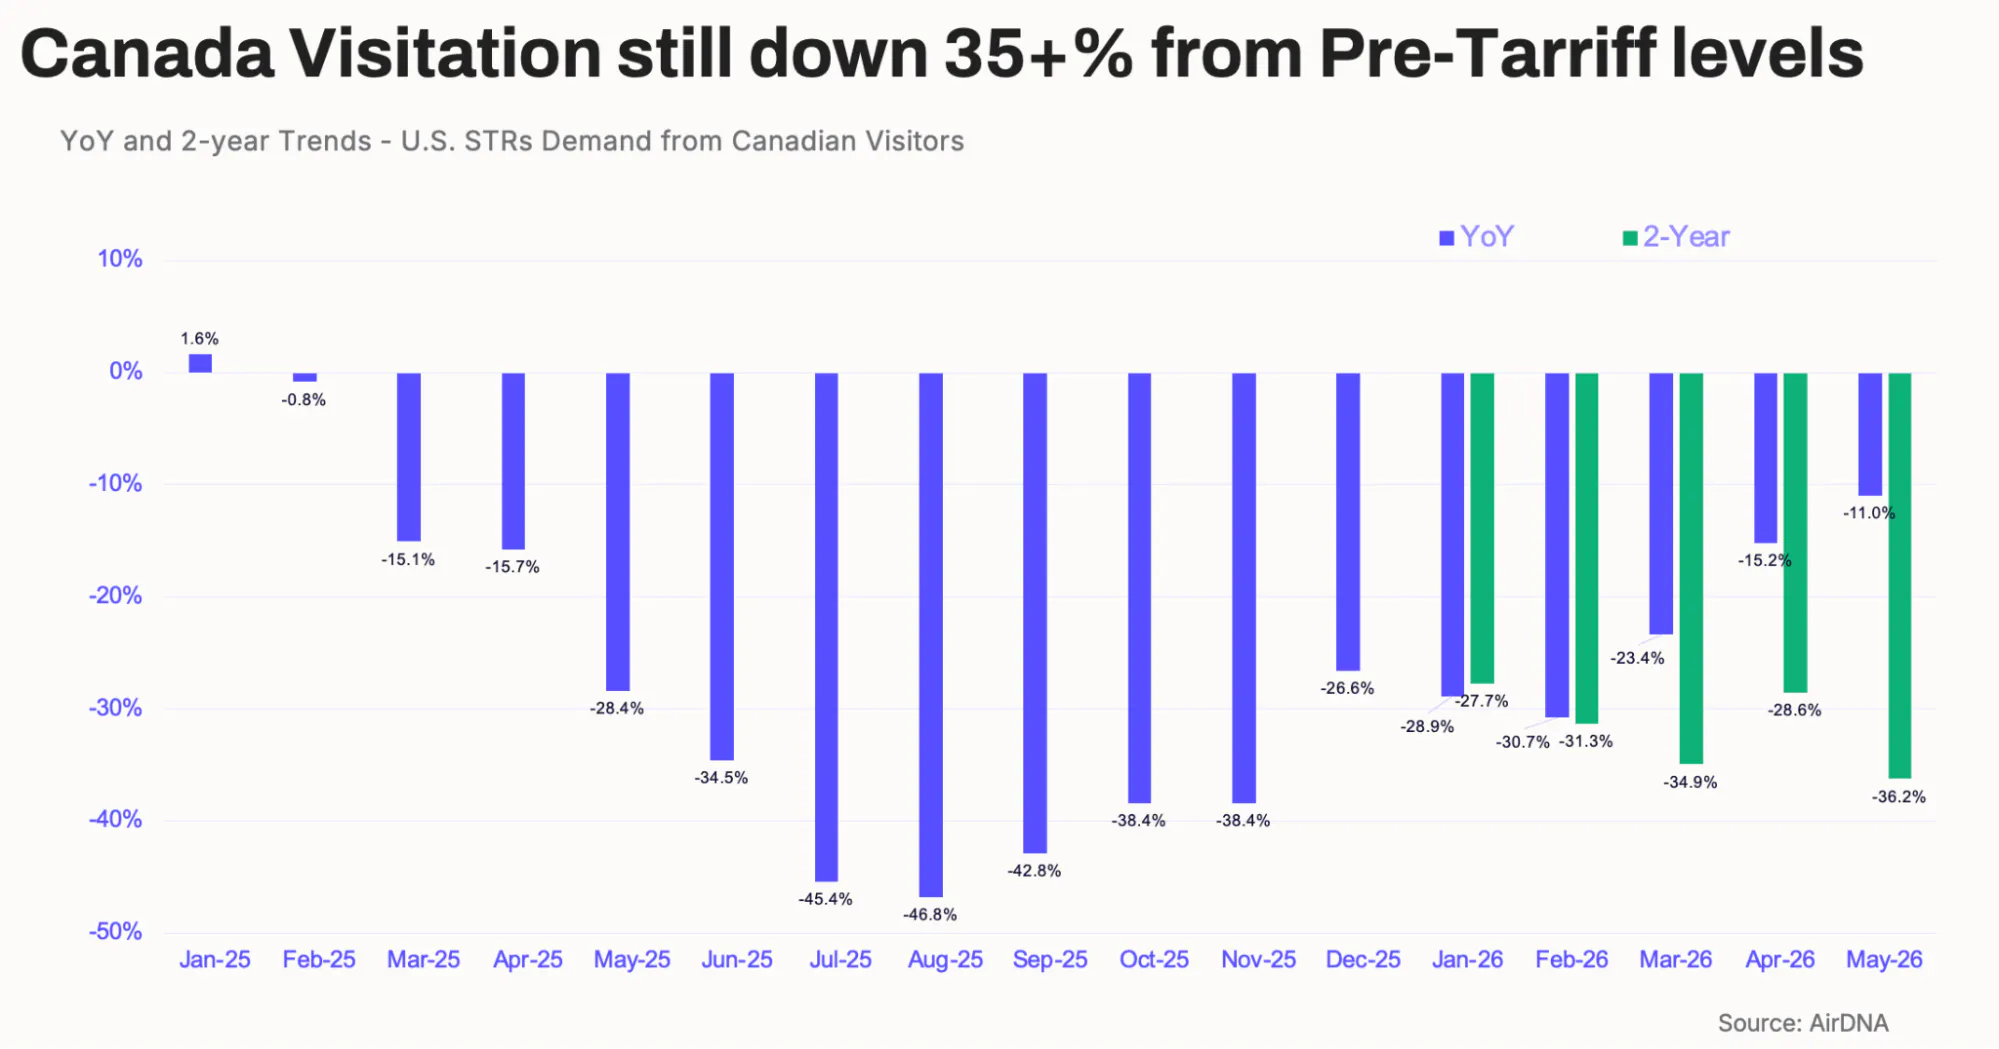
Canada is the epicenter. Canadian demand collapsed through 2025, falling more than 45% year over year at its late-summer low. The year-over-year figure has since improved to around -11% by May 2026, but that is largely because the comparison base is so low. On a two-year basis, Canadian demand remains down more than 35% from pre-tariff (2024) levels. Because Canada is one of the U.S.'s largest source markets, it accounts for an outsized share of the international shortfall, hitting northern border and Canada-reliant markets the hardest.
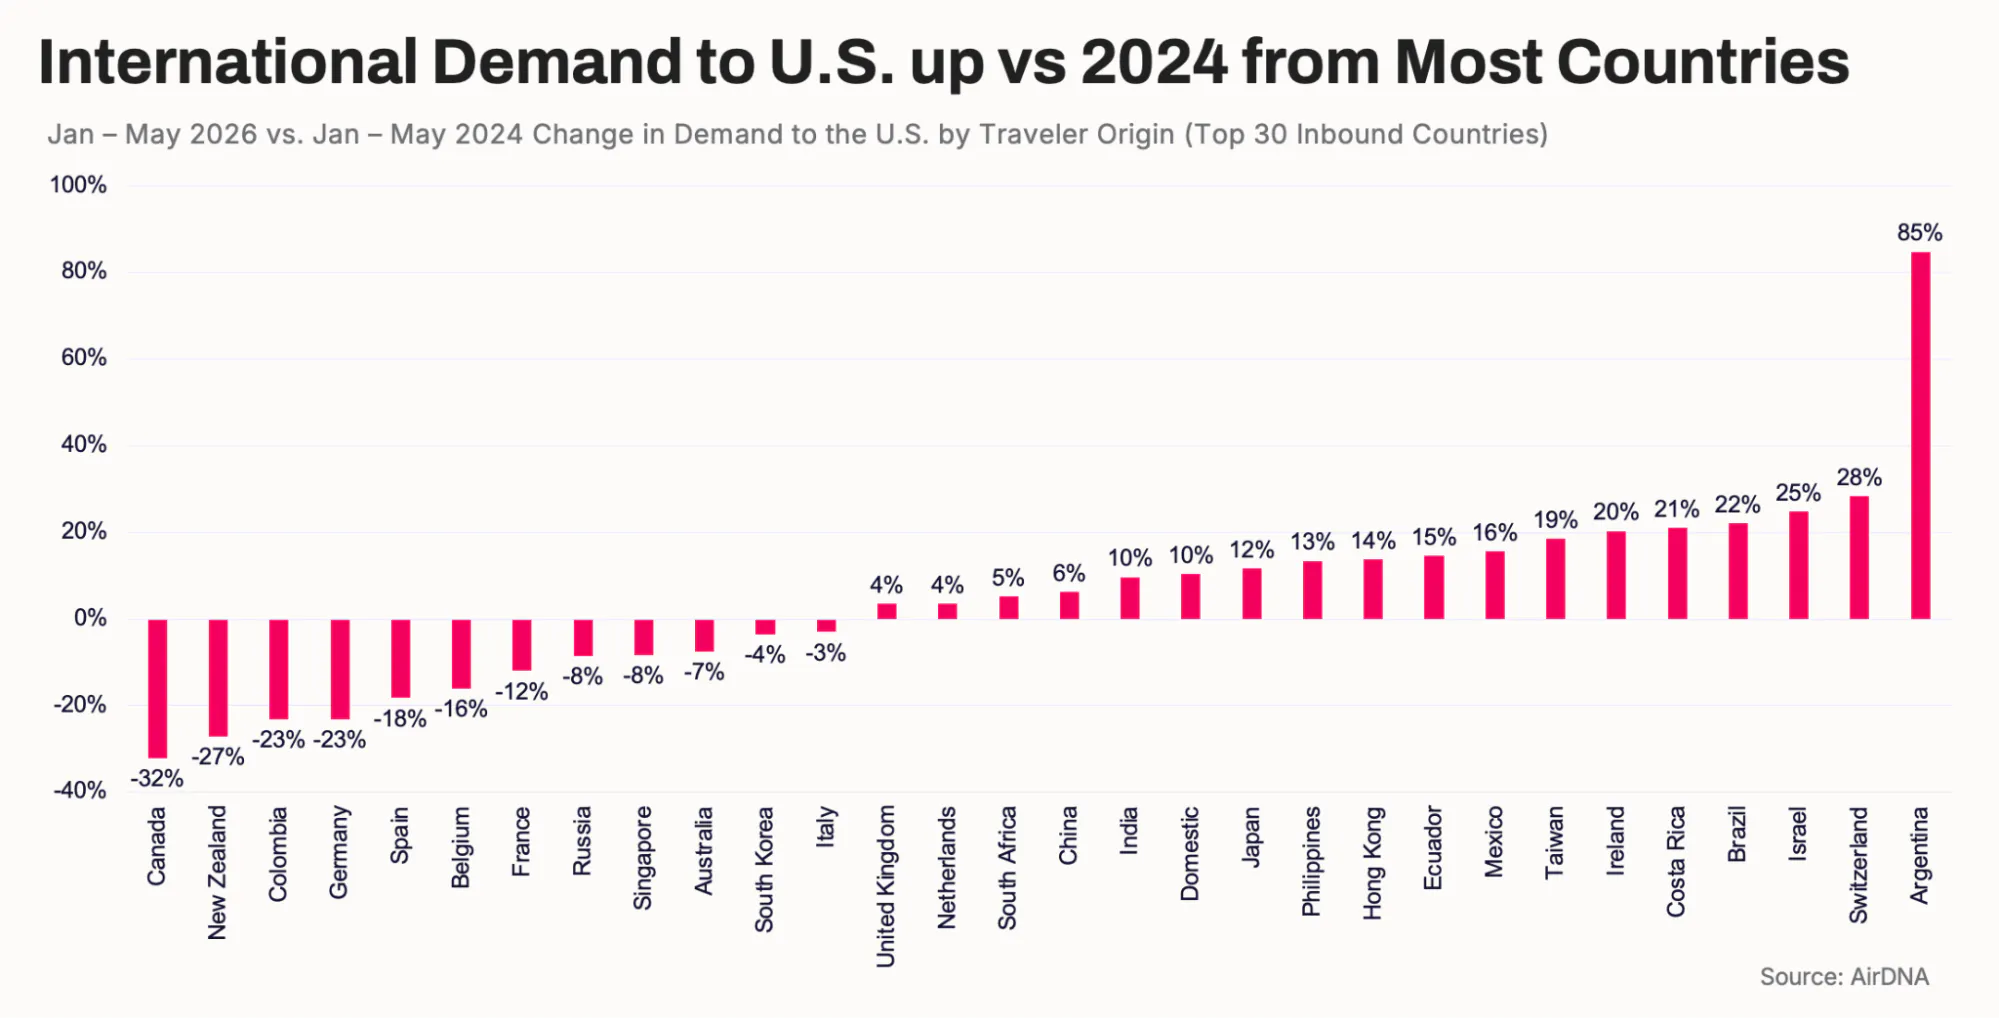
The weakness is concentrated, not widespread. Compared with 2024, our demand data show the U.S. is actually seeing stronger demand from most countries. Mexico (+16%), Brazil (+22%), and Argentina (+85%) lead a long list of Asian and Latin American markets posting double-digit growth, while smaller European source markets such as the U.K. and the Netherlands are slightly positive. The declines are concentrated in Canada (-32% versus 2024) and parts of Western Europe, including Germany (-23%), Spain (-18%), Belgium (-16%), and France (-12%).
The practical takeaway is that this is largely a Canada-and-Western-Europe story. Gateway and border markets that rely on those travelers are taking the hit, while destinations attracting Latin American and Asian visitors remain flat or continue to grow.
Why Luxury Listings Keep Winning
Another force shaping guest behavior is the so-called "K-shaped" economy, in which higher- and lower-income households are moving in opposite directions. A series of policy changes, including the tax breaks in the "Big Beautiful Bill," tariffs that fall hardest on lower-cost goods, higher gas prices following the conflict in Iran, and cuts to social and public-health programs, have made it an especially tough stretch for lower-income households.
At the other end of the market, the picture is very different. A booming stock market, led by surging tech shares, has left wealthier households feeling flush even as real incomes slip and hiring stalls. Since travel skews toward higher earners, that wealth effect has continued to support short-term rentals.
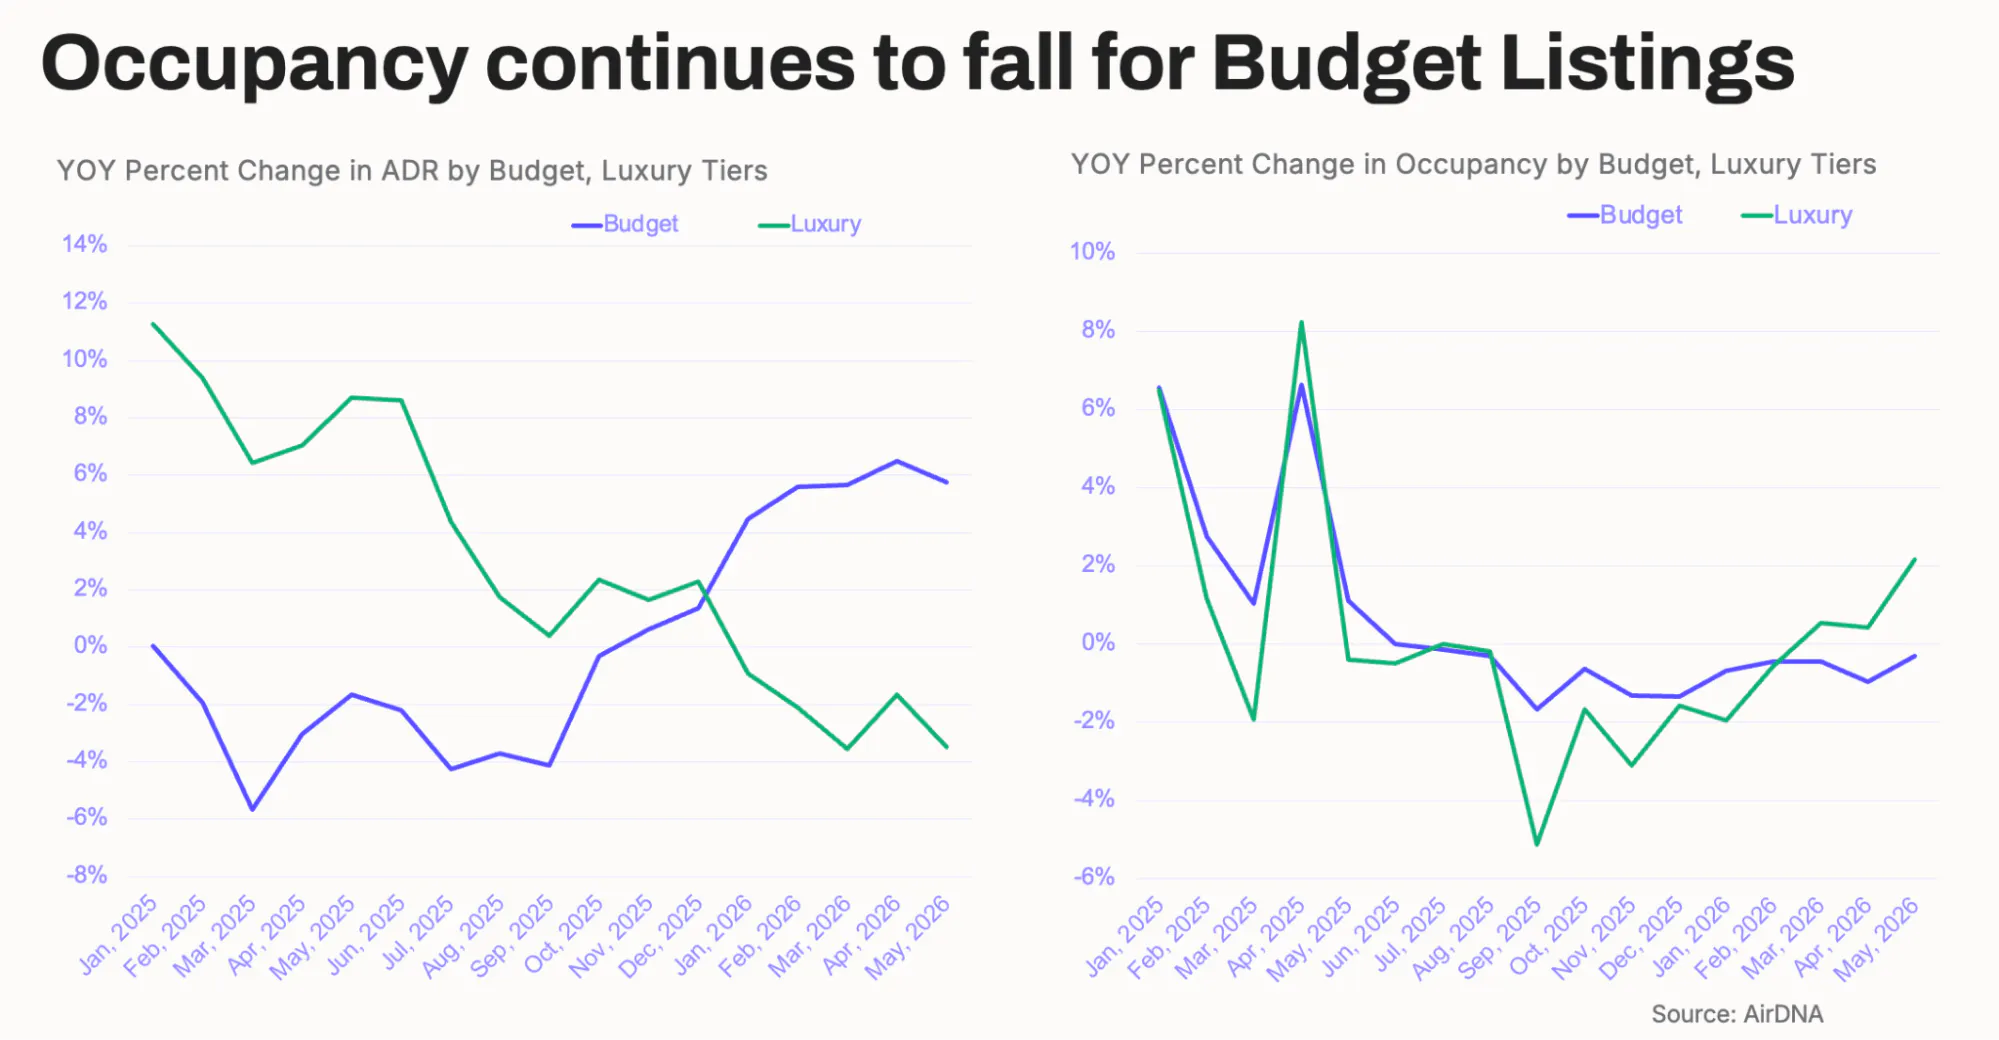
AirDNA's price tiers show this K-shaped economy playing out. In the first half of 2025, budget rates (the lowest-priced fifth of listings, adjusted for bedroom count) were falling while luxury rates (the highest-priced fifth) climbed rapidly. That gap narrowed during the second half of 2025 and reversed in 2026, with budget and luxury rates now converging.
Occupancy is following the opposite pattern. In 2025, occupancy grew faster at the budget end than the luxury end. In 2026, that trend flipped. The shift suggests hosts are increasingly seeing similar economic pressures affecting guests across all price tiers.
Comparing nightly rates with our Repeat Rent Index (RRI), which tracks pricing for the same listings over time, shows how inflation is shaping pricing decisions. During the high inflation of 2023, new listings entered the market as value plays, pulling overall ADR down even as RRI continued to rise. After inflation cooled in 2024, ADR briefly outpaced RRI.
Inflation picked up again in 2025 and 2026, first from tariffs and then from the energy crisis. Since then, RRI has outpaced ADR as new listings, lacking reviews and repeat guests, continue to compete on price. As inflation cools, we expect ADR growth to catch up with, and eventually overtake, RRI again in 2027.
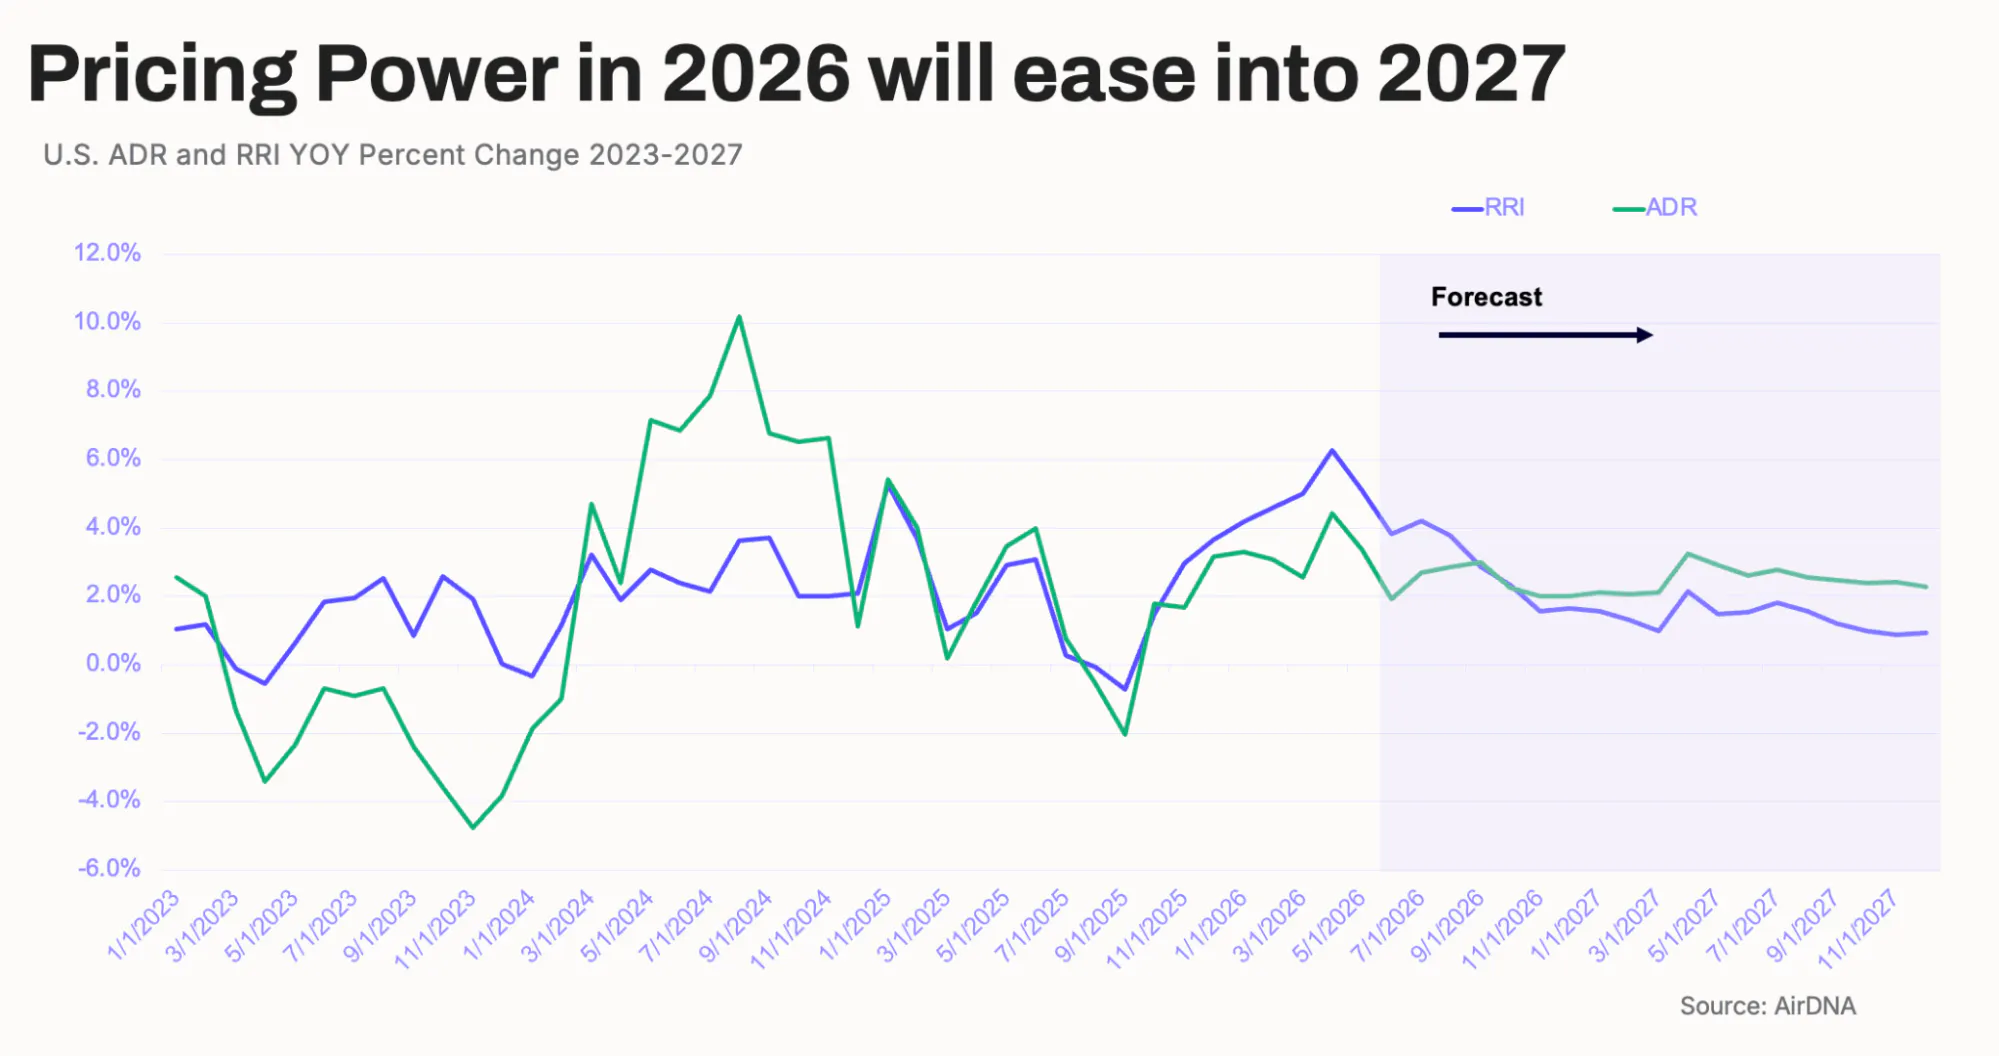
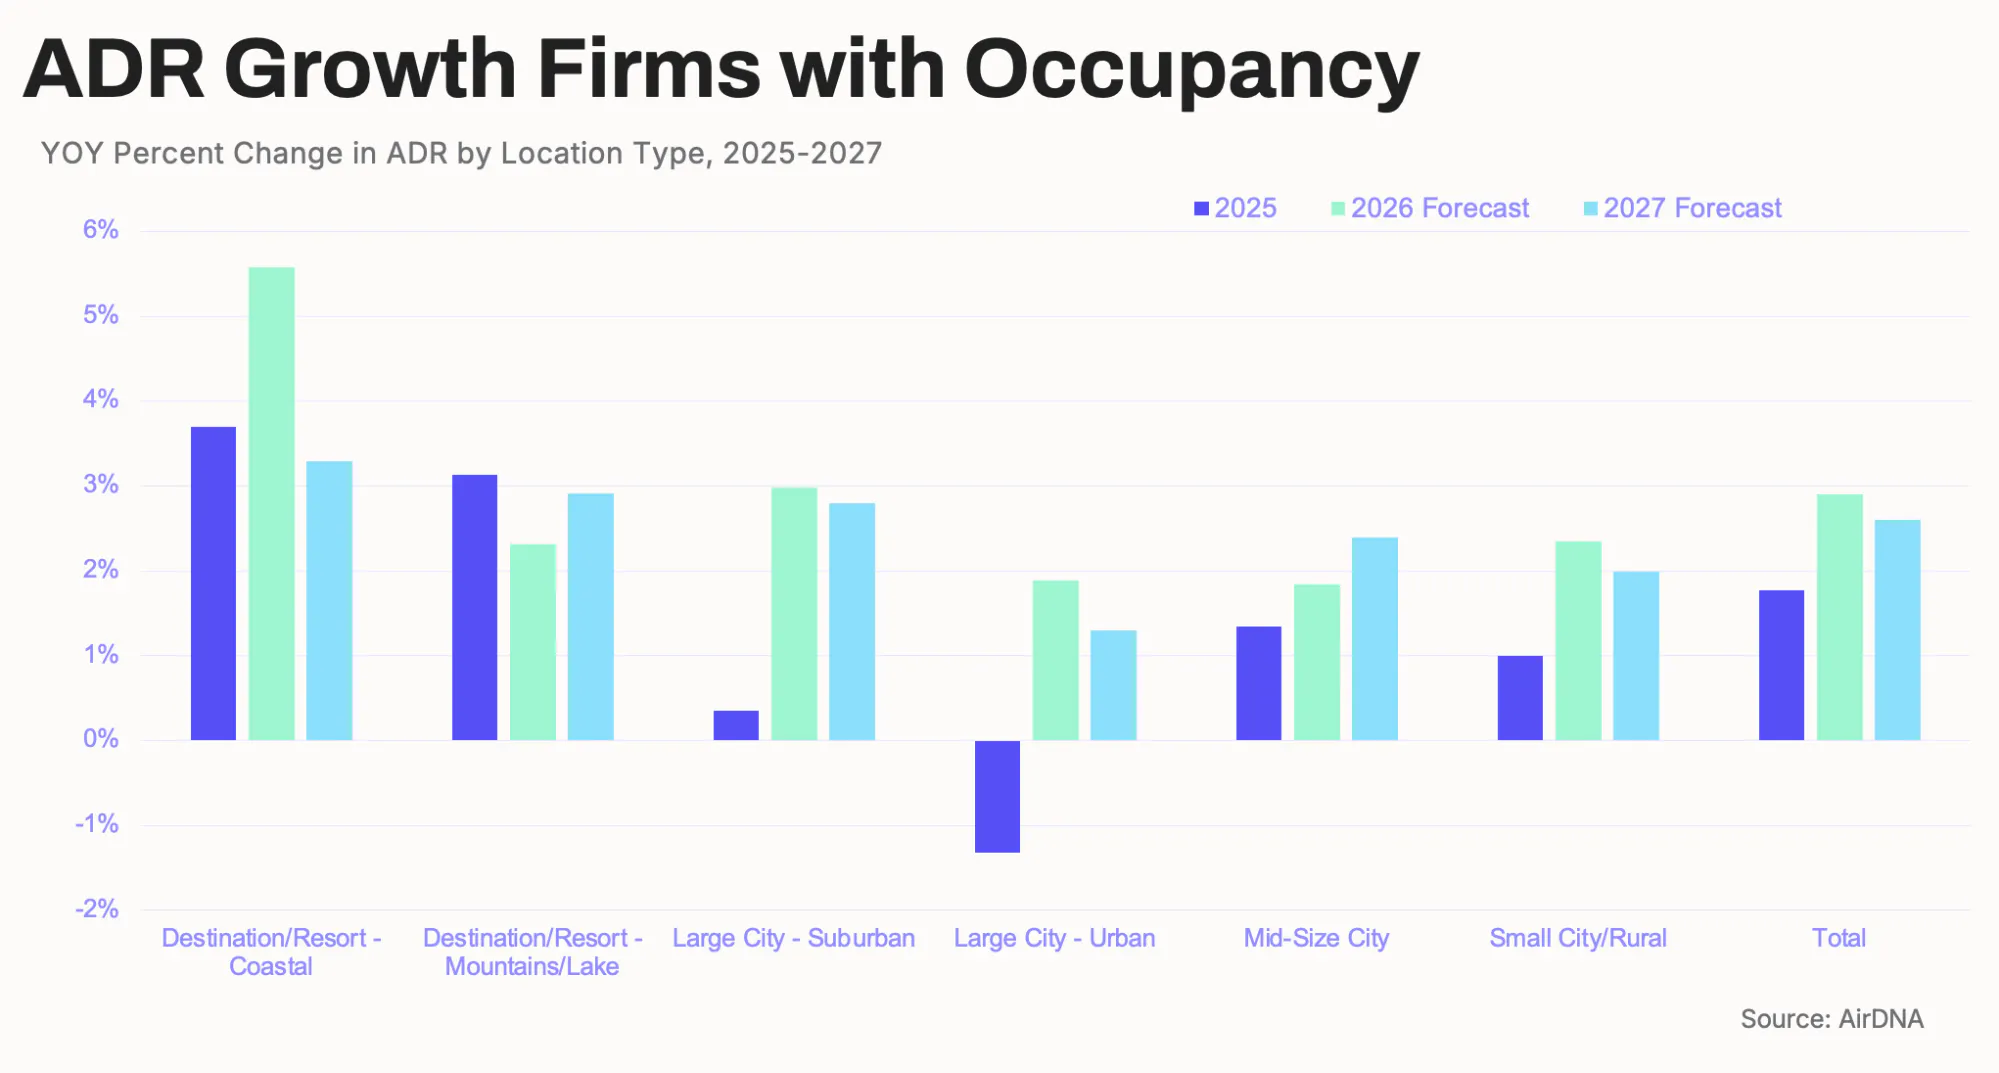
Rate growth will technically be a touch slower in 2027, but with lower inflation, those gains will go further in real terms, especially in the final three quarters of the year. By market type, coastal resorts will see softer rate growth against strong 2026 comparisons, while mountain and lake destinations should rebound, assuming the snow returns. Mid-size cities, supported by regional drive-to demand, are expected to see rate growth accelerate.
How is your STR performing?
Your vacation rental may be amazing, but is it better than your competition? Connect your Airbnb listing to AirDNA to see its Booking Performance Score.
Bigger Listings Continue to Lead
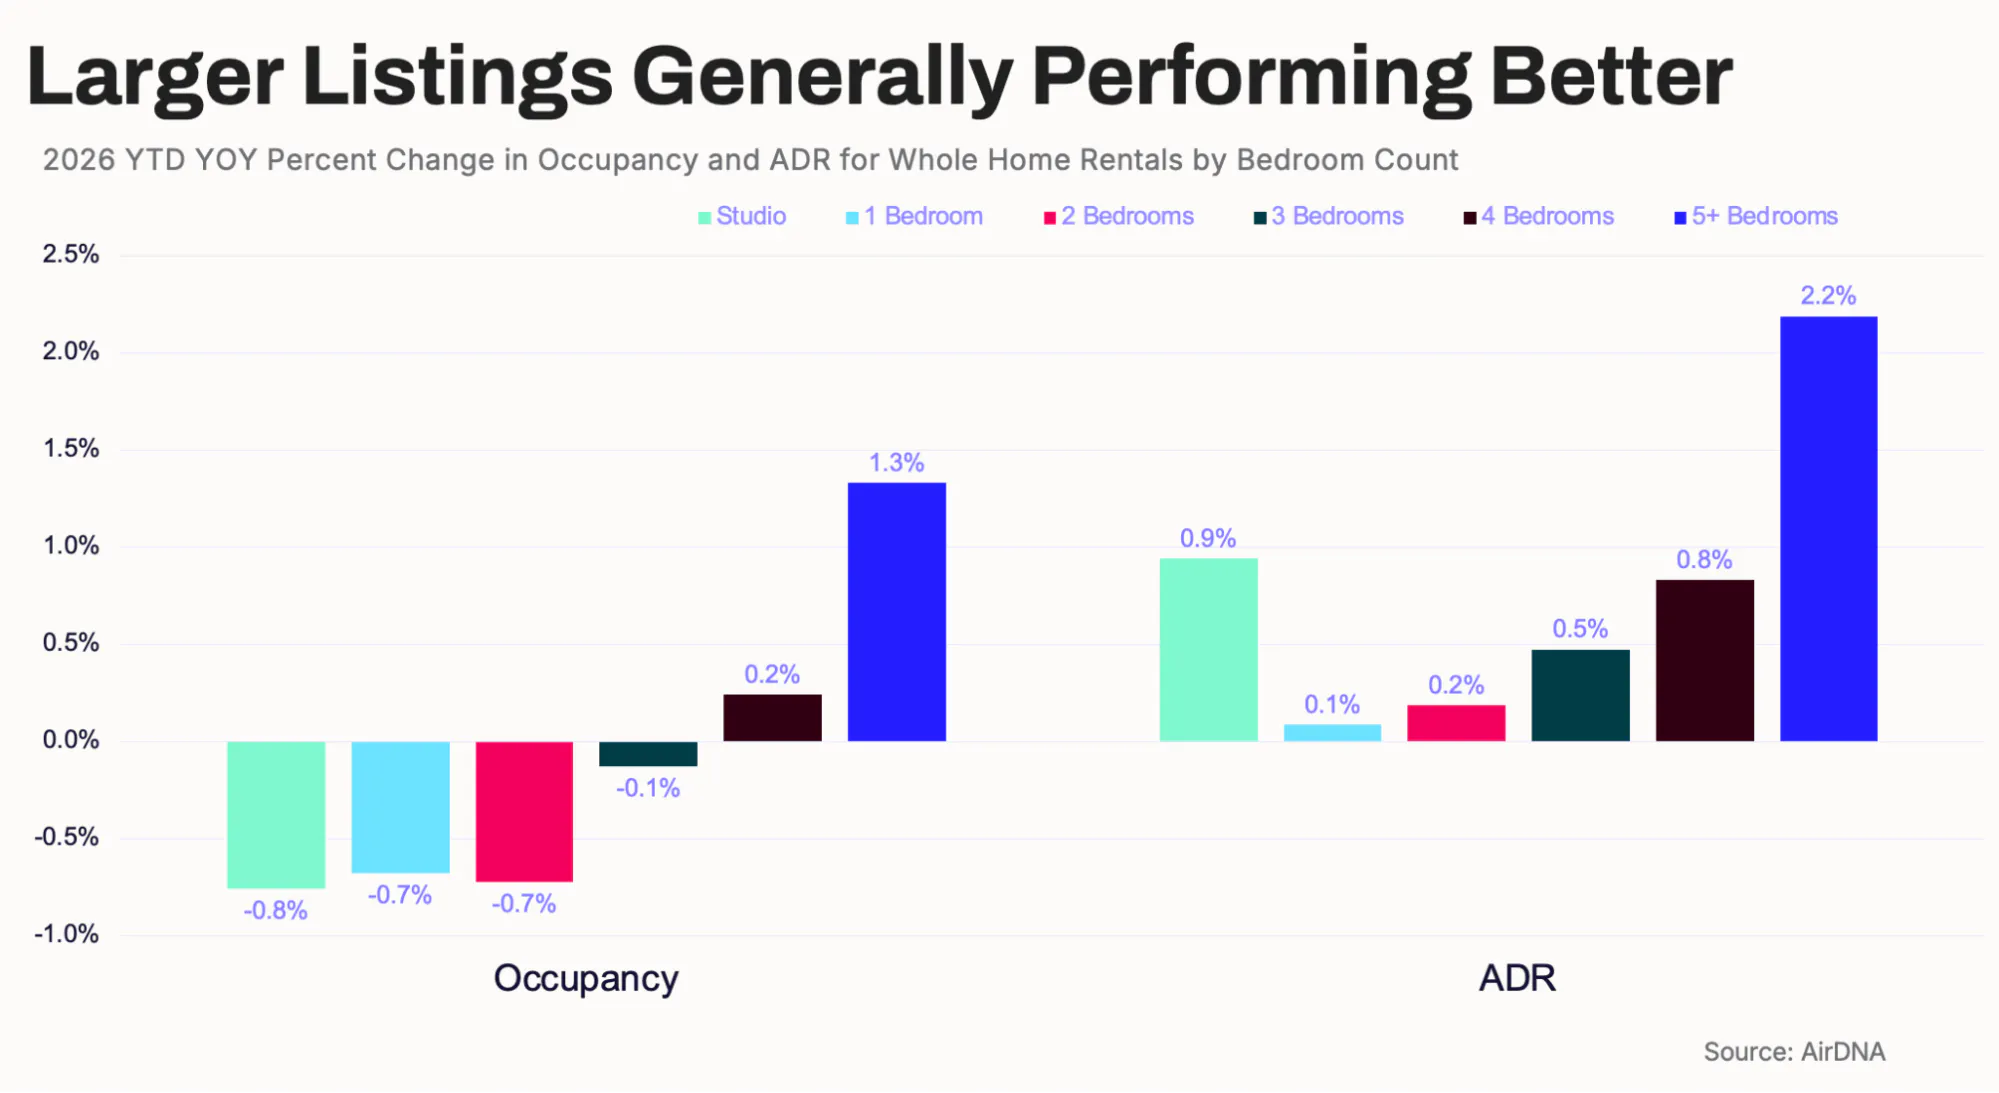
Bigger listings keep outperforming, and the trend has stuck. Large homes with many bedrooms took off during the pandemic, when groups "quarantined together." We expected the appeal to fade, but it has held, and arguably grown, as traveling in a group has become a way for families and friends to save money while enjoying more space and amenities than booking several hotel rooms.
Through the first five months of 2026, performance grades cleanly by size. Studios through two-bedroom listings are roughly flat (occupancy down about 0.7%, with only modest ADR gains), while four- and five-plus-bedroom homes continue to lead on both occupancy and rate. Five-plus-bedroom listings are the clear winner, with occupancy up about 1.3% and ADR increasing 2.2%.
For now, space keeps winning.
Hotels Are Pulling Ahead on Occupancy
Hotels are the natural benchmark for short-term rentals, and through the first half of 2026, they have been strong, arguably stronger than STRs on the measure that matters most here: Occupancy.
According to STR/CoStar, U.S. hotel RevPAR rose 4.0% year over year through April, with the first quarter the best on record and a six-week winning streak into mid-May (RevPAR up 5.4%, ADR up 3.9%, and occupancy up one point to 68.2% in the week ending May 16). Demand was up about 2% year to date. On the strength of that start, CoStar and Tourism Economics raised their full-year 2026 RevPAR forecast to +2.8% from +0.6%, and they now expect hotel occupancy to grow rather than slip.
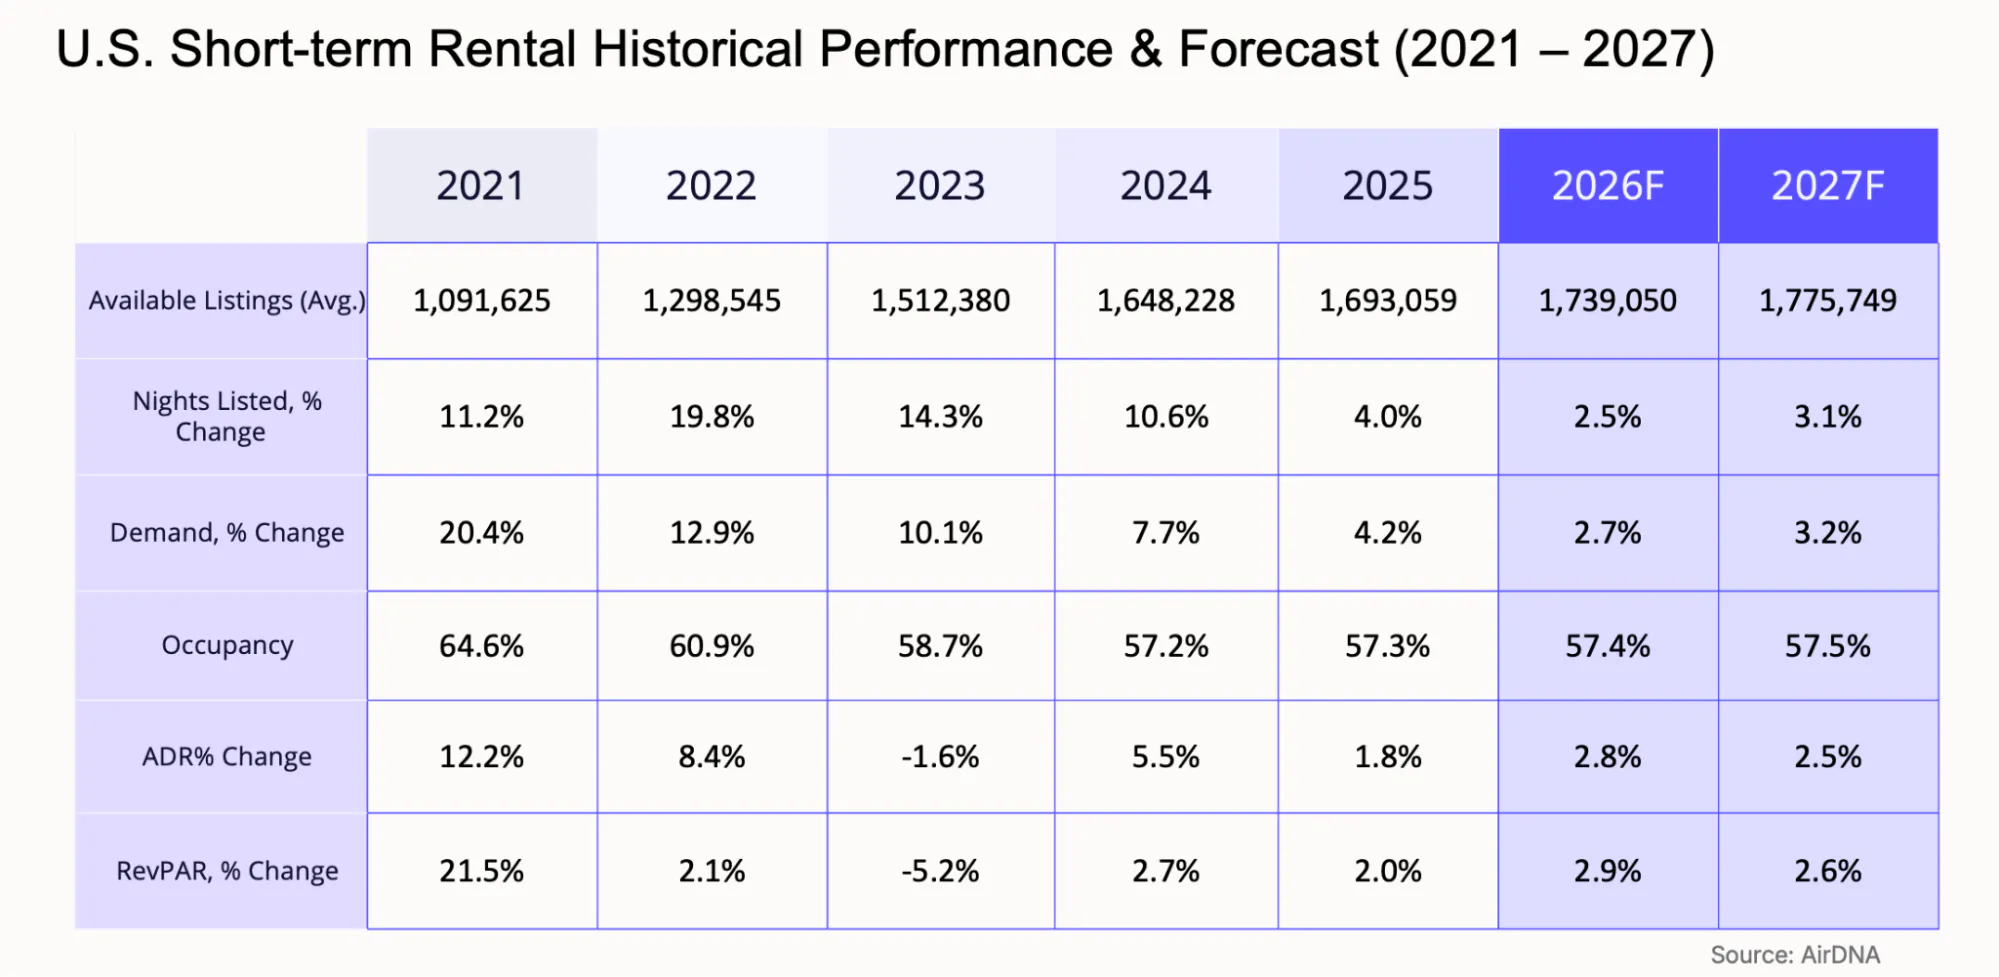
The short-term rental story rhymes, but the mix is different. Our 2026 forecast calls for RevPAR up 2.9%, almost identical to hotels' +2.8%, but STRs get there almost entirely on rate. Occupancy stays roughly flat at 57.4%, while hotels are turning steady demand into occupancy gains. Both are supply-constrained and rate-led, but hotels are winning the occupancy race right now. (The occupancy levels aren't directly comparable, since hotels and STRs measure occupancy differently, so focus on the growth rates.)
Two things to take away. First, demand is healthier than flat STR occupancy alone suggests. Hotels confirm that travel is holding up. Second, hotels regaining occupancy and pricing power is a competitive signal. Where the two go head to head in urban, group, and event markets, aggressive hotel pricing could cap your rate gains in the second half.
Less Competition Is Helping Existing Hosts
Higher inflation has handed existing hosts at least one gift: Higher mortgage rates and, with them, slower supply growth.
With rates still well above 6%, we now expect available listings to grow just 2.7% in 2026, down from the 4.6% we projected at the start of the year. That pullback has flipped our occupancy outlook. Instead of falling to 56.7% as forecast in December, occupancy is now expected to hold at 57.4% in 2026 and 57.5% in 2027, just above the pre-COVID average.
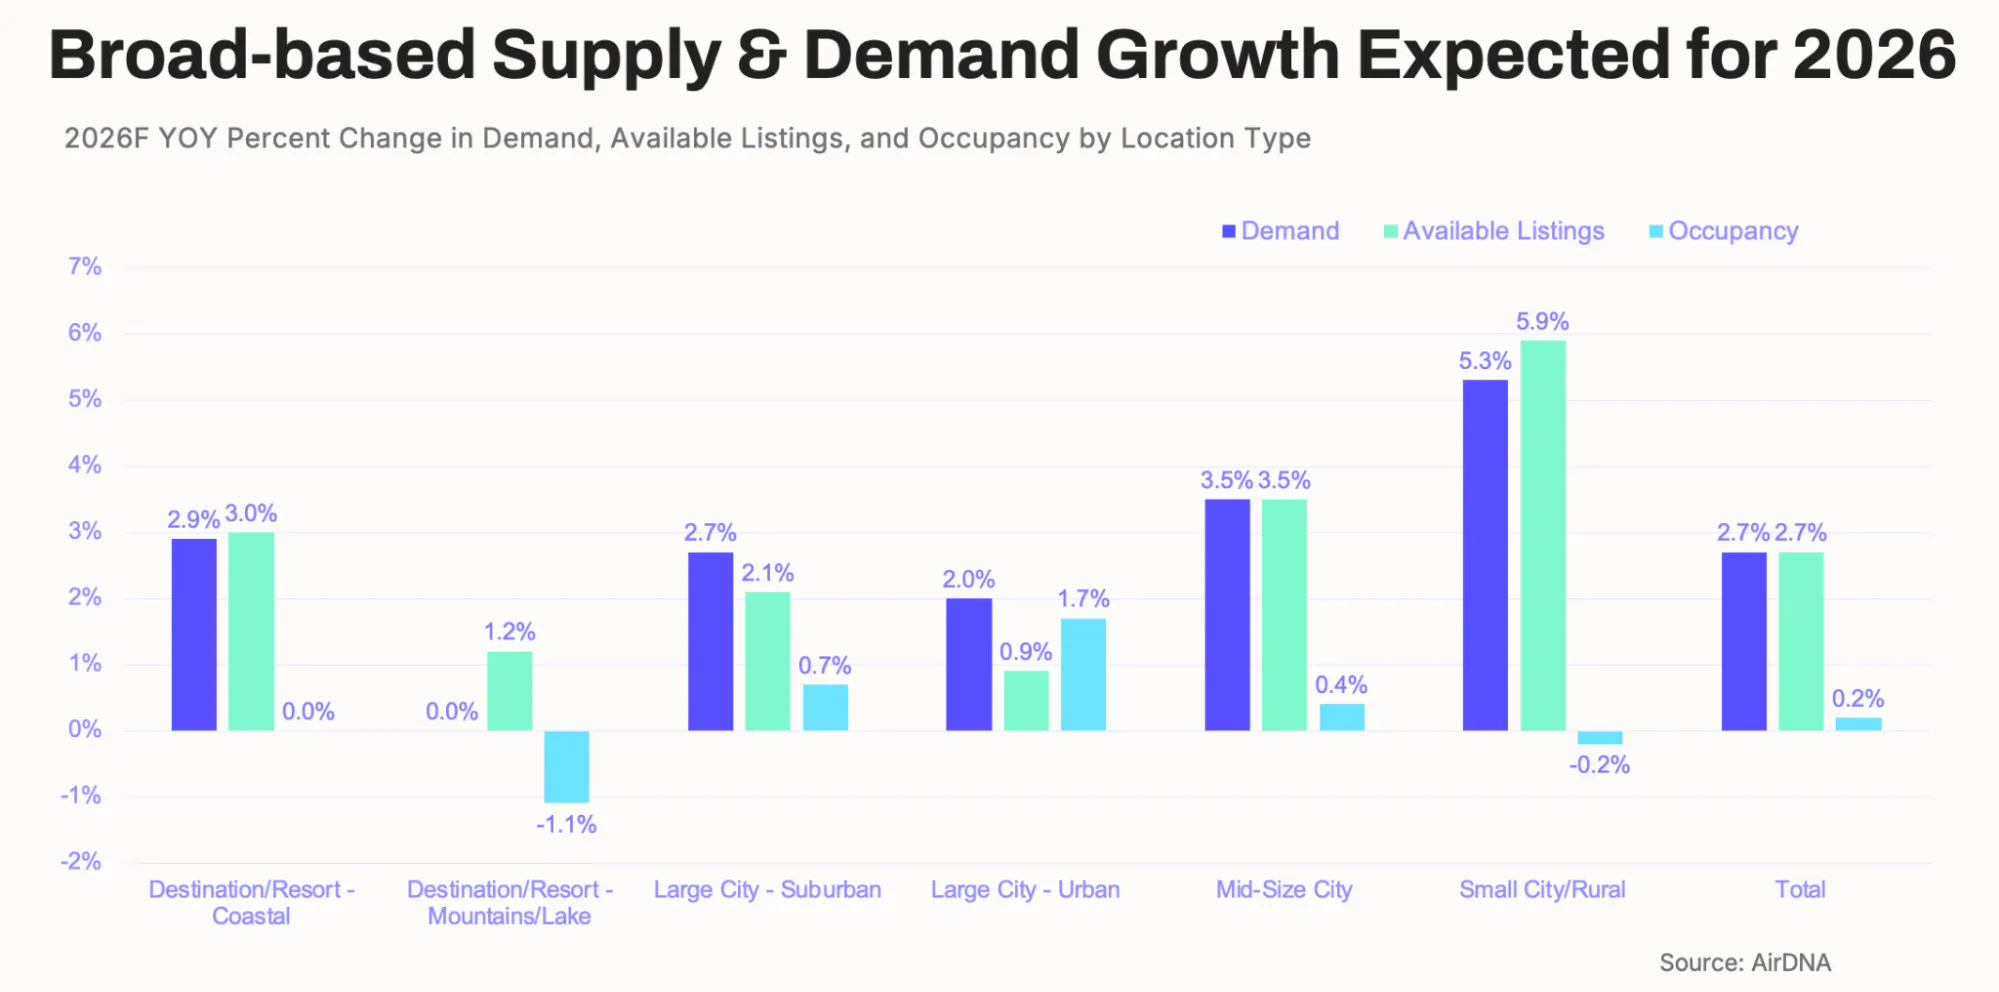
Higher gas prices are also encouraging closer-to-home trips, giving a modest boost to small cities, rural destinations, and mid-size markets.
At the same time, higher borrowing costs are steering new supply toward those same lower-cost areas. Big cities are the exception. World Cup demand, combined with limited supply growth, is expected to make Large City Urban the strongest-performing market type for occupancy growth in 2026 (+1.7%).
Which Markets Are Winning in 2026?
Across markets, the clearest driver of 2026 performance is supply, not demand. Markets where listings are shrinking continue to outperform, with San Francisco (RevPAR +12.1%), Anaheim (+11.0%), and Philadelphia (+10.1%) leading the way. San Diego, Oakland, California, and San Jose/Palo Alto, California also continue to post strong gains.
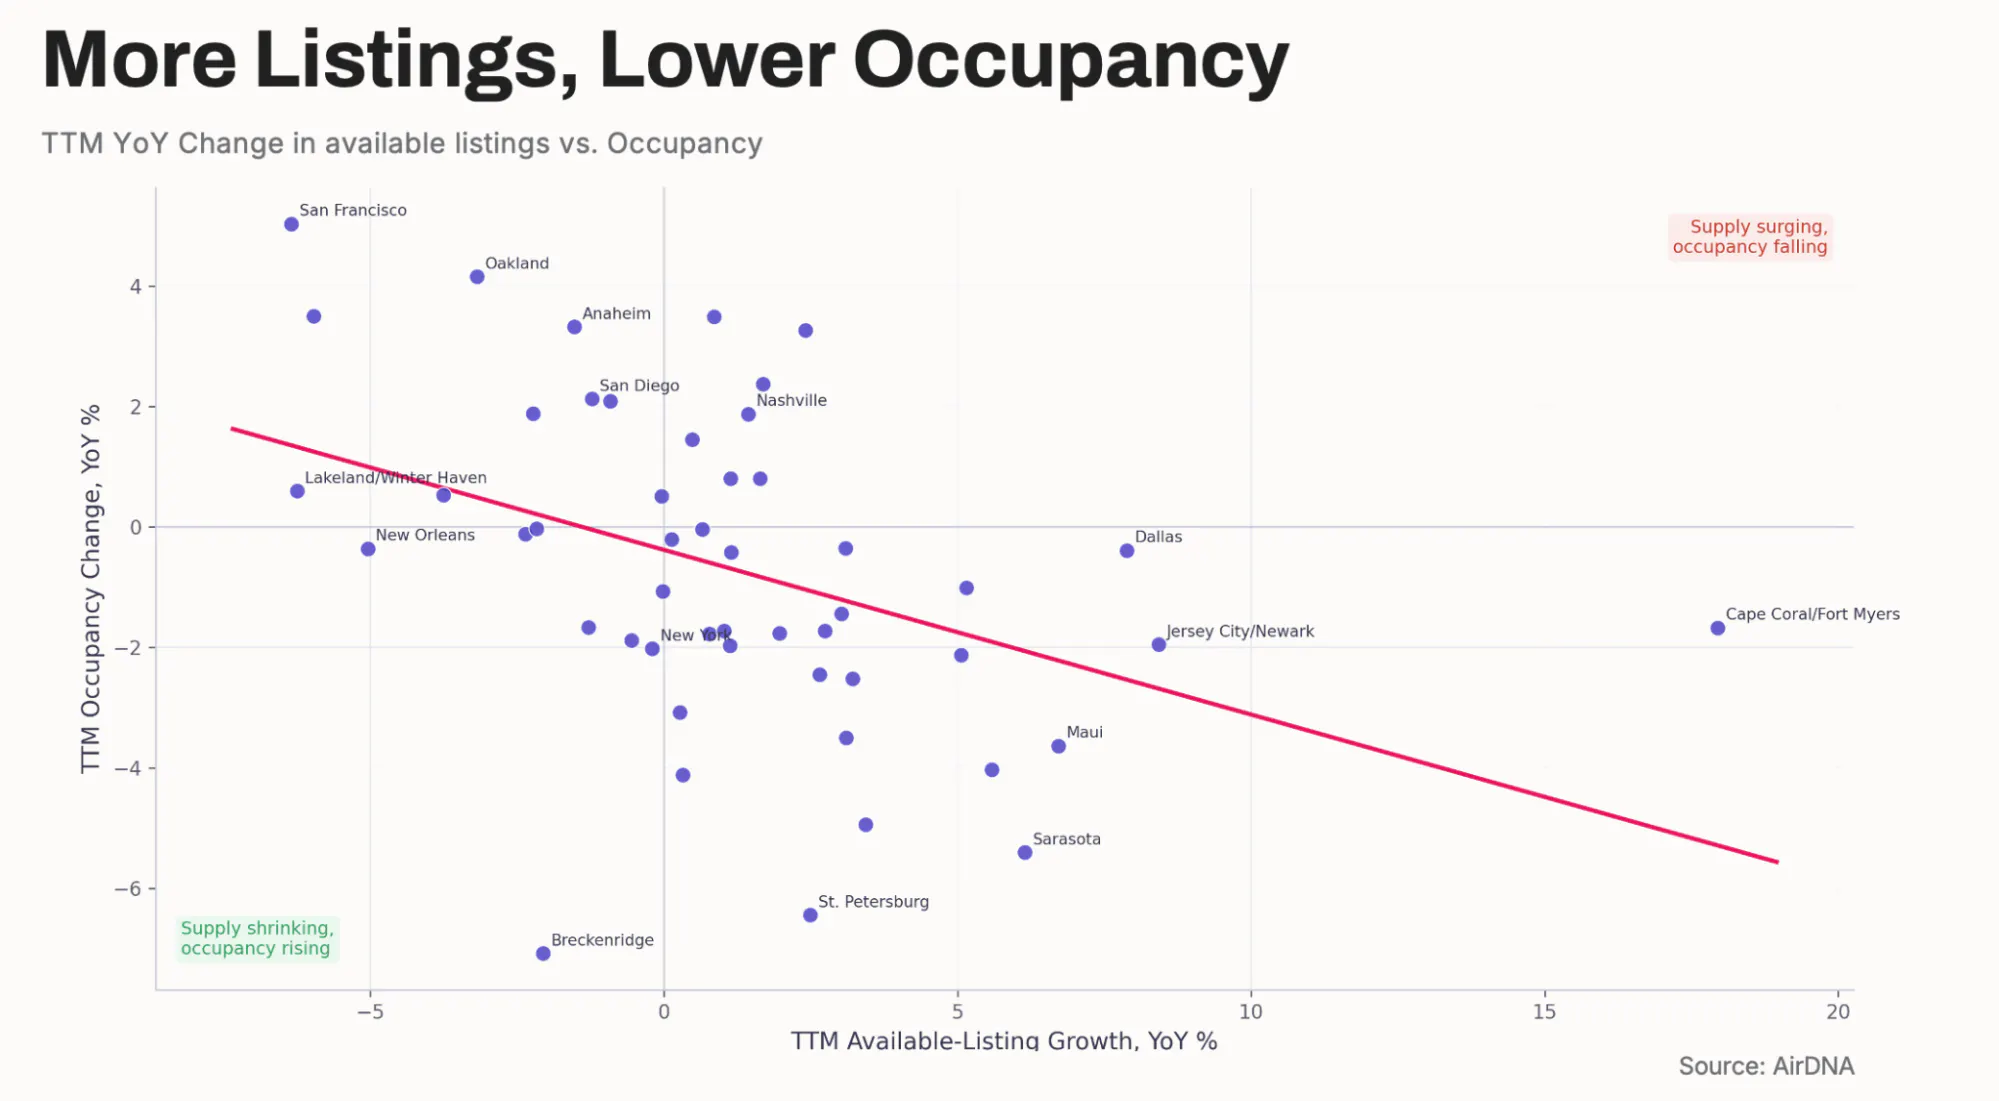
The weakest performers tell the opposite story. Florida Gulf Coast markets, including Cape Coral/Fort Myers, Florida; Sarasota, Florida; and St. Petersburg, Florida, continue to add supply faster than demand, putting pressure on occupancy and RevPAR. Mountain and lake destinations have also struggled after a severe snow drought, with Breckenridge, Colorado and Big Bear, California seeing particularly weak ski-season demand, although both are well positioned to rebound if snowfall returns in 2027.
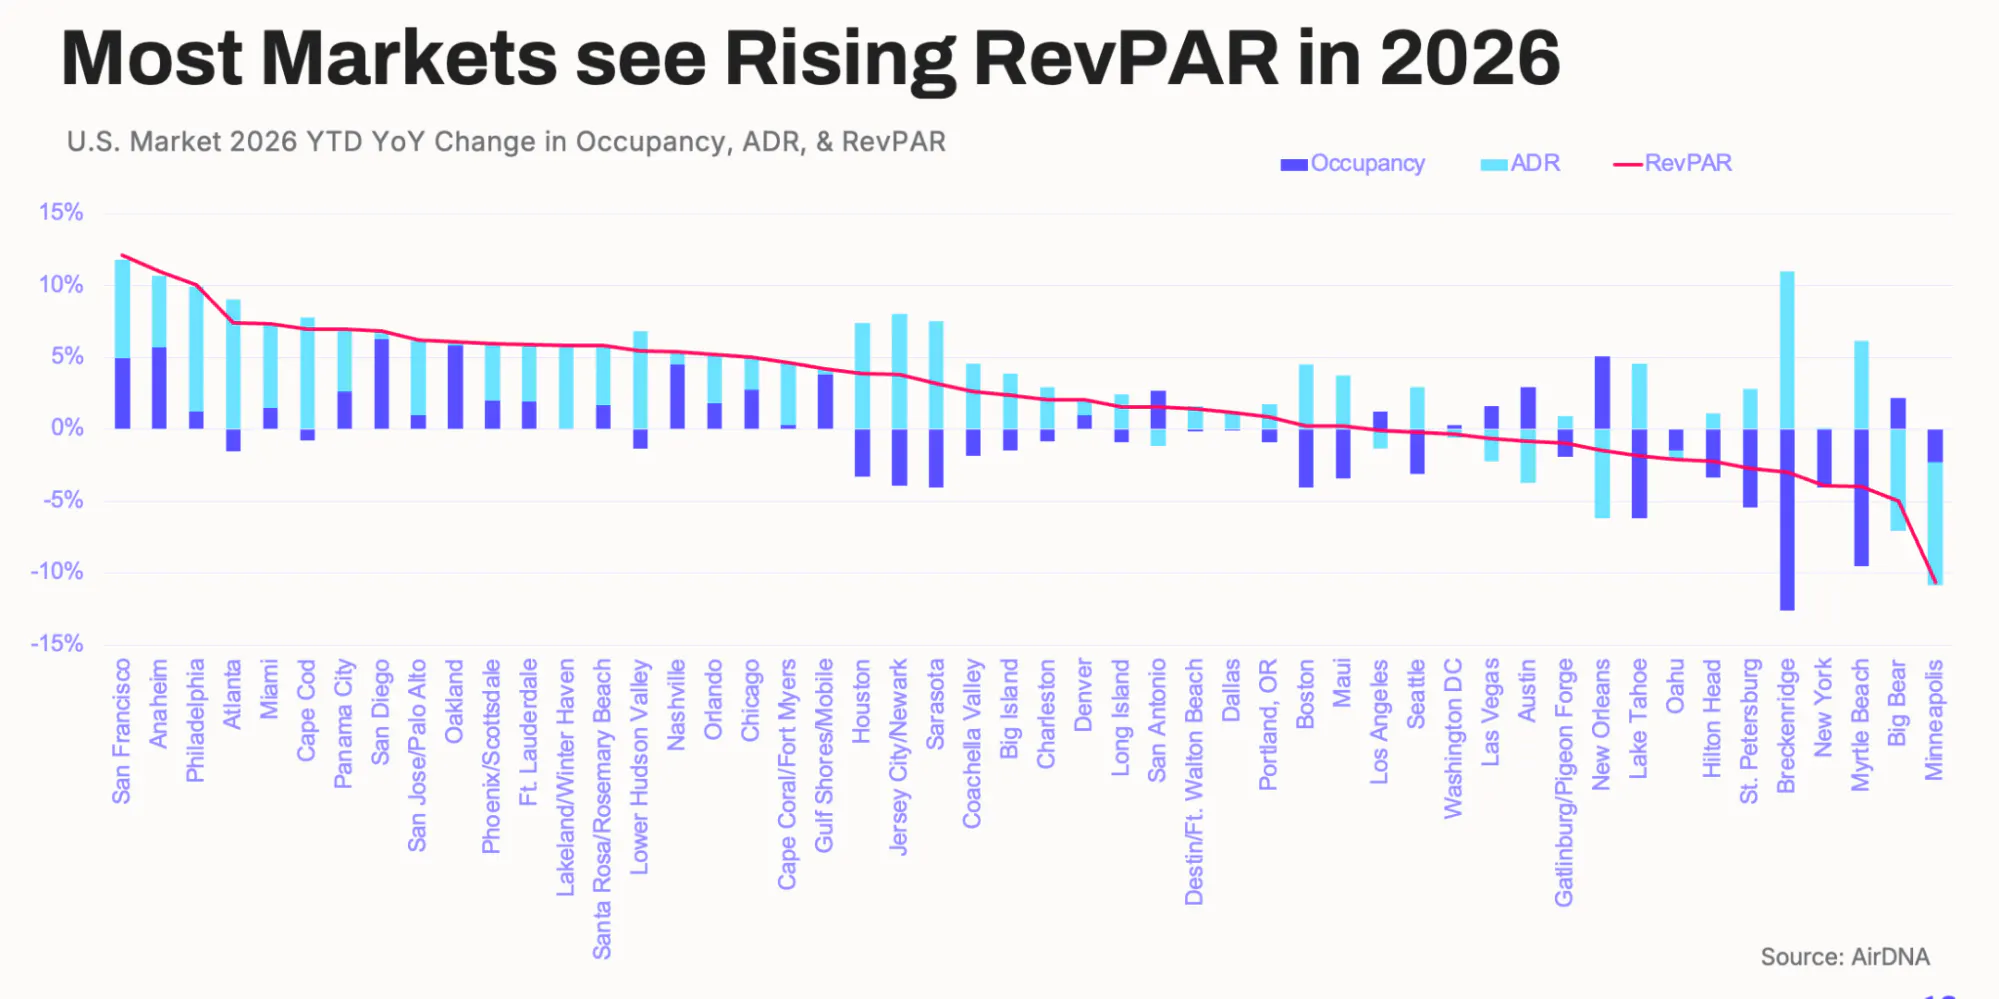
One note of caution for next year's comparisons: Several markets have benefited from one-off events. San Jose/Palo Alto, California, for example, has been boosted by both the Super Bowl and the World Cup, while New Orleans, Louisiana faces difficult comparisons after hosting the Super Bowl in 2025.
The Bottom Line: Operate Well in 2026, Build for 2027
2026 hasn't unfolded according to the script. A war and the energy shock that followed kept inflation and interest rates high, cooled demand, and pushed buyers to the sidelines. But those same forces have made it a better year to own than to buy. With new supply remaining below normal, occupancy is holding just above 57%, and existing hosts have regained meaningful pricing power.
The opportunities, however, are not evenly distributed. Supply remains the dividing line. Markets where listings are shrinking, such as San Francisco, California; Anaheim, California; and San Diego, California, are leading the way, while markets with rapidly growing supply, particularly along Florida's Gulf Coast, continue to lose ground. Larger homes, regional drive-to destinations, and several World Cup host cities are outperforming, while snow-drought mountain markets and destinations that rely heavily on Canadian visitors continue to face headwinds.
From here, the path points up. As the energy shock fades and inflation cools, real incomes, demand, occupancy, and rates should all strengthen into 2027, with the biggest uncertainties remaining the outlook for peace and the path of interest rates.
The takeaway is practical. In 2026, operate sharply, maintain rate discipline, watch local competition closely, and stay flexible on minimum lengths of stay to capture shorter trips. For investors, entry remains expensive, but slower supply growth is protecting today's owners while creating a stronger outlook for 2027. After several years of recalibration, the short-term rental market is heading into next year healthier and better positioned than the headlines suggest.
Frequently Asked Questions
Why is 2026 a better year to own than to buy?
2026 favors owners over buyers because higher mortgage rates have slowed new supply to a crawl. We now expect listings to grow just 2.7% this year, down from the 4.6% projected at the start of the year, giving existing hosts less competition and more pricing power. Mortgage rates above 6% keep entry costs high, so the edge goes to those who already own.
Will occupancy and pricing hold up through 2027?
Yes. We expect occupancy to hold at 57.4% in 2026 and 57.5% in 2027, just above the pre-COVID average of 57%, with RevPAR up about 2.9% this year on the strength of rate. Because supply has slowed more than demand, that resilience should hold, and we expect demand, occupancy, and pricing to strengthen further as inflation cools into 2027.
Which markets are performing best and worst in 2026?
The strongest markets in 2026 are supply-constrained metros like San Francisco (RevPAR +12.1%), Anaheim (+11.0%), and Philadelphia (+10.1%), along with San Diego, Oakland, and San Jose/Palo Alto. The weakest are oversupplied Florida Gulf Coast markets such as Cape Coral/Fort Myers, Sarasota, and St. Petersburg, plus snow-drought mountain and lake destinations like Breckenridge and Big Bear. Supply is the clearest dividing line, with shrinking-listing markets outperforming and fast-growing ones losing ground.
Why has the short-term rental market stayed so resilient?
The market held up because new supply slowed even faster than demand softened. Americans kept prioritizing travel, and the wave of new listings we expected never arrived once the Strait of Hormuz closure drove an energy shock, pushed inflation to 4.2% by May, and kept the Federal Reserve from cutting rates. The net effect is firmer occupancy and more pricing power for existing hosts.
What should hosts do right now?
Operate sharply: hold rate discipline, watch local competition closely, and stay flexible on minimum-stay requirements to capture shorter, later bookings. When pacing looks soft, resist the urge to discount automatically, since that often just lowers rates for guests who would have booked anyway. The hosts who win in 2026 are the ones running tight operations rather than chasing volume on price.
What is the outlook for 2027?
2027 looks stronger than 2026, with the path pointing up. As the energy shock fades and inflation eases, real incomes, demand, occupancy, and rates should all strengthen, and supply should begin to recover as mortgage rates come down. The biggest uncertainties are whether the ceasefire in Iran holds and how quickly interest rates fall.
ARTICLE SUMMARY
A tougher economy has produced an unexpected winner: existing hosts. AirDNA's 2026 Midyear Outlook examines how the U.S. short-term rental market has performed through the first half of the year and what hosts and investors can expect through 2027.
Bram Gallagher
AirDNA Director of Economics and Forecasting
Bram Gallagher is an Economist at AirDNA, specializing in uncovering insights that drive smarter short-term rental decisions. He put his Ph.D. in Economics from the University of Georgia to work researching and forecasting hotel data with CBRE prior to joining AirDNA, as well as teaching economics at a number of universities. In his spare time, Bram enjoys making wooden furniture with hand tools.
