European Review June 2026: Summer Demand Shifts North
Published: July 14, 2026
Last updated: October 22, 2026

Camilo Schmid Rivas
Key Takeaways
- Summer demand remains strong, with July, August, and September all pacing ahead of last year as travelers shift trips later into the season.
- The coolcation trend continues to reshape travel, boosting demand across Northern Europe while traditional Mediterranean destinations soften.
- Supply growth slowed to just 1.3%, its weakest pace in years, as Europe’s short-term rental market continues to mature.
In June, Europe’s short-term rental market continued to cool year over year, even as pricing strengthened. Supply growth slowed to just 1.3%, its most muted pace since April 2022, while demand nights fell 3.3%. With listings still outpacing bookings, occupancy edged down to 60.3%, but hosts continued to show pricing power, pushing ADR up 7.5% to €150.
The outlook for the rest of summer is far more encouraging. July bookings are pacing 5.3% ahead of last year, August is up 5.4%, and September is leading the way at 9.6%. Rather than pulling back, travelers appear to be shifting trips out of a softer June and into the peak and shoulder seasons. They’re also embracing the coolcation trend. As heat waves push temperatures well above seasonal norms, demand is accelerating in northern and Nordic destinations while traditional Mediterranean hotspots such as Spain and Croatia soften.
At a Glance: June 2026 STR Performance in Europe
- Available listings reached 4.07 million, an increase of 1.3% YoY
- Demand nights declined 3.3% YoY to a total of 46.1 million
- Average daily rates (ADR) increased 7.5% YoY to €150.1
- Average occupancy rate fell to 60.3%, down 1.6% YoY
- Revenue per Available Rental Night (RevPAR) increased 4.8% YoY to €90.5
| Metric | June 2025 | June 2026 | YoY Change |
|---|---|---|---|
| Available Listings | 4.02 Million | 4.07 Million | 1.3% |
| Demand Nights | 47.71 Million | 46.13 Million | -3.3% |
| ADR | €139.51 | €150.05 | 7.5% |
| Occupancy | 61.9% | 60.3% | -1.6% |
| RevPAR | €86.37 | €90.52 | 4.8% |
June looks more like a reshuffle than a slowdown. Softer occupancy masked a market that continues to show underlying resilience, with hosts maintaining pricing power and forward bookings pointing to a much stronger second half of the summer. Rather than signaling weaker travel demand, June increasingly looks like a month travelers chose to skip in favor of later departures.
The State of the European Economy
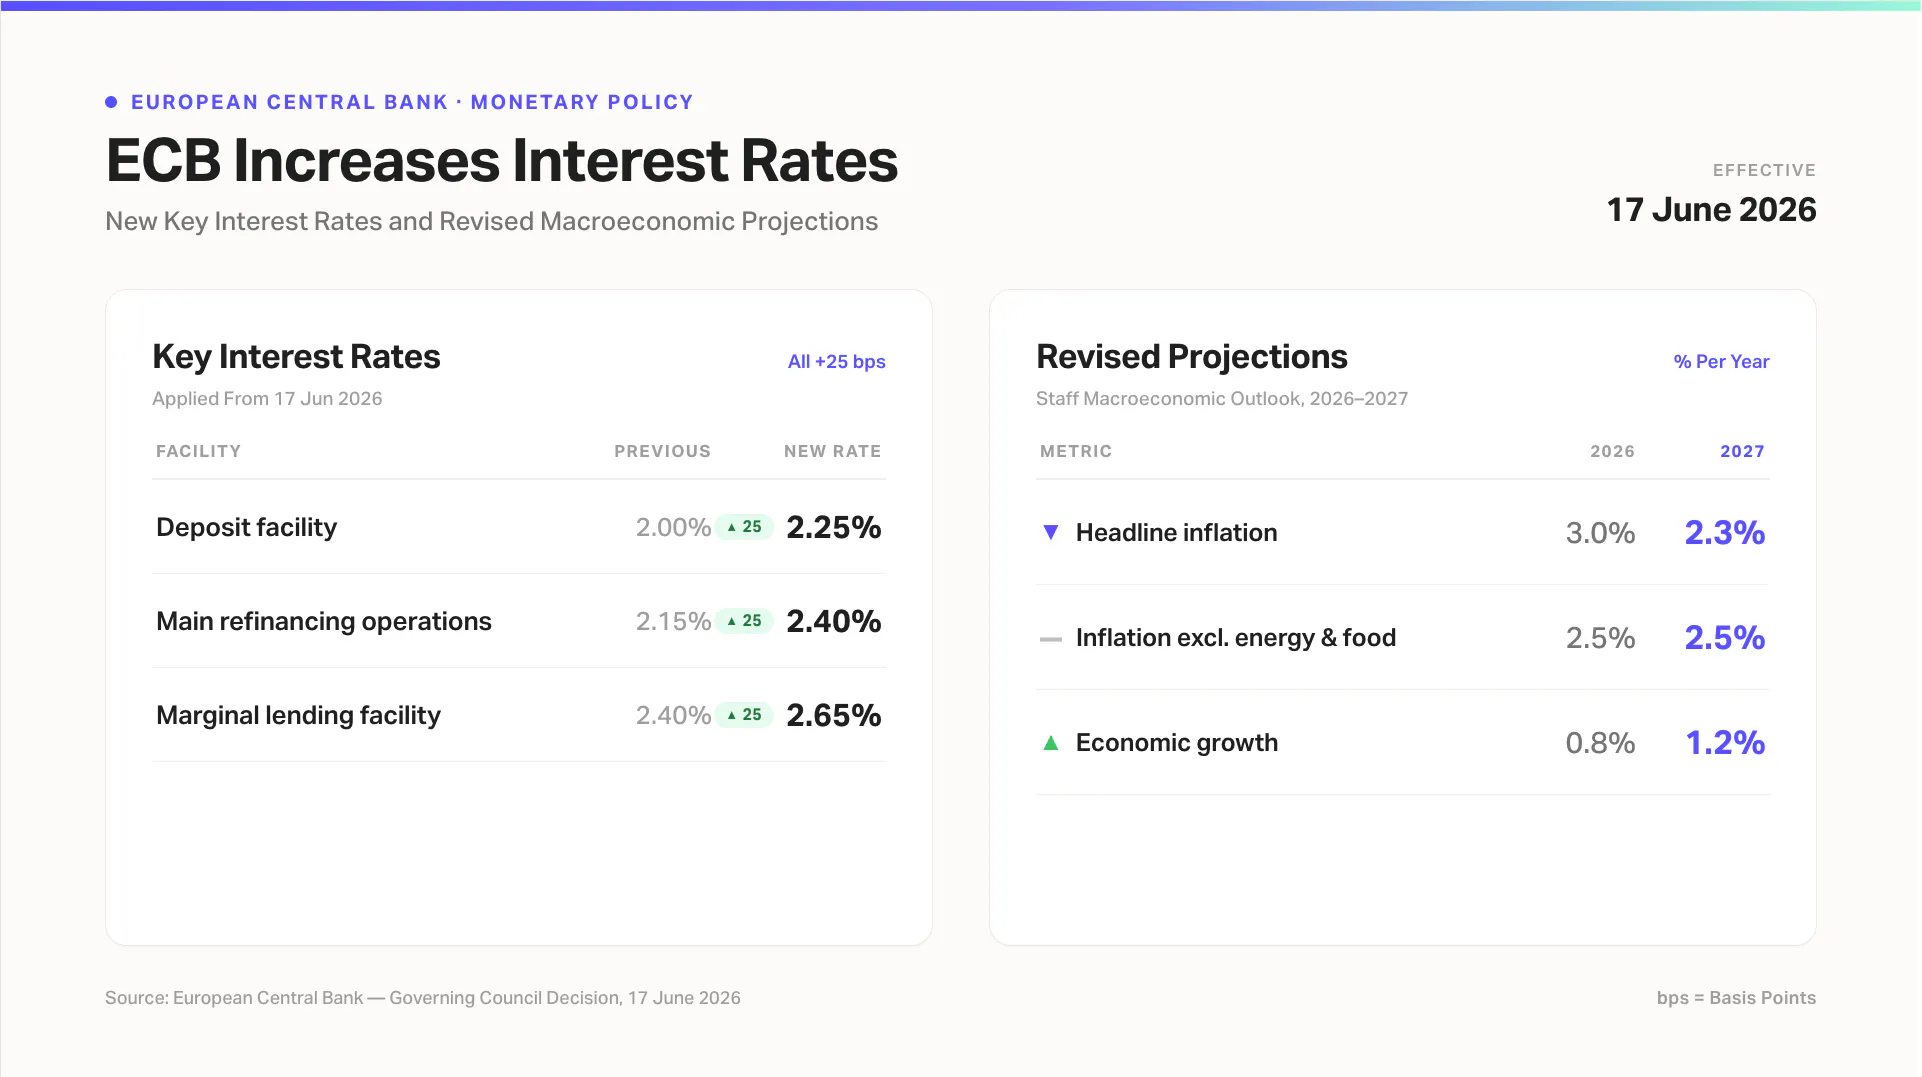
Inflation across the Euro area eased to 2.8% in June, down from 3.2% in May, but remained well above the European Central Bank’s (ECB) 2% target. In response, the ECB raised interest rates by 25 basis points on June 17, ending a year of stable rates. With the conflict in the Middle East pushing up energy prices and adding inflationary pressure, the decision came as little surprise.
The ECB expects headline inflation to average 3.0% in 2026 before easing to 2.3% in 2027, while economic growth is forecast to improve modestly from 0.8% in 2026 to 1.2% in 2027.
The broader picture is mixed. Economic sentiment improved to its highest level since the conflict in the Middle East began, but hiring expectations fell to their lowest point since November 2020, pointing to a softening labor market.
So far, none of that has derailed travel demand. Despite higher borrowing costs and more expensive travel, bookings continue to pace ahead of last year, with July and August up 5.3% and 5.4%, while September is leading the way at 9.6%. For now, Europeans appear to be adjusting when they travel rather than whether they travel.
Steady Supply Growth as Summer Approaches
Available listing growth in Europe continued to slow through June, with listings reaching 4.1 million, up just 1.3% year over year. That’s down from 2.1% in May and marks the slowest pace of supply growth since April 2022.
This continues a trend that has been building over the past several years. Following the rapid expansion seen in 2024, year-over-year growth has become more muted as the European market matures and comparisons become tougher. Supply growth is now more in line with mature markets such as the United States, which recorded 2% growth in June.
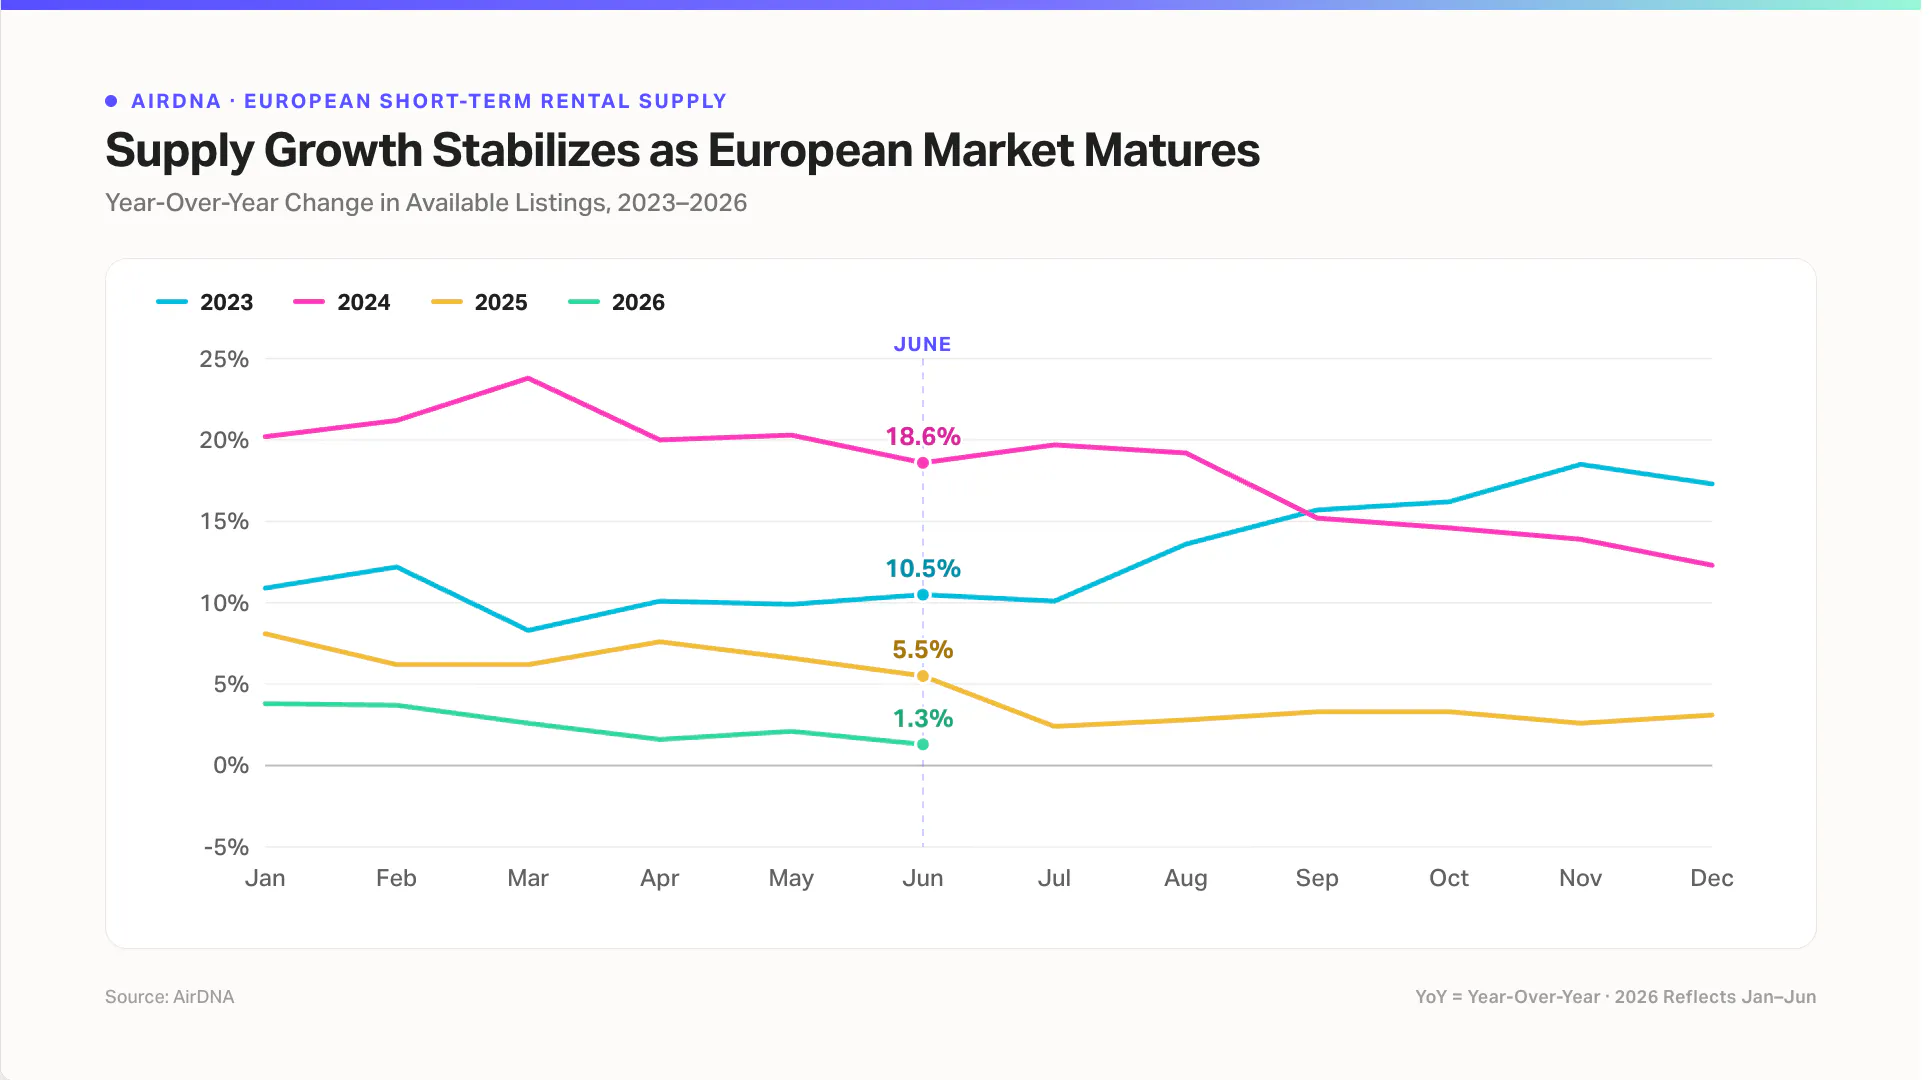
A higher comparison base is only part of the story. Europe also recorded its lowest number of new listings for the month of June in four years. As the table below shows, 140,000 new listings entered the market in June 2026, compared with 150,000 in 2025 and more than 180,000 in both 2023 and 2024. The three-month moving average also slowed to 7.1%, reinforcing the broader trend toward slower supply growth.
| Period | New Listings | % Change |
|---|---|---|
| June 2026 | 140,000 | - |
| June 2025 | 150,000 | -6.7% |
| June 2024 | 178,000 | -21.3% |
| June 2023 | 182,000 | -23.1% |
Supply growth across Europe’s top 20 markets remained mixed. The five largest markets grew just 0.7% year over year, well below the wider European pace, largely because available listings in Spain fell 12.5% following the delisting efforts that began in the second half of 2025. Excluding Spain, the region’s largest markets continued to grow steadily, led by the United Kingdom (+3.6%), Italy (+3.4%), France (+2.9%), and Germany (+2.7%).
Among markets with more than 75,000 listings, Croatia and Greece continued to contract, while Portugal, Poland, and Denmark posted healthy growth, with Poland leading at 7.2%. Croatia’s contraction reflects a longer-running slowdown following softer demand, while Greece has continued to shrink since the October 2025 regulations aimed at improving market quality removed lower-quality listings.
Mid-sized and emerging markets continued to drive Europe’s supply growth. Markets with more than 50,000 listings expanded 4.6% year over year, led by Sweden (+8.3%) and Norway (+8.0%). Smaller markets also grew strongly, with Finland (+11.3%) and the Czech Republic (+8.9%) leading the way, while more mature markets such as Switzerland and the Netherlands continued to grow at a gentler pace.
| Cluster | Country | Available Listings (Jun 2026) | YoY Change |
|---|---|---|---|
| Top 5 Nations | France | 1.06 Million | 2.9% |
| Italy | 556 Thousand | 3.4% | |
| United Kingdom | 404 Thousand | 3.6% | |
| Spain | 382 Thousand | -12.5% | |
| Germany | 363 Thousand | 2.7% | |
| >75 Thousand Available Listings | Croatia | 176 Thousand | -3.4% |
| Greece | 156 Thousand | -2.5% | |
| Portugal | 121 Thousand | 3.9% | |
| Poland | 87 Thousand | 7.2% | |
| Denmark | 78 Thousand | 6.2% | |
| >50 Thousand Listings | Norway | 72 Thousand | 8.0% |
| Sweden | 65 Thousand | 8.3% | |
| Austria | 63 Thousand | 1.9% | |
| Netherlands | 53 Thousand | 0.8% | |
| Switzerland | 53 Thousand | 2.8% | |
| <50 Thousand Listings | Belgium | 40 Thousand | -3.3% |
| Ireland | 29 Thousand | 4.1% | |
| Finland | 29 Thousand | 11.3% | |
| Czech Republic | 26 Thousand | 8.9% | |
| Hungary | 22 Thousand | -2.1% |
Travelers Are Booking Later, Not Less
Demand nights in Europe fell 3.3% year over year to 46 million nights, slightly better than the year-to-date decline of 4%. Nights Booked, which measures reservations made during the reporting month for current and future stays, also declined for the eleventh consecutive month, down 1.6% year over year. Looking across the first half of the year, both Q1 and Q2 posted remarkably similar declines, suggesting a steady softening in demand rather than a market that’s deteriorating further.
Performance varied across Europe’s largest markets. Italy stood out for a second consecutive month, with Nights Booked up 4.4% while Demand Nights remained broadly flat. The United Kingdom also held steady, while Spain, Germany, and France all recorded weaker booking activity.
The current softness, however, only tells part of the story. Several markets still posted positive booking growth in June, including Finland (+10.3%), Portugal (+2.9%), Poland (+2.9%), Denmark (+3.0%), and the Czech Republic (+3.7%), suggesting travelers are still booking, just differently.
The clearest signal comes from the months ahead. Q3 demand pacing remains strong across much of Europe, led by Denmark (+30.2%), Finland (+21.0%), Sweden (+14.3%), and Poland (+12.2%). Larger markets are performing well too, with Italy (+10.7%) and the United Kingdom (+9.1%) both pacing comfortably ahead of last year.
Taken together, softer June demand and stronger Q3 pacing point to a behavioral shift rather than a genuine slowdown. Travelers appear to be delaying trips into the peak and shoulder seasons instead of canceling them. That interpretation is reinforced by a tougher comparison with 2025, which set an unusually high benchmark for June. Against a backdrop of higher travel costs and persistent inflation, the European short-term rental market looks less like it’s weakening and more like it’s shifting further into the summer.
| Cluster | Country | Nights Booked YoY Change | Demand Nights YoY Change | Demand Pacing Q3 YoY Change |
|---|---|---|---|---|
| Top 5 Nations | France | -3.2% | -3.9% | 6.3% |
| Italy | 4.4% | 0.7% | 10.7% | |
| United Kingdom | -1.0% | 0.8% | 9.1% | |
| Spain | -9.4% | -9.4% | -3.7% | |
| Germany | -5.6% | -9.9% | 1.0% | |
| >75 Thousand Available Listings | Croatia | -7.0% | -14.0% | -2.8% |
| Greece | 1.1% | -2.1% | 6.4% | |
| Portugal | 2.9% | -3.4% | 3.6% | |
| Poland | 2.9% | 4.2% | 12.2% | |
| Denmark | 3.0% | 4.2% | 30.2% | |
| >50 Thousand Listings | Norway | -3.4% | 5.0% | 10.6% |
| Sweden | -1.7% | 4.9% | 14.3% | |
| Austria | -3.5% | -8.2% | 0.6% | |
| Netherlands | -3.1% | -4.9% | 9.0% | |
| Switzerland | 0.7% | -6.0% | 3.6% | |
| <50 Thousand Listings | Belgium | -7.4% | -6.0% | 7.9% |
| Ireland | -4.1% | 0.2% | 8.4% | |
| Finland | 10.3% | 4.5% | 21.0% | |
| Czech Republic | 3.7% | -1.1% | 8.8% | |
| Hungary | -10.0% | -6.2% | 3.0% |
Supply Growth Continues to Pressure Occupancy
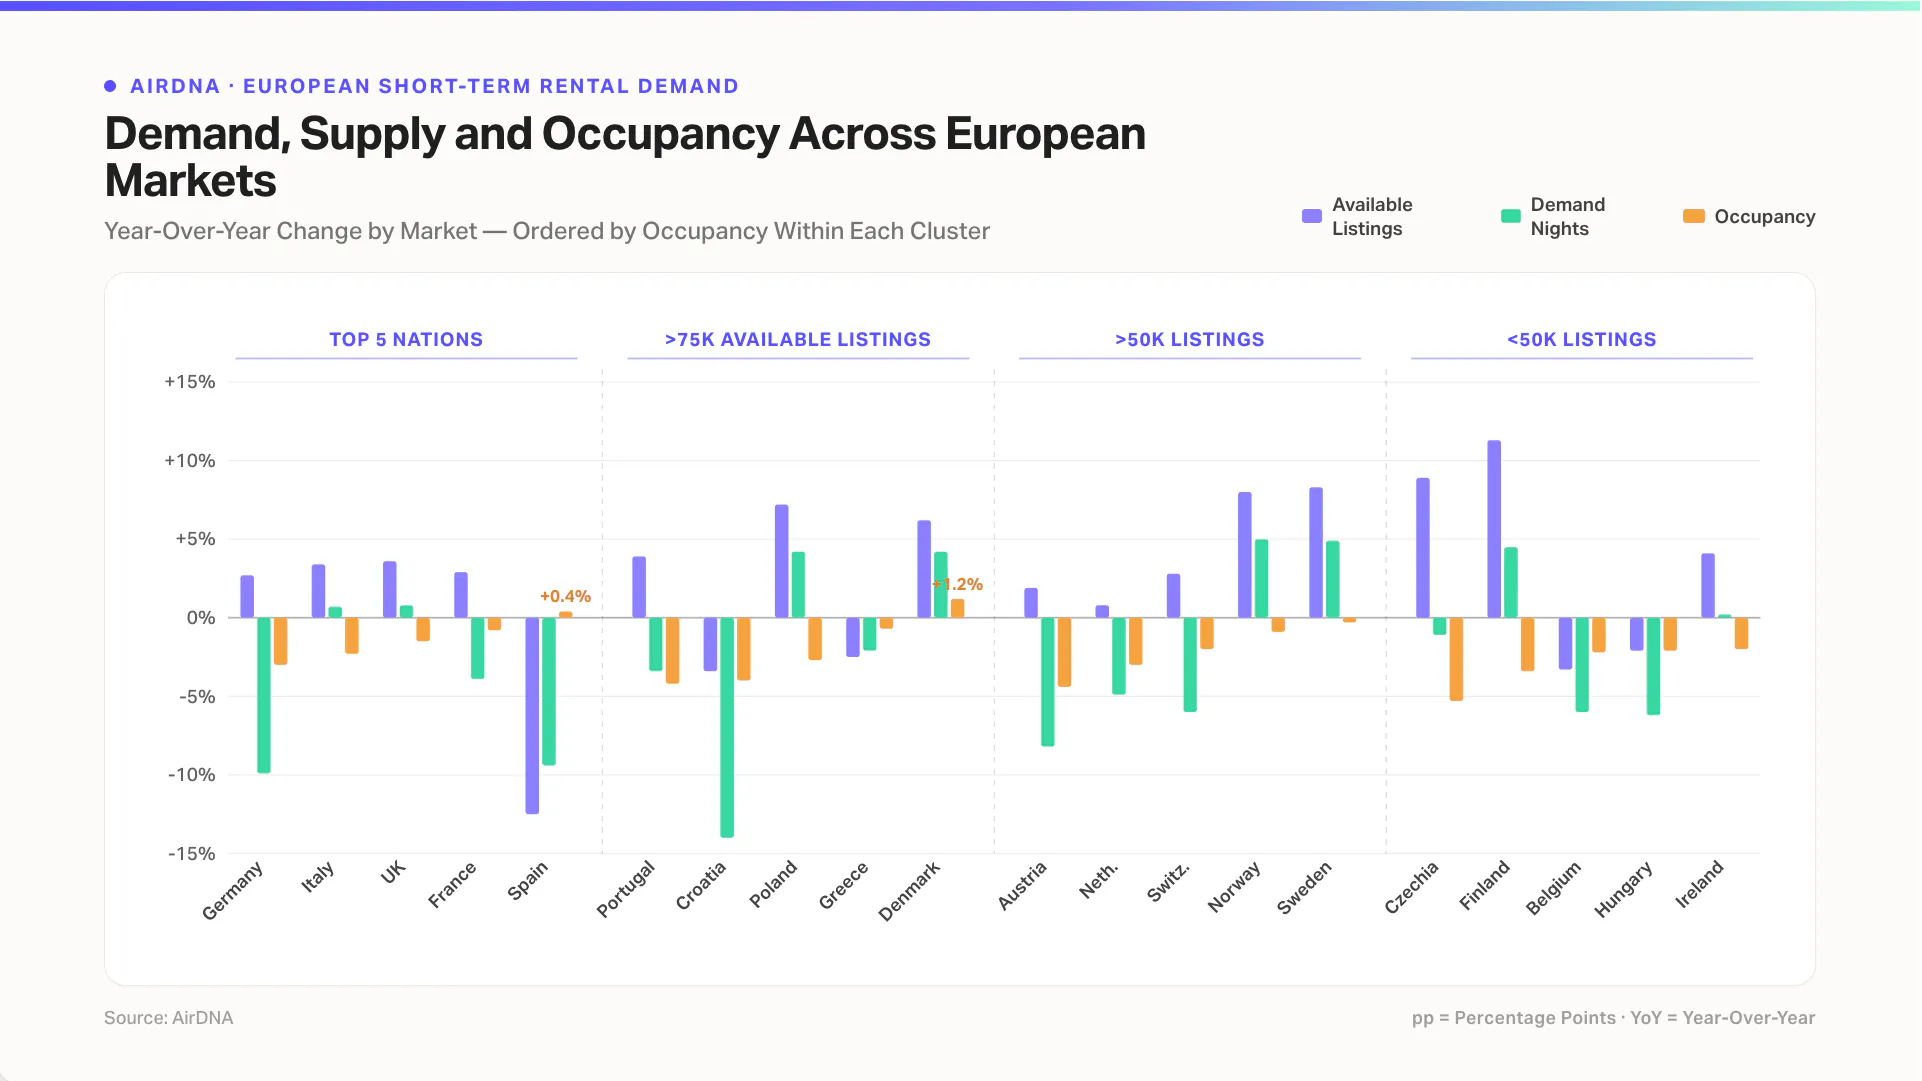
Demand nights fell 3.3% year over year, while available listings increased 1.3%, pushing European occupancy down 1.6% to 60.3%. The pattern was widespread, with 18 of Europe’s top 20 markets recording lower occupancy as supply continued to outpace demand.
The decline was visible across every price tier, although luxury listings proved the most resilient, slipping just 0.9% compared with 2.2% for Economy listings and 3.1% for Budget listings. Larger properties with six or more bedrooms recorded the steepest decline, down 6.9%, while smaller listings fell 2.3%. Together, those trends suggest more price-sensitive travelers were the most likely to delay trips in June.
The same pattern played out across Europe’s top 20 markets. In most countries, available listings grew faster than demand, or contracted more slowly, leaving occupancy under pressure. The sharpest declines came in smaller, faster-growing markets. The Czech Republic posted the largest drop, down 5.3 percentage points, followed by Austria (-4.4), Portugal (-4.2), and Finland (-3.4), each reflecting rapid supply growth that demand couldn’t fully absorb.
Larger markets proved more resilient. Europe’s five biggest markets saw occupancy fall by just 1.4 percentage points, compared with 2.5 points among markets with more than 75,000 listings, 2.2 points in the next tier, and 2.9 points among the smallest markets.
Spain was the notable exception. It was the only one of Europe’s five largest markets to post an occupancy gain, edging up 0.4 percentage points after available listings fell 12.5% following the delisting efforts that began last year. Denmark was the only other top-20 market to record an occupancy increase, up 1.2%, as available listing nights grew more slowly than available listings, helping occupancy edge higher ahead of the peak summer season.
ADR Continues to Outpace the Repeat Rent Index
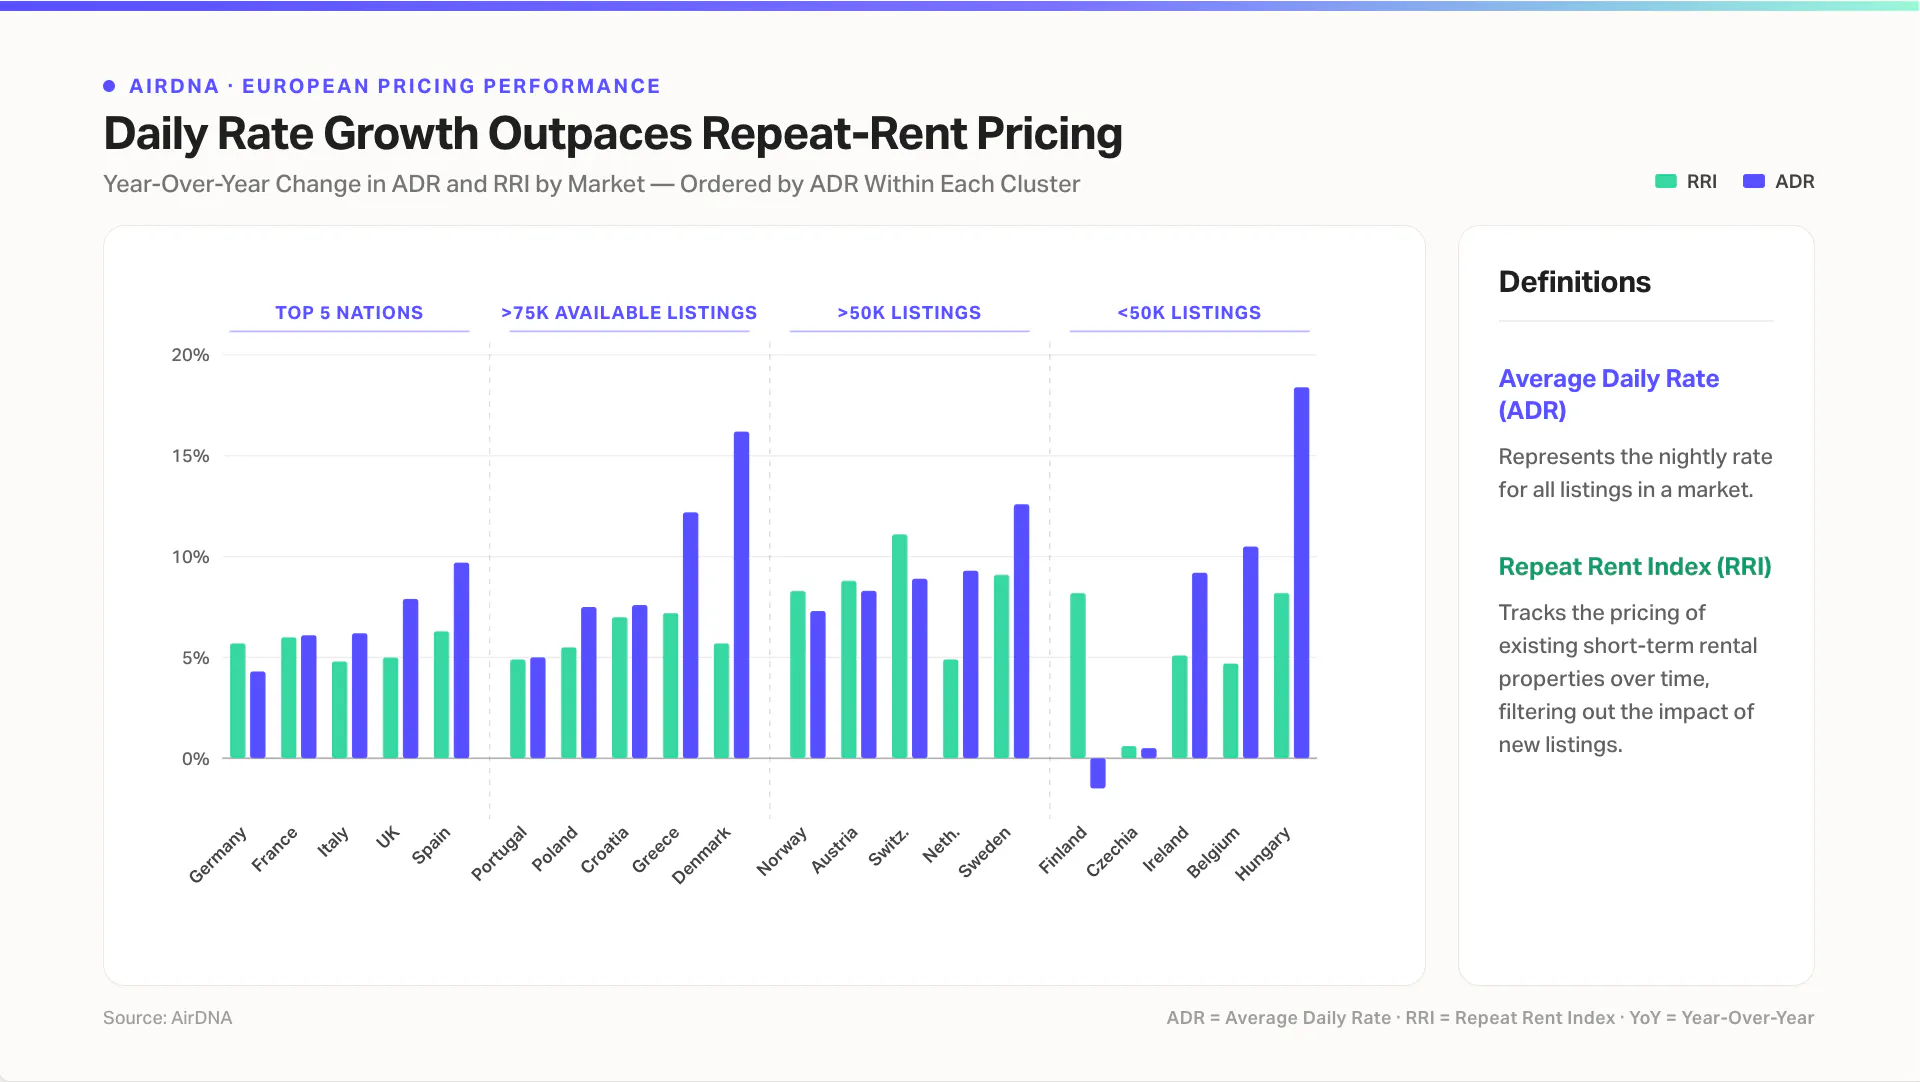
Average daily rates (ADR) in Europe continued their recovery for a fourth consecutive month, rising 7.5% year over year to €150. The Repeat Rent Index (RRI), which tracks pricing changes among existing operators and excludes the impact of new listings, also had a strong month, increasing 6.0%. The gap between the two suggests that, despite softer demand and continued supply growth, hosts are maintaining pricing power while the mix of booked properties has shifted toward higher-priced inventory.
Where ADR grows noticeably faster than the RRI, the booked mix has typically shifted toward higher-priced listings. Denmark is the clearest example, with ADR rising 16.2% compared with 5.7% for the RRI. Belgium, the Netherlands, and the United Kingdom show the same pattern, with overall market rates increasing faster than prices among existing operators. Greece stands out as well. ADR increased 12.2% while the RRI rose 7.2%, suggesting pricing strength was driven less by hosts raising rates and more by lower-priced listings leaving the market following the October 2025 regulatory changes.
Elsewhere, ADR and the RRI moved much more closely together, indicating that pricing gains came primarily from existing hosts. France is the clearest example, with both measures increasing by around 6%, while Portugal and the Czech Republic showed a similar pattern.
A handful of markets told the opposite story, with the RRI outpacing ADR. Germany, Switzerland, Norway, and Austria all saw existing hosts raise prices faster than the market average, suggesting newer supply entered at lower price points. Finland provides the clearest example. ADR fell 1.5% even as the RRI rose 8.2%, exactly what you’d expect in a market where listings increased 11.3% year over year. Newer, lower-priced supply pulled average rates down while established hosts continued to increase prices.
European Summer Demand
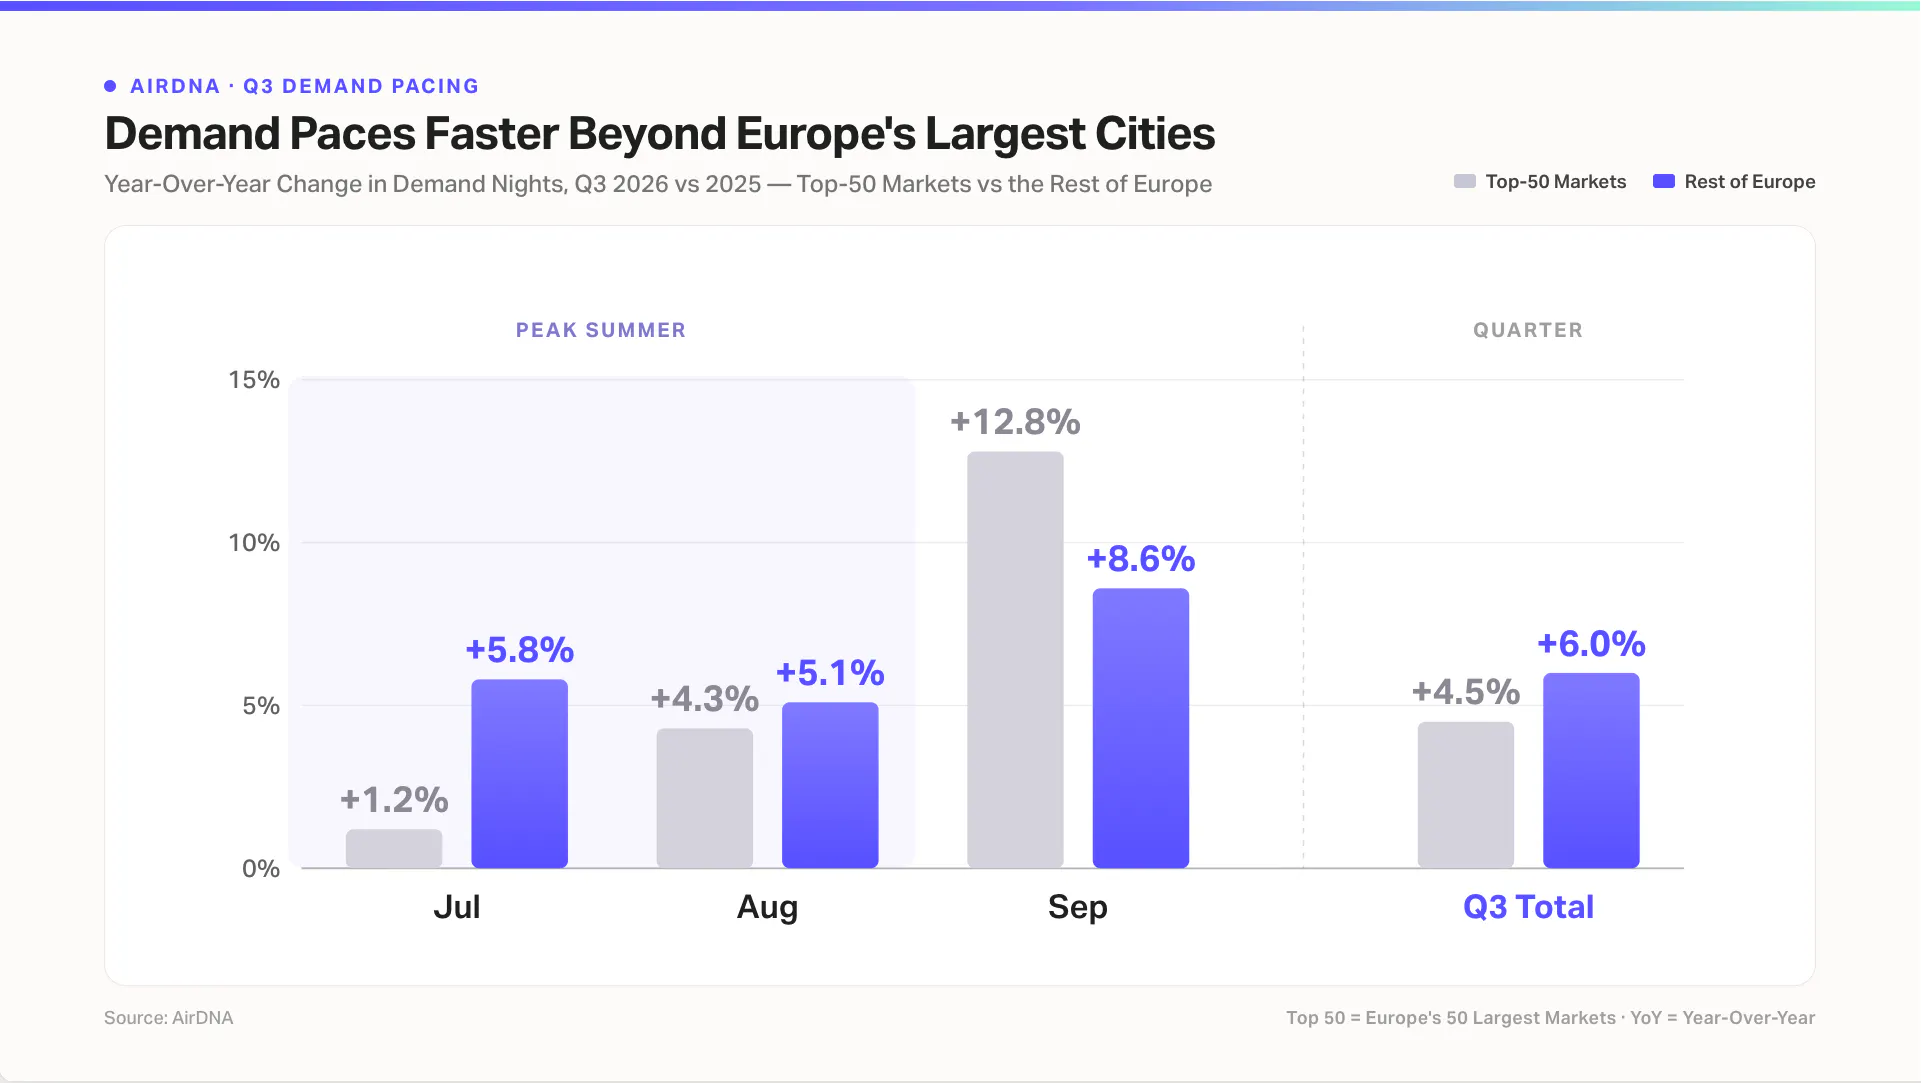
With heat waves across Europe and travel costs remaining high, there are reasons to doubt a strong summer performance. Yet summer demand continues to pace well ahead of last year, with demand nights up 5.3% in July and 5.4% in August, suggesting travelers are shifting trips out of June and into the peak summer months.
While summer pacing is strong across the board, where people are traveling is changing. Comparing year-over-year demand across Europe’s Top 50 largest cities with the rest of the region reveals a clear preference for non-city destinations during the peak summer months, before demand returns to cities in September as temperatures cool. The difference is most striking in July, when the Top 50 Cities are pacing just 1.2% ahead of last year compared with 5.8% across the rest of Europe. With heat waves arriving at the end of June and continuing into July, this will be an important trend to watch through the remainder of the summer.
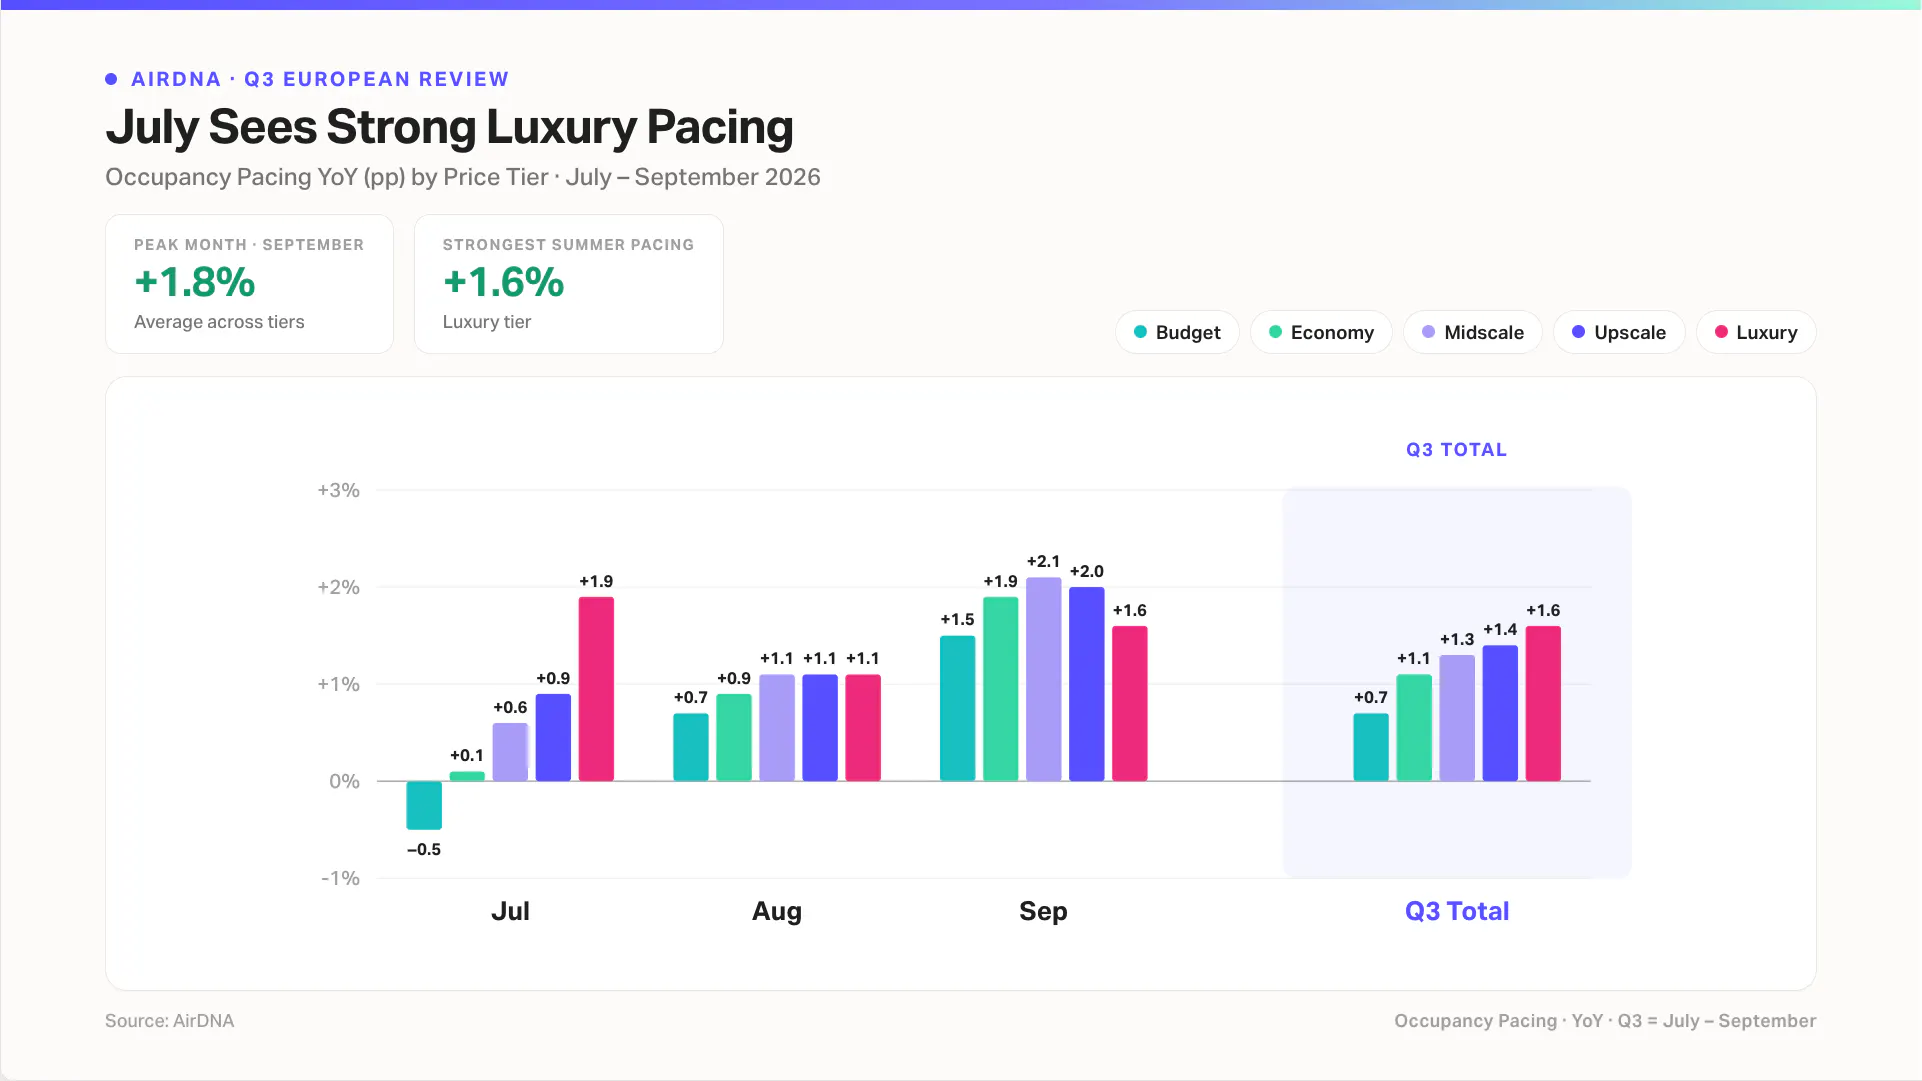
Looking ahead to Q3 by price tier, occupancy pacing turns positive across every segment, although the strongest performance shifts as the quarter progresses. In July, Luxury properties lead, pacing 1.9 percentage points ahead of last year, while Budget properties trail slightly. That pattern makes sense. July is the peak holiday season, and higher-end travelers tend to be less sensitive to pricing pressure, so demand appears there first.
By August, the gap narrows considerably, with every price tier pacing between 0.7 and 1.1 percentage points ahead of last year, suggesting peak summer demand is broad-based rather than concentrated among higher-end travelers.
September tells the most interesting story. Momentum shifts toward the Midscale and Economy segments, with both pacing ahead of Luxury. As the shoulder season begins, more price-conscious travelers appear to be timing trips for the quieter, more affordable end of the quarter, reinforcing the broader shift toward off-peak travel. Across the full quarter, every price tier remains ahead of last year, pointing to a healthy summer season rather than strength concentrated in a single segment.
The Rise of the European Coolcation
June was one of the hottest months on record across Europe, with temperatures well above seasonal averages. Southern markets such as Spain and Greece saw extreme heat, while France and the United Kingdom were around 3°C warmer than the long-term average, according to Copernicus, the EU’s climate monitoring service. After another exceptionally hot start to summer, the shift in traveler behavior is becoming harder to ignore.
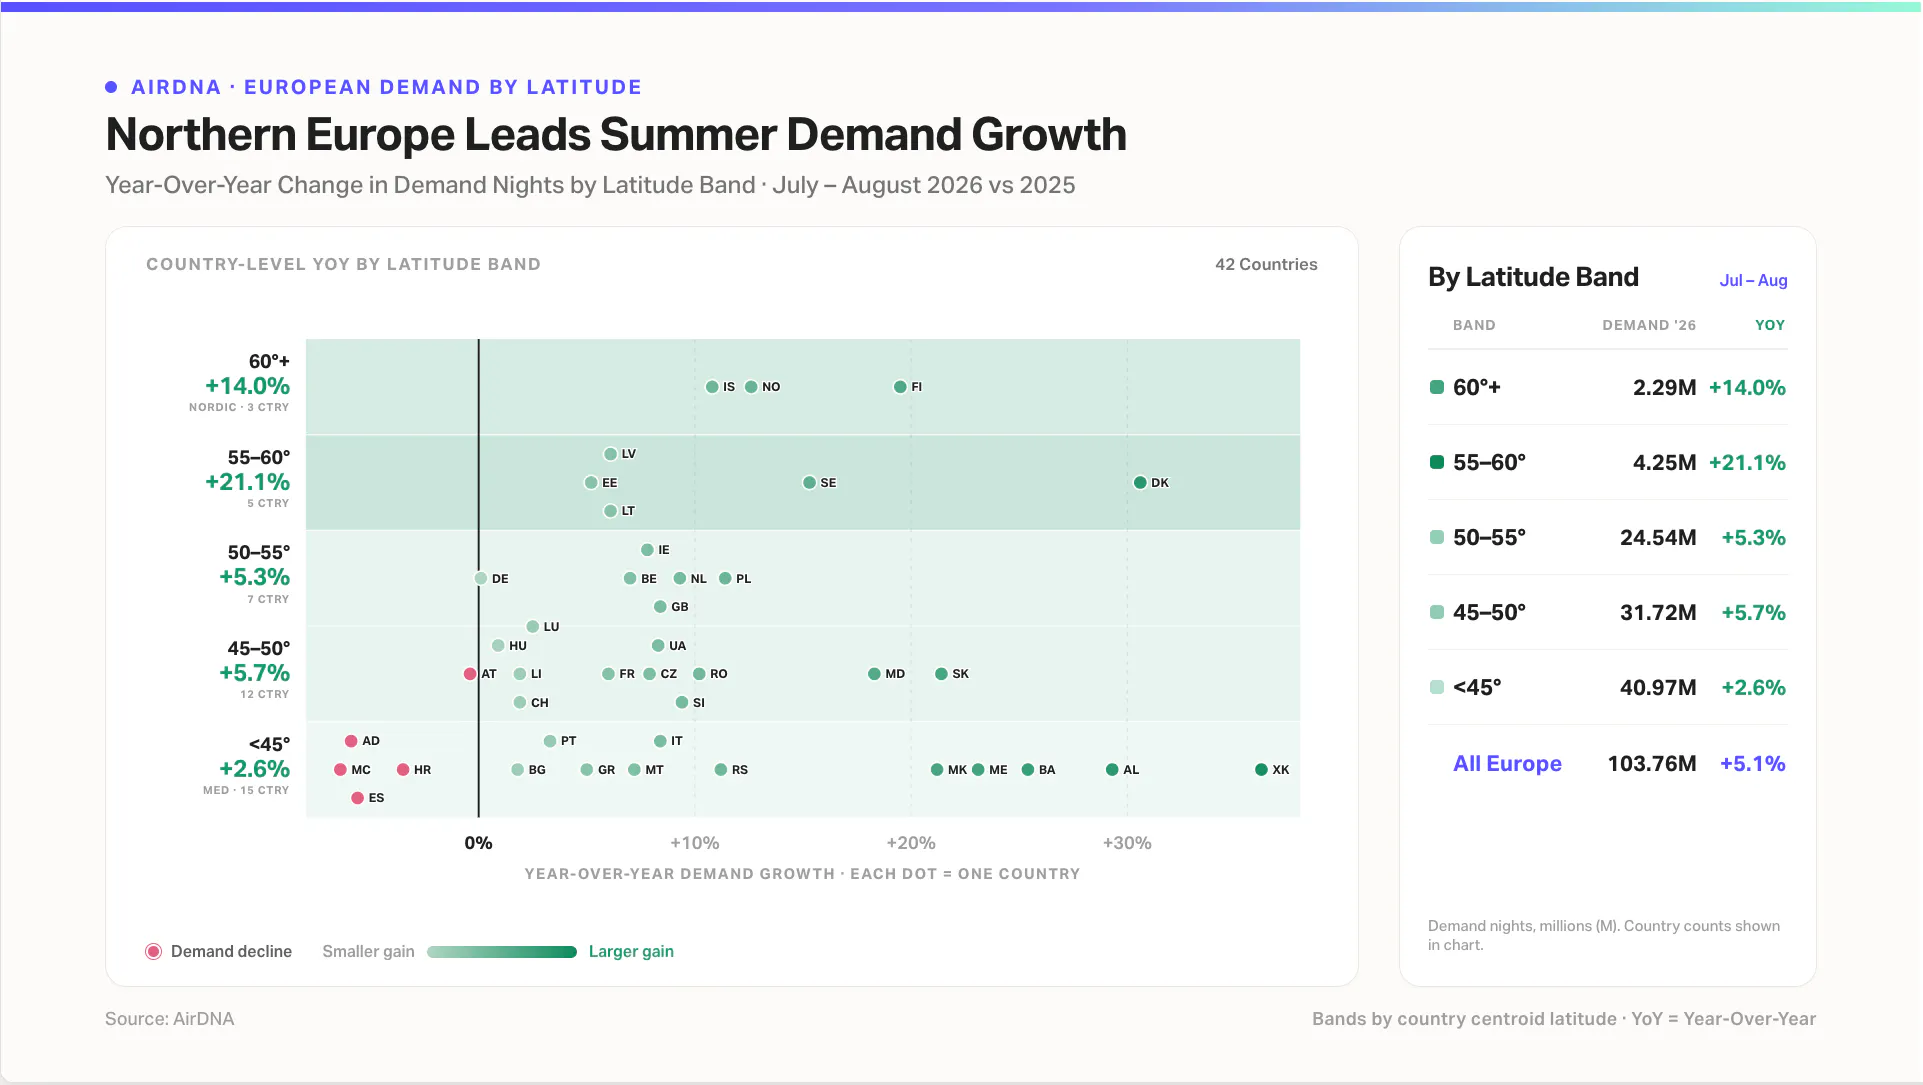
As travelers experience these higher temperatures year after year, the coolcation trend, swapping sweltering summer hotspots for cooler, milder destinations, continues to gather pace. Looking at summer demand by latitude, the pattern is clear. Europe’s northernmost markets are outperforming the rest of the continent, suggesting changing travel preferences are helping to drive demand.
Looking specifically at July and August pacing, regions above 55° latitude are pacing 14% to 21% ahead of last year. By contrast, traditional Mediterranean destinations are facing headwinds, with bookings in Spain and Croatia softening by 6% and 4%, respectively. The trend becomes even clearer at the local level. The Danish coastline, Norwegian fjords, and Alpine destinations are among Europe’s fastest-growing summer markets, while parts of Spain’s coastline and islands are seeing double-digit declines. Increasingly, travelers are choosing higher latitudes and altitudes to escape the intensifying summer heat.
ARTICLE SUMMARY
Europe’s short-term rental market softened in June, but the bigger story lies ahead. Discover how slower supply growth, strong summer pacing, and the coolcation trend are reshaping demand across the continent.
Camilo Schmid Rivas
Senior Research Analyst
Camilo Schmid Rivas is a Senior Research Analyst at AirDNA who brings a uniquely well-rounded perspective to short-term rental analytics. With a background that spans investment, real estate, and business analysis—including roles at Stayery and Sollers Consulting—Camilo has worn many analyst hats, each sharpening his ability to turn complex data into clear, actionable insights. A graduate of École hôtelière de Lausanne, he now channels his multidisciplinary expertise into uncovering trends that drive smarter STR decisions. In his free time, he enjoys playing tennis or scuba diving in or around Barcelona.