

 Calculate Revenue
 Research Markets
 Find For Sale Properties
 Compare My Listing
 STR Revenue Calculator
 Custom Comp Sets
 Submarket Insights
 Custom Search Filters
 Rate Recommendations
 Performance Benchmarking
 Competitor Comparison
 Owner Contact Details
 Property-level performance data
 Tourism Insights
 Real Estate Investment Analytics
 About Us
 Sales
Sales Support
 Press
PressU.S. Review September 2026: Rate Environment Pinches Supply but Helps Occupancy
Published: October 8, 2026

Bram Gallagher
Key Takeaways
- August and September demand grew 2.1% combined, the fastest pace since October 2025, once the Labor Day calendar shift is netted out.
- Listing growth slowed to 1.6% in both months, the lowest since the pandemic, as higher mortgage rates curb new supply.
- Hosts raised rates quickly: ADR rose 7.2% in September, and the Repeat Rent Index (RRI) climbed 7.8%.
As bond yields climb and the labor market softens, the U.S. short-term rental (STR) market keeps moving ahead with greater momentum. Now that we have both August and September data in hand, we can smooth over the whipsaw in demand caused by the Labor Day calendar shift. International hostilities, high energy prices, and soaring interest rates have been answered with recovering demand, occupancy growth, some of the largest rate increases we’ve seen in some time, and improving unit economics for both months, on average.
Not every market is thriving, but the resilience of the U.S. consumer, and in turn the STR market, is a welcome counterweight to a turbulent economy.
At a Glance: Key U.S. STR Performance Metrics for September 2026
- Revenue per available rental (RevPAR) increased 15.3% year over year (YoY) to $136
- Available listings reached 1.74 million, a 1.6% increase YoY
- Demand nights increased 8.1% YoY
- Occupancy averaged 53.6%, up 3.7 percentage points YoY
- Average daily rate (ADR) climbed to $254, up 7.2% YoY
- The Repeat Rent Index (RRI) rose 7.8% YoY
- Total nights booked were down 3.9% from 2025
Economic Outlook: Rising Interest Rates Overshadow a Weak Jobs Report
A disappointing September jobs report pushed back expectations of further Federal Reserve rate hikes. The economy added just 29,000 jobs in September, well short of expectations and the 12-month average of around 45,000 per month. Another 60,000 previously reported jobs were revised out of the July and August totals, and the unemployment rate edged up from 4.1% in August to 4.2% in September.
Hourly earnings are also a concern for consumer spending. They grew 3.0% year over year in September, which almost certainly marks the sixth straight month of falling real hourly earnings. Higher energy prices linked to the conflict in Iran and slightly higher effective tariff rates have kept inflation above 3% since March.
Still, the biggest economic story of the past month is the run-up in interest rates. Ten-year Treasury yields rose 51 basis points over the month, from 4.75% at the end of August to 5.26% at the end of September, according to the Federal Reserve, and were still rising at the time of writing. Rates on 30-year fixed mortgages rose similarly, from 6.66% at the end of August to 7.28% for the week ending October 1, according to Freddie Mac.
U.S. home sales were not particularly strong in 2025, and the National Association of Realtors reports they fell 2.0% in August on higher rates, with similar declines expected for September. A weak housing market over the past three to four years has pushed inventory to its highest level since 2016, but prices are not falling quickly. U.S. STR supply growth in August and September was the weakest since the pandemic, and we don’t expect the slowdown to reverse until housing market conditions loosen.
Supply Growth Slows to 1.6%, the Weakest Since the Pandemic
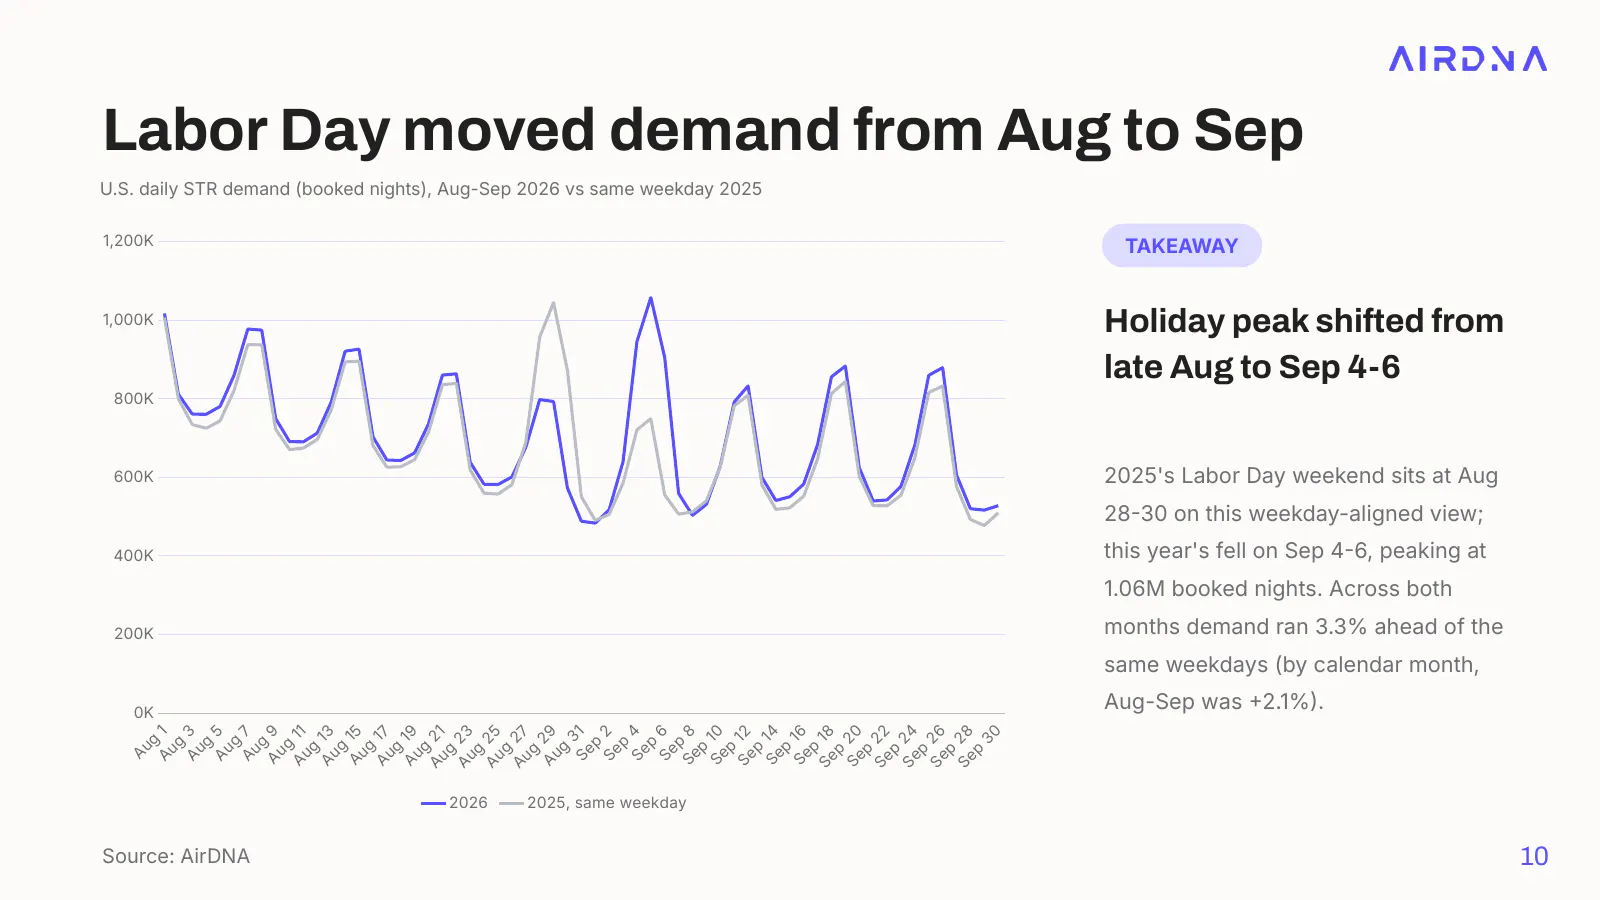
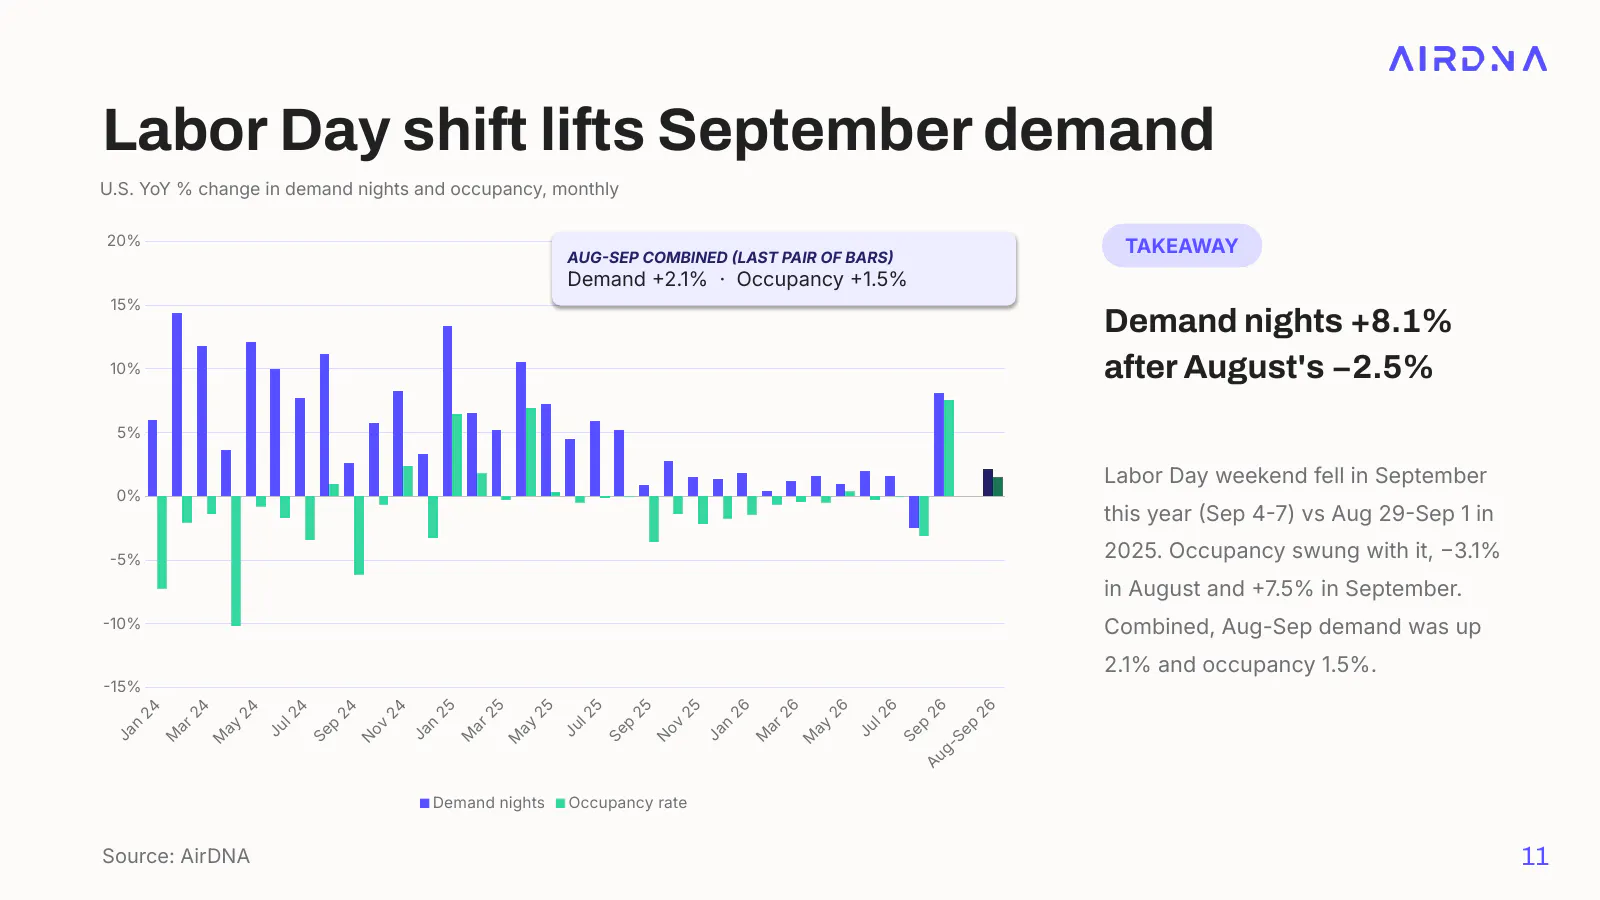
Throughout this month’s report, we look at combined August-September performance. Monthly data keeps the analysis focused on late-breaking trends, but Labor Day weekend moves between August and September from year to year, with dramatic consequences for year-over-year performance. Plotting demand for the past two months shows the problem clearly. August generally performed better in 2026 than in 2025, yet the monthly totals paint August negatively and show large gains in September. Neither reflects the encouraging but moderate growth that occurred across the period as a whole.
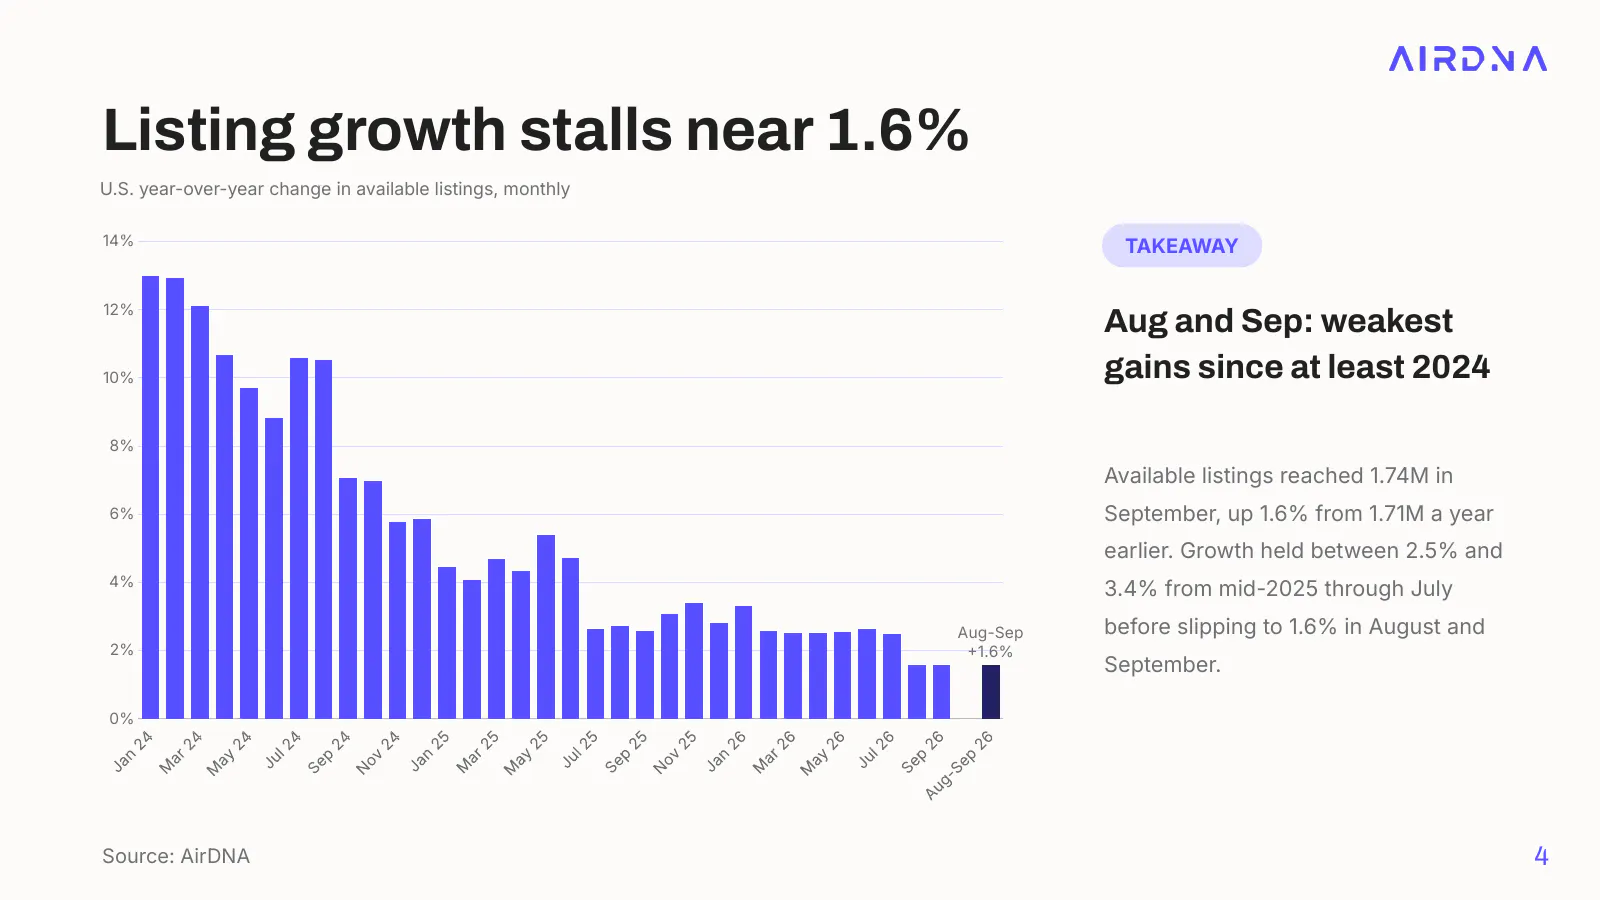
Supply, by contrast, needs no such adjustment. After a small downward revision for August, available listings grew 1.6% year over year in both months, the lowest rate since the pandemic. Listing growth has been slowing since its 2022 highs but had previously stabilized between 2% and 3%.
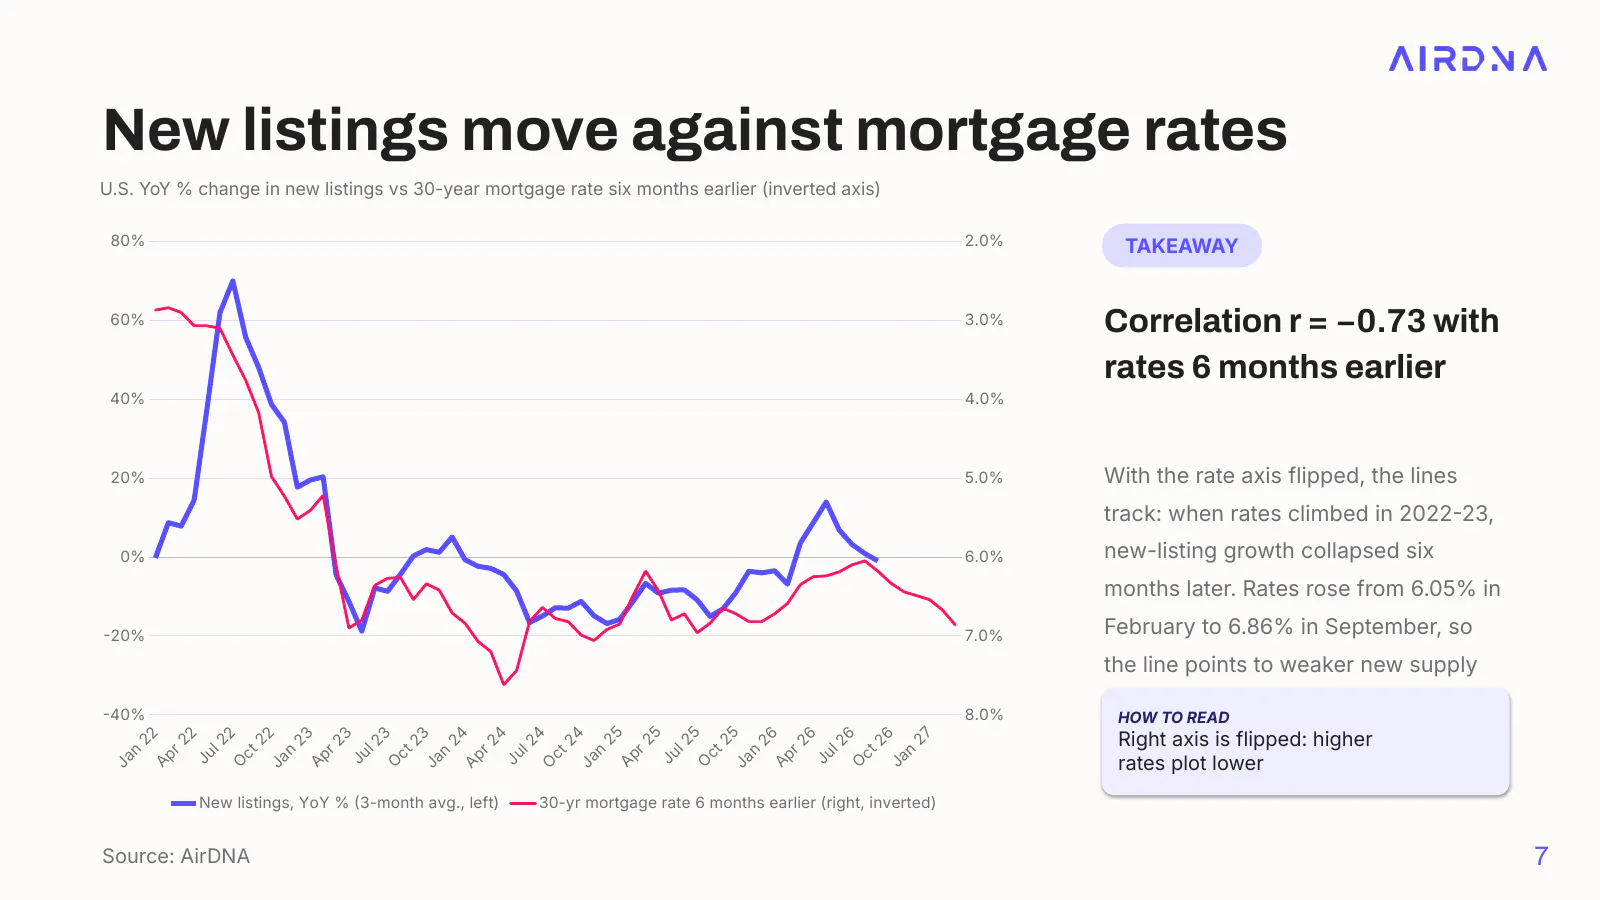
New listings are an important driver of listing growth. We have previously reported a lag of around six months between mortgage rate movements and changes in supply. In addition to new listings front-loading in May, the new listings motivated by the brief dip below 6% in mortgage rates in February appear to have dried up. September new listings fell 1.0% year over year. With that lag and mortgage rates still rising through September, new listing growth will likely stay subdued for at least the next six months.
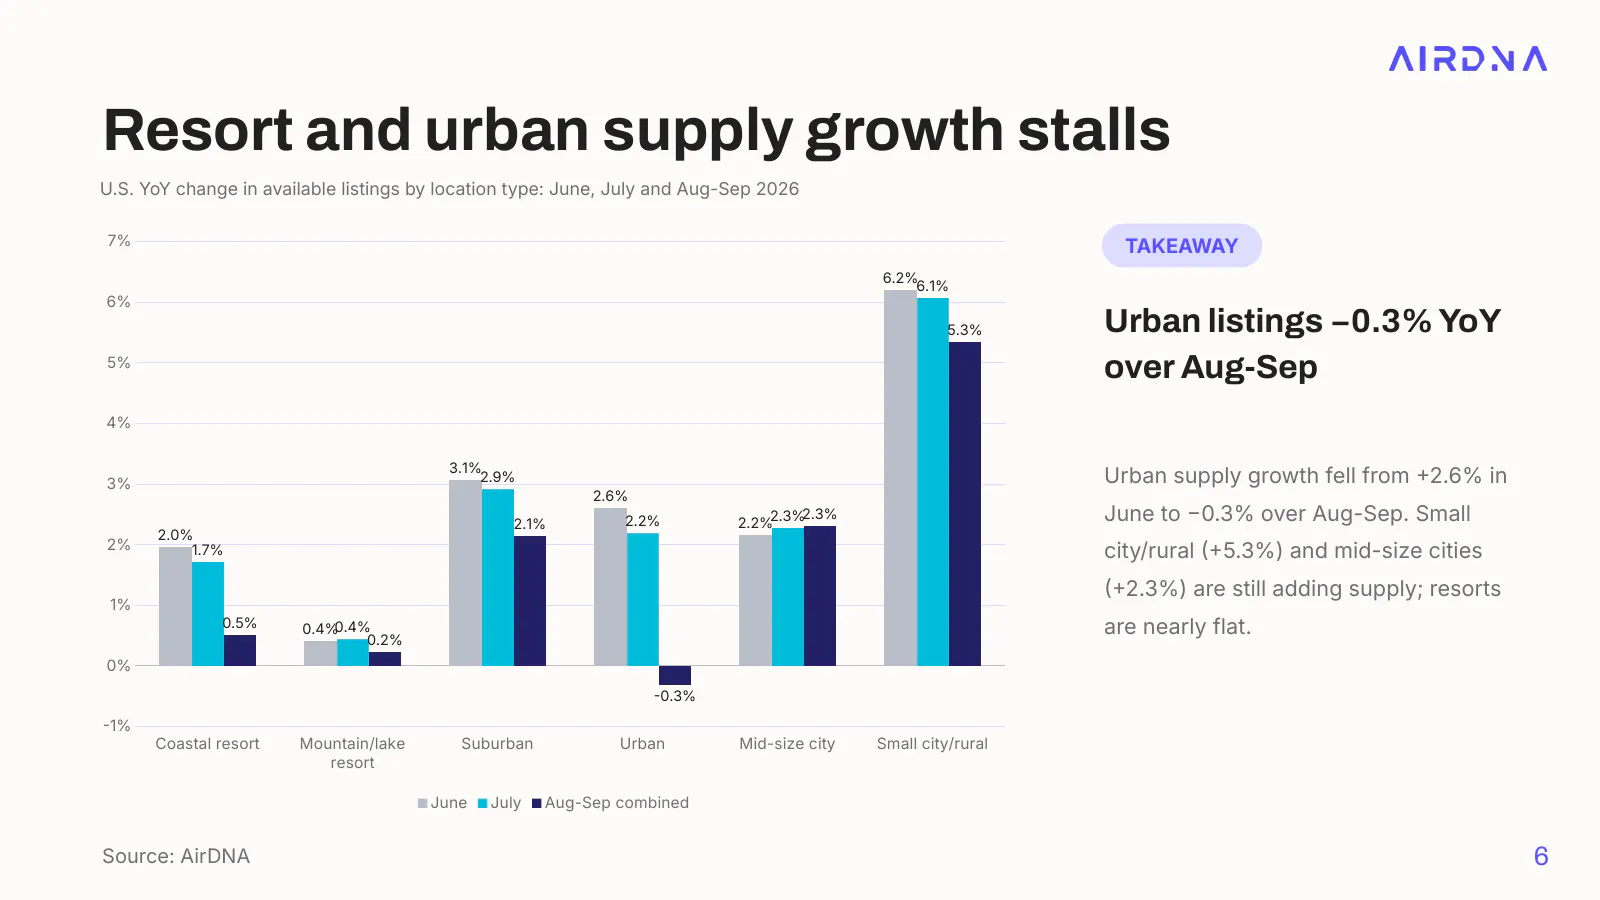
By location type, the slowdown in listing growth is sharpest where you’d expect if current financial conditions are the cause: resort and urban markets, where property prices tend to be highest. Small town/rural markets still have the highest growth rate (+5.3% year over year for August-September), and suburban markets (+2.1%) are still adding listings faster than 2%. Mid-size cities (+2.3%) were the only location type to accelerate listing growth over the past three months.
August and September Demand Grew 2.1% Combined, Signaling Momentum
Headline demand growth in August looked weak (-2.5%), but we knew going into September that the calendar shift was the main reason. September’s +8.1% was the highest since April 2025, but it, too, is largely due to the Labor Day shift. The encouraging news is that the two months combined grew 2.1%, the highest rate since October 2025. That continues the acceleration we’ve observed since demand growth bottomed out at +0.8% in February. We expect the trend to continue through the rest of the year, as 2025 comparisons are relatively easy for the next three months.
The improvement is especially pronounced at the unit level. Occupancy has sharply reversed from its 3.6% decline in September 2025. Occupancy losses narrowed until August and September, which combined posted a 1.5% year-over-year occupancy gain, the largest since April 2025.
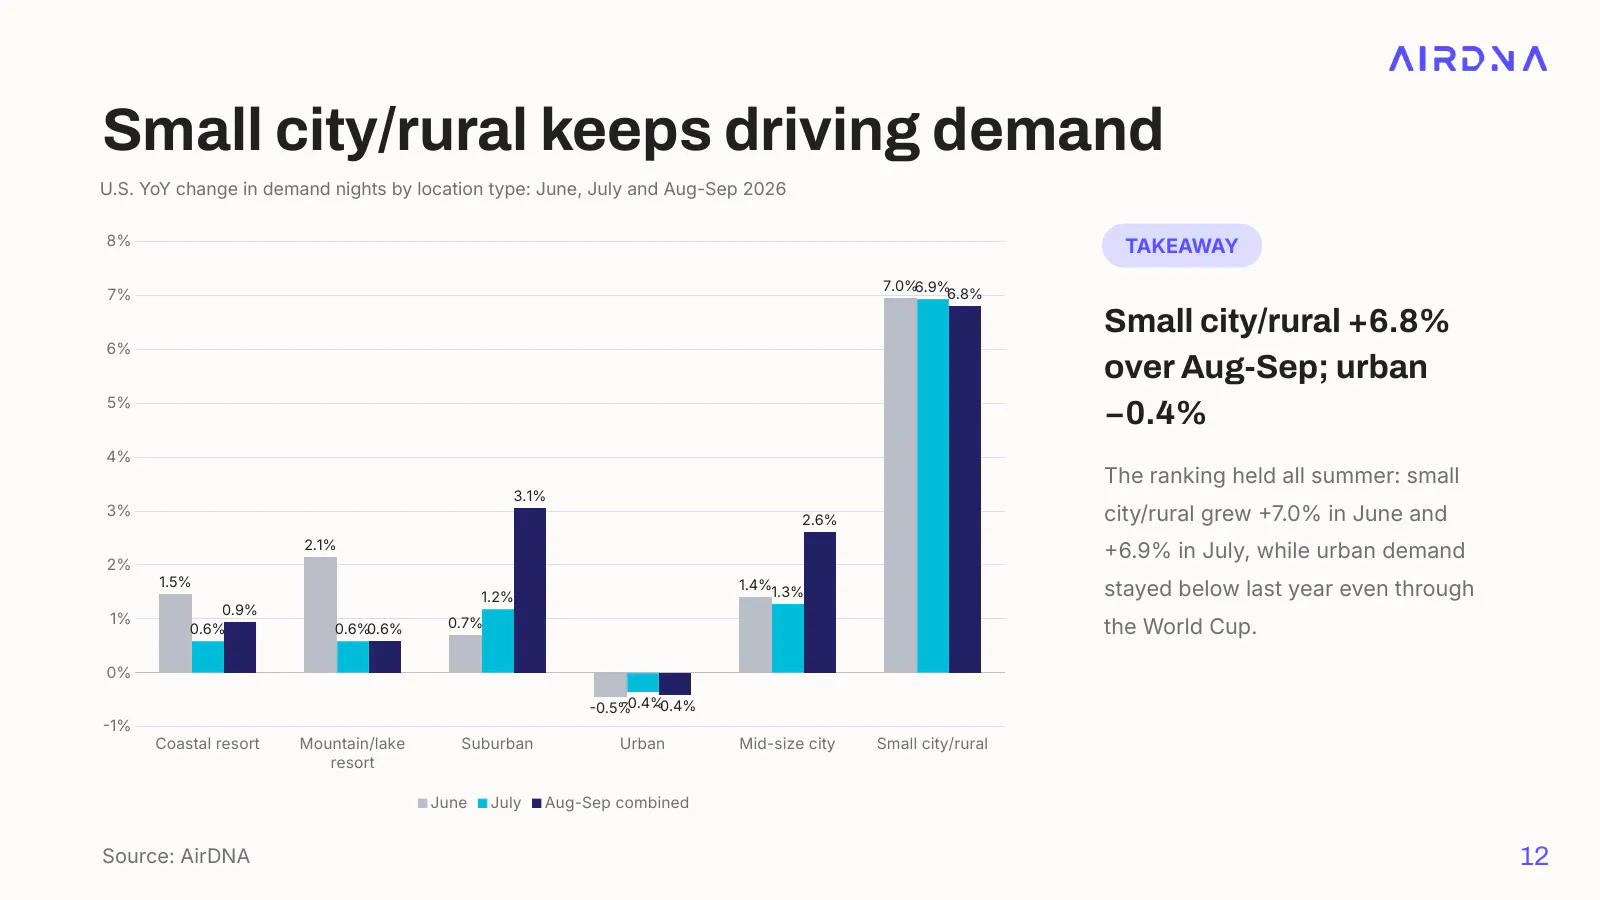
By location type, travelers appear to have favored homier locations over the past two months, with small city/rural, mid-size city, and suburban markets posting the highest demand growth. Resort locations, both coastal (+0.9%) and mountain/lake (+0.6%), grew less than 1%. Urban demand fell 0.4% year over year.
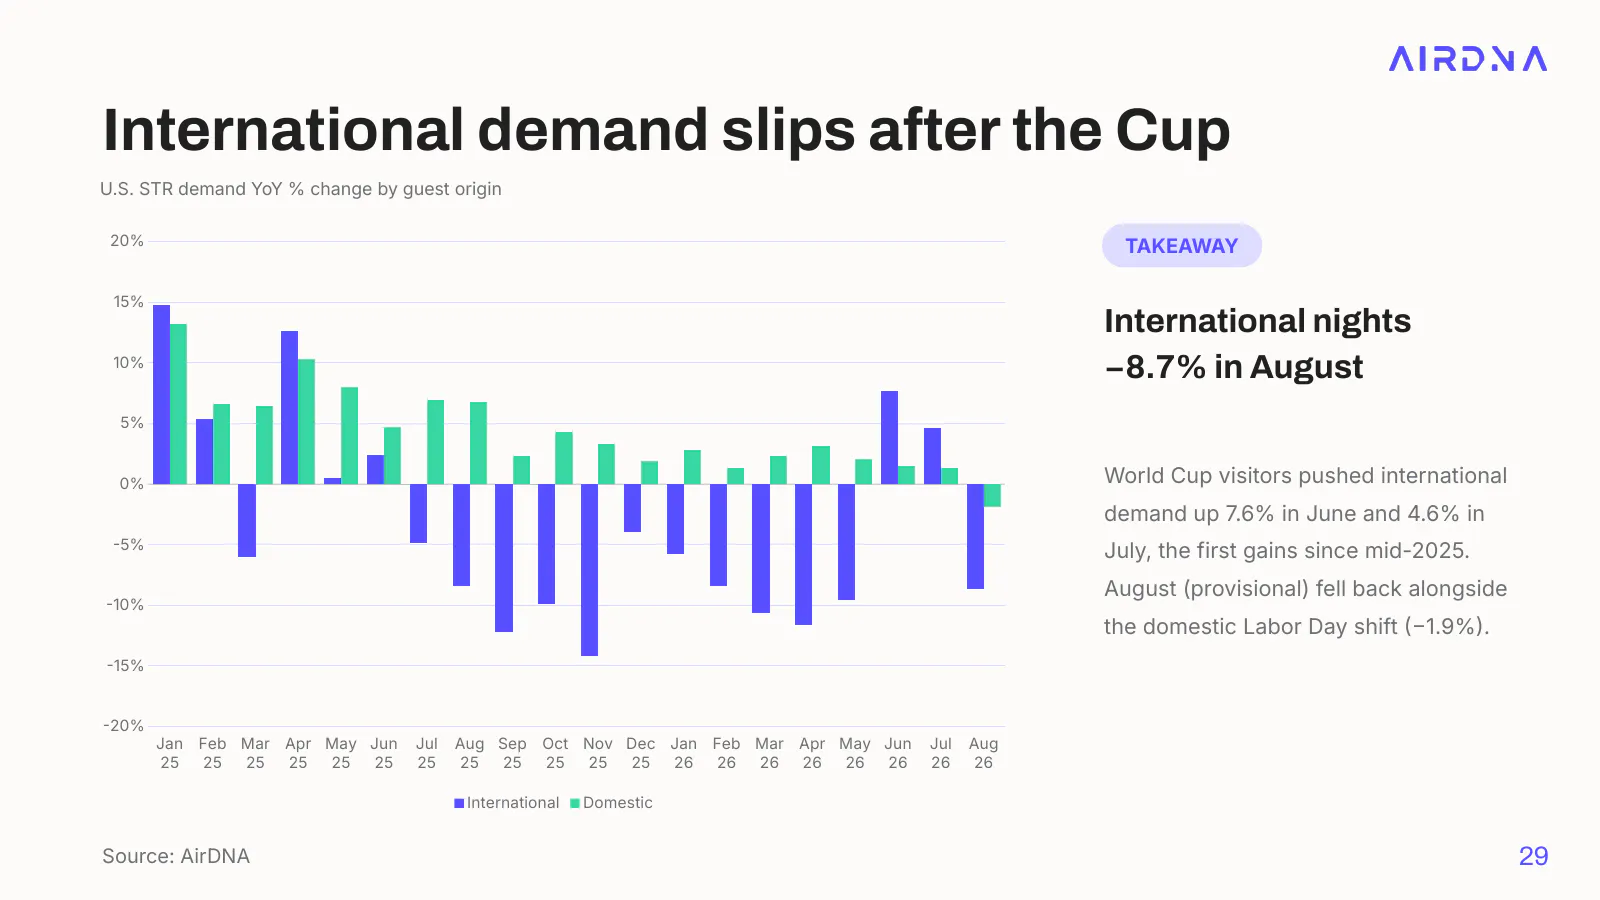
An old headwind is back after a brief break for the 2026 FIFA World Cup: international travel. We measure guests’ international origins from reviews, so while September reviews are still coming in, we have a good idea of what happened in August. And since most of the world celebrates workers on May Day rather than Labor Day, the calendar shift is less likely to have affected international visitors. After strong year-over-year gains in international guests in June (+7.6%) and July (+4.6%), August turned negative again (-8.7%).
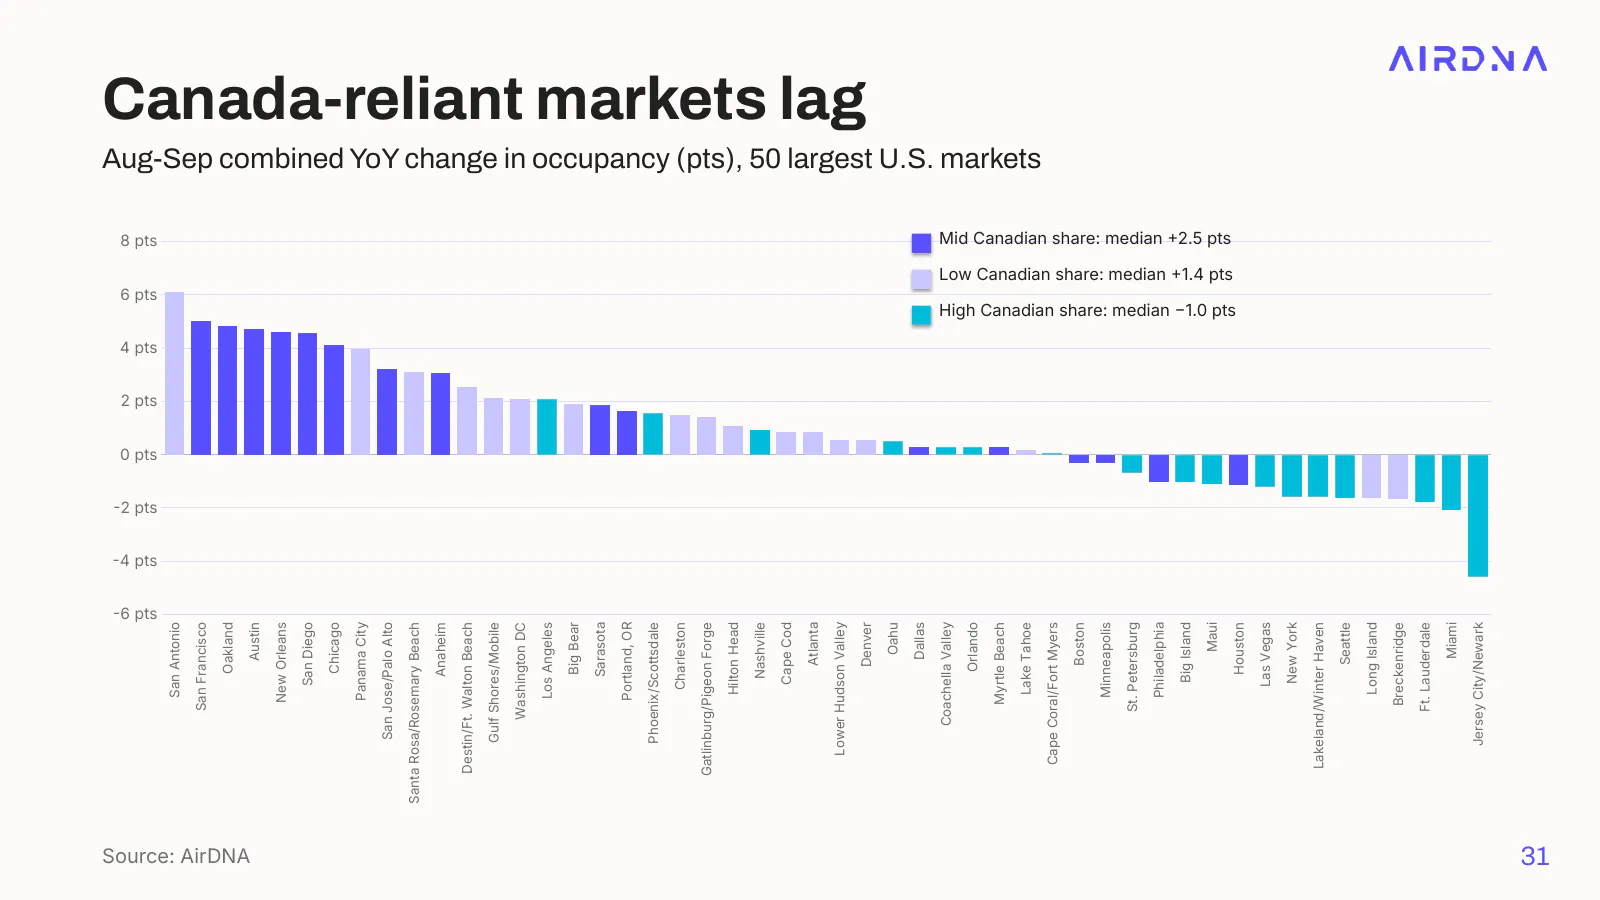
At the market level, Canada, the country with the largest pullback in U.S. STR stays, may be having a material impact on occupancy. Among our top 50 markets, those with the largest year-over-year occupancy declines are also the most exposed to Canadian travelers. On the other hand, some markets with significant Canadian exposure, such as San Francisco, California (+5.0 percentage points); Oakland, California (+4.8 percentage points); and Austin, Texas (+4.7 percentage points), posted some of the largest increases.
ADR Rose 7.2% in September, With Strong Gains Across Both Months
September’s ADR growth (+7.2%) matched its World Cup peak. AirDNA’s Repeat Rent Index (RRI), which measures price changes made by existing operators and removes the effect of mix shift, rose even faster (+7.8%). Even with August and September combined, ADR growth of 4.3% remains well above inflation and among the highest increases of the last two years. RRI fared even better, rising 6.5% over the two months, less than a percentage point behind July’s World Cup-driven increase of 7.4%.
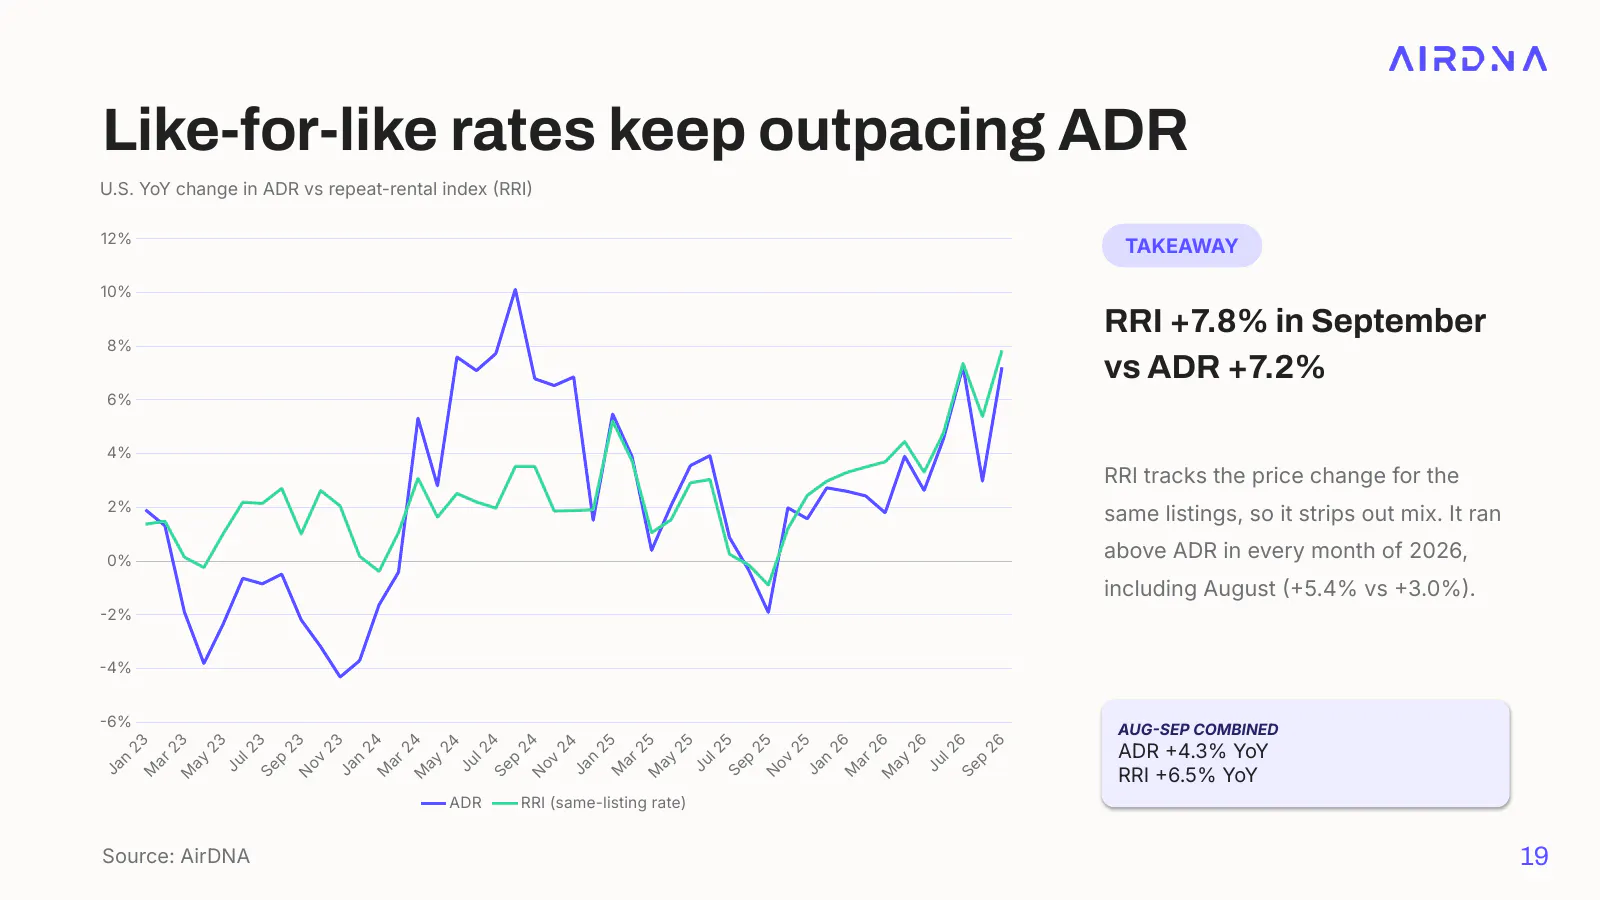
During the last period of elevated inflation in 2022 and 2023, price growth initially slowed and turned negative as budgets were squeezed. The following year, prices grew much faster, catching up with and exceeding previous rates as operators passed some higher expenses on to guests. We appear to be seeing a similar pattern since the April 2025 tariff announcements set off another round of inflationary pressure. ADR growth fell sharply later that year, but with the conflict in Iran putting renewed pressure on prices, operators appear to be raising rates at an elevated pace once again.
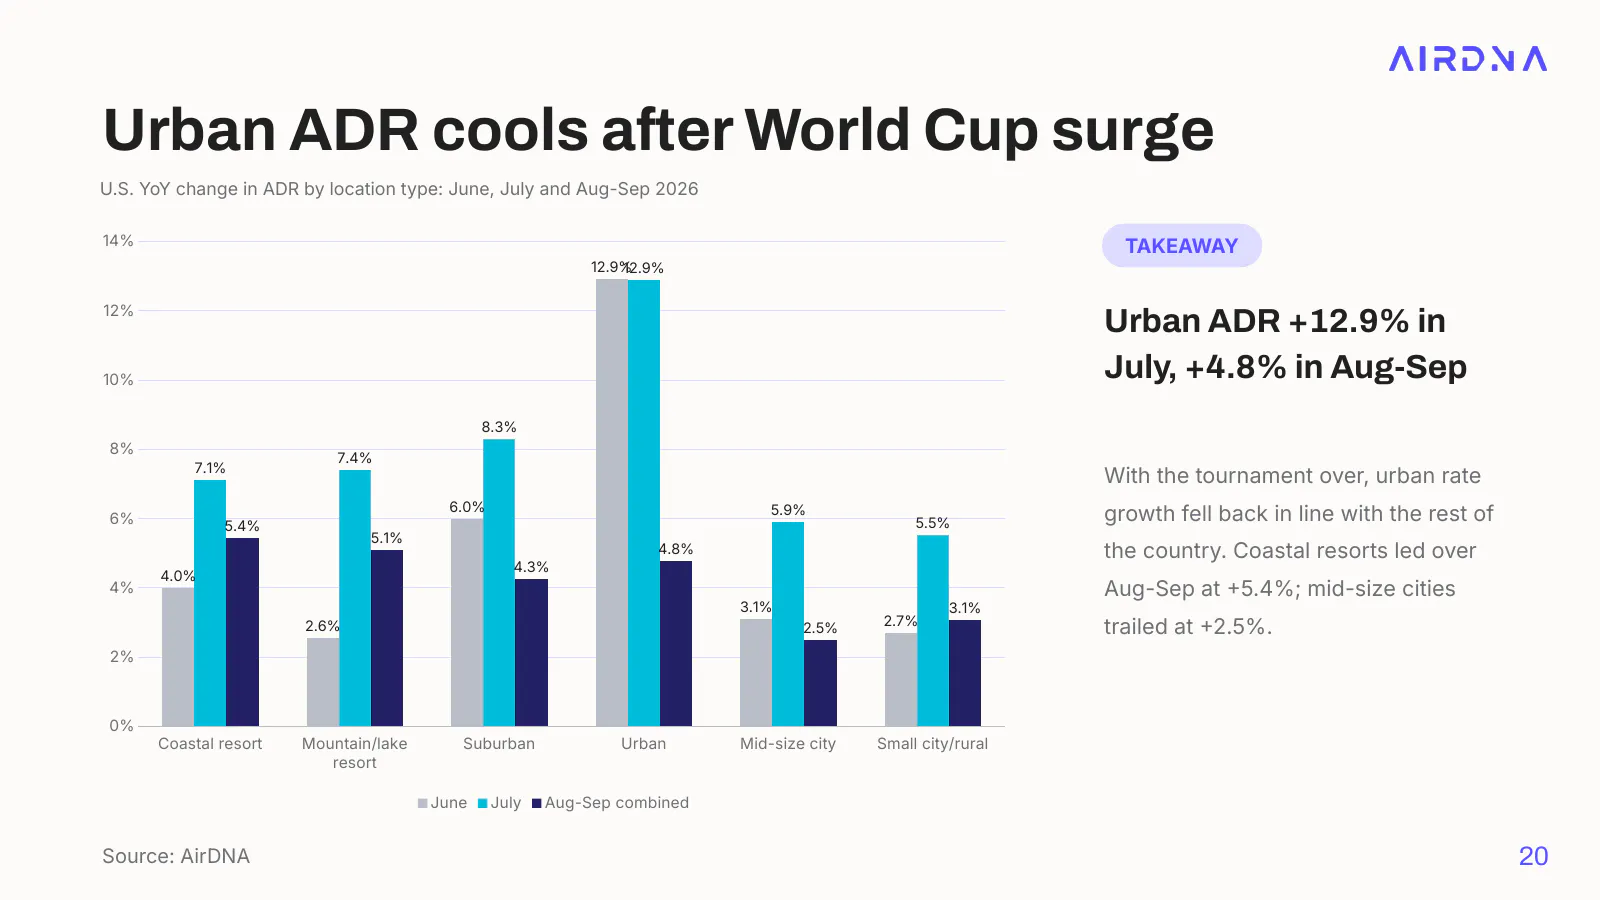
Demand growth concentrated in mid-size cities, small town/rural areas, and the suburbs, perhaps because of their homey character, but possibly also because of affordability: these locations had the slowest ADR growth over August and September. Urban ADR growth fell from its World Cup highs but averaged 4.8% over the past two months, a strong increase well above inflation. Only coastal (+5.4%) and mountain/lake (+5.1%) resort locations grew faster.
Which markets had the fastest ADR growth?
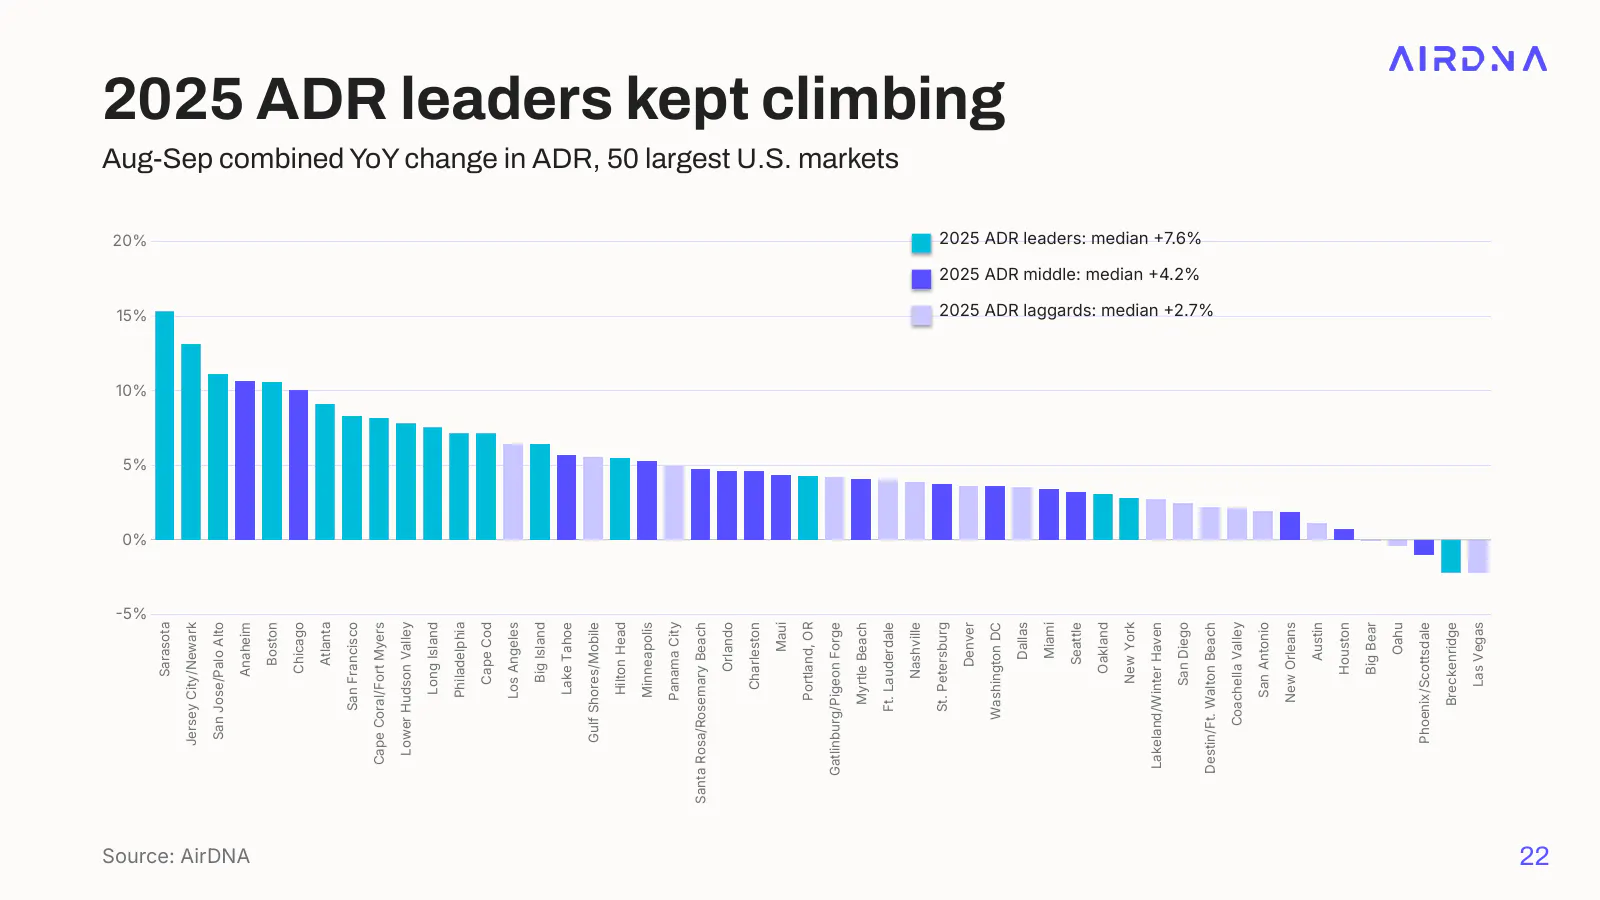
Sarasota, Florida led the 50 largest U.S. markets in combined August-September ADR growth (+15.3%), followed by Jersey City/Newark, New Jersey (+13.1%) and San Jose/Palo Alto, California (+11.1%). Markets that led ADR growth in 2025 kept climbing, with a median gain of 7.6%, compared with 2.7% for last year’s laggards.
Holiday Pacing Looks Solid, but Longer Lead Times Overstate It
Recent AirDNA research has shown lead times lengthening since March. Lead times strongly affect pacing: when they lengthen, pacing overstates future demand. Over the past seven months, pacing has typically started out elevated, often implying double-digit demand growth. Around 60 to 90 days before the stay date, the pace slows until it reaches the true level. The most accurate pacing signals are therefore those one or two months out.
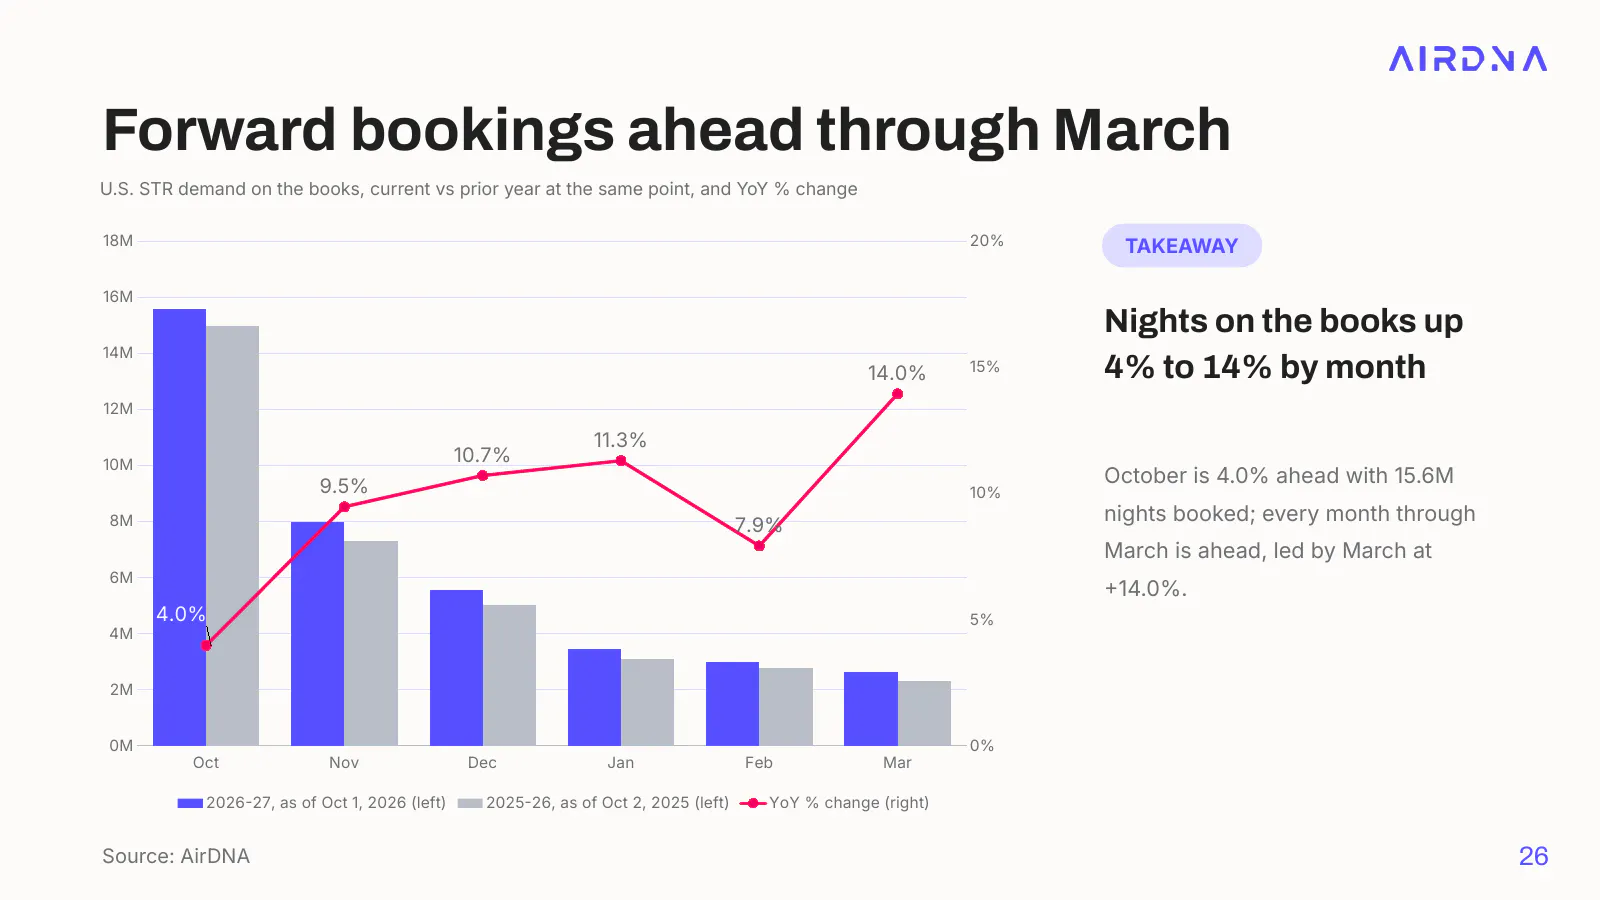
October could be reasonably close to final demand growth, although several weeks remain in the month. November may be somewhat overstated, while the rest of the year looks encouraging but likely speculative.
Ski markets are booking later after last season’s snow drought
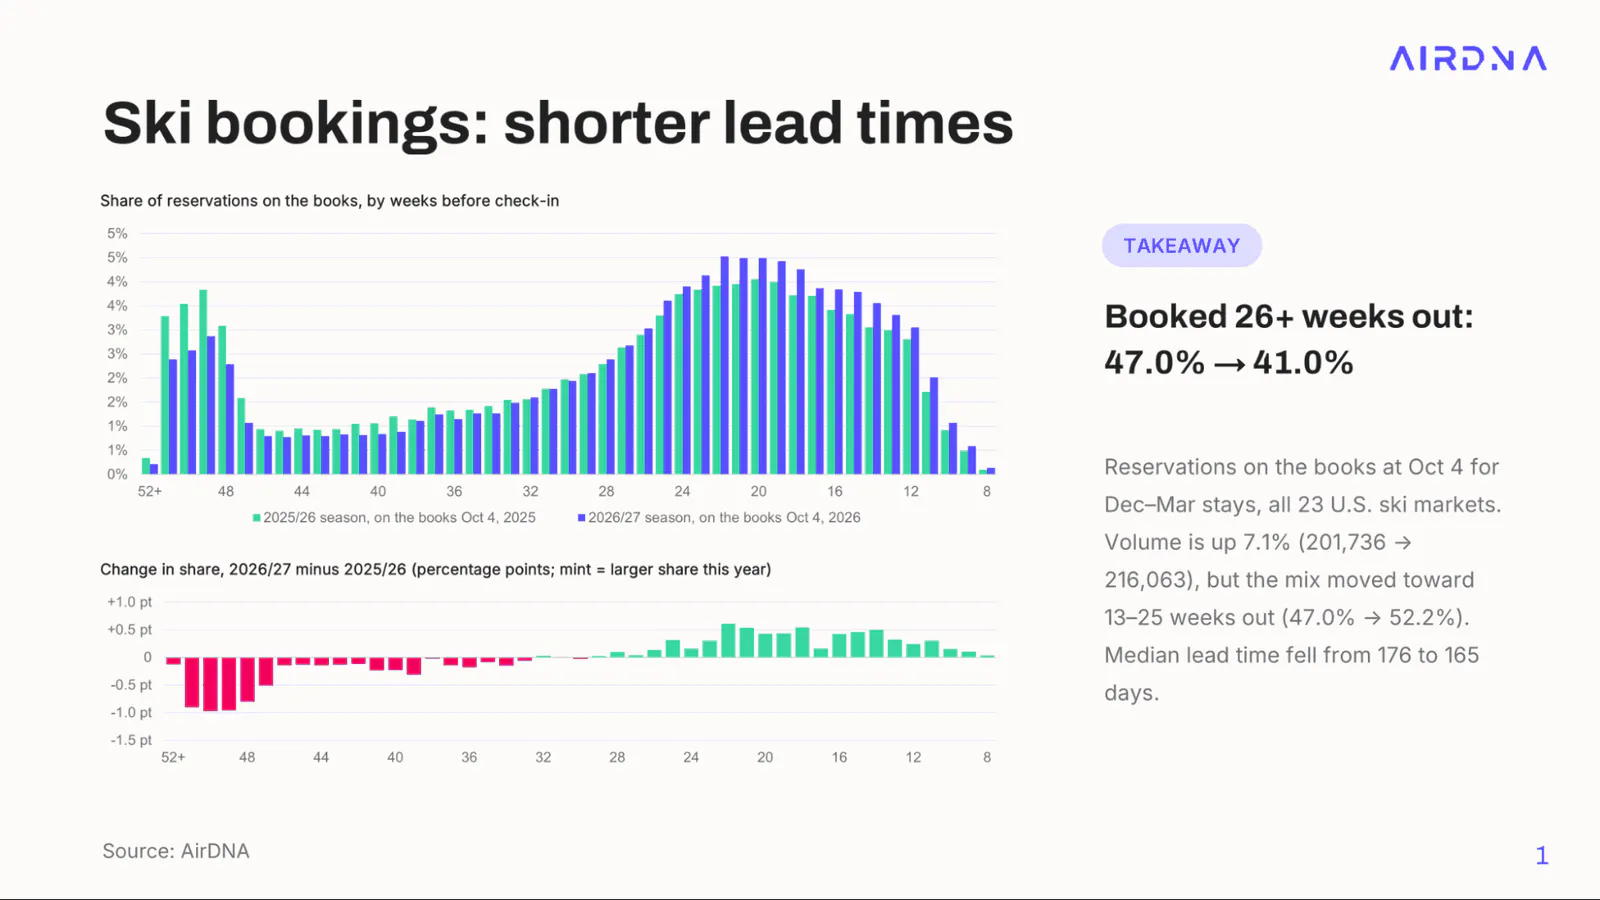
Although lead times have generally lengthened in the U.S., ski resort markets are a notable exception. We examined 23 ski markets in the East and West, looking at bookings made over the past year for December 2026 through March 2027. Compared with the 2025/26 season at this point last year, median lead times have shortened by 11 days, from 176 days to 165 days for the 2026/27 season.
Regular review readers will recall that earlier this year, a historic snow drought across the West ended the season early for many resorts. Ski markets usually enjoy a cluster of bookings made nearly a year in advance, as skiers who enjoyed their stay take advantage of repeat discounts or simply want to lock in a good experience for the following year. For the upcoming season, there have been far fewer of these reservations following the drought.
This cushion, which usually gives operators peace of mind, is now smaller. Fortunately, recent bookings have been picking up the slack, and pacing has trended opposite to the national pattern: it predicted a year-over-year decline in demand for the upcoming season until about mid-September. As of October 4, ski markets are pacing 7.1% ahead of last year at this time, with Eastern markets looking especially strong (+20.0% vs. +3.6% in the West). On the other hand, only about a fifth of total reservations for the 2025/26 season had been made by the beginning of October, and as we learned last January, the actual powder on the slopes will determine the final result.
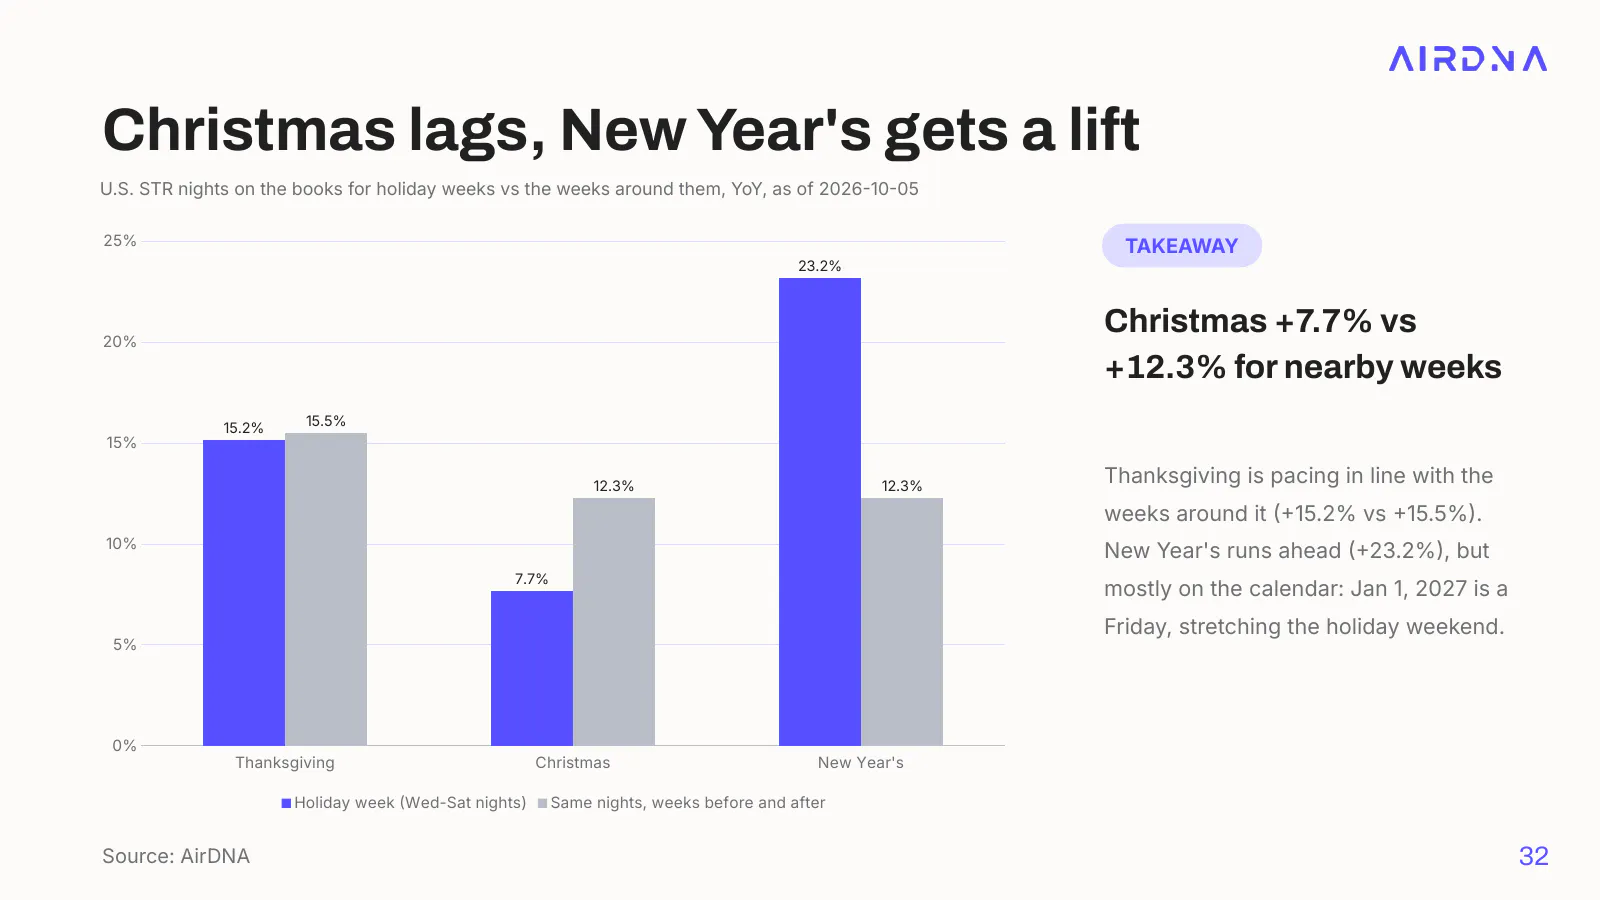
Looking ahead to the holidays, New Year’s Day falling on a Friday appears to be lifting New Year’s bookings so far, with the opposite effect on Christmas. Wednesday-Saturday bookings over New Year’s are 23.2% ahead of last year at this point, well ahead of the +12.3% pace for the surrounding weeks. The same days around Christmas are up 7.7% on 2025, below the 12.3% benchmark.
Which markets lead Thanksgiving pacing?
Thanksgiving weekend produces a noticeable demand bump, though so far its growth rate is no higher than the surrounding weeks. That doesn’t mean there aren’t real winners. Much like Labor Day weekend, the biggest year-over-year gains are in markets where football schedules have placed important games. College Station, Texas (+173.3%); Oxford, Mississippi (+297.2%); and Eugene, Oregon (+78.8%) are posting big year-over-year gains in Thanksgiving demand, well ahead of their surrounding weeks. Lake destinations are also looking forward to extra Thanksgiving demand, with Pinetop-Lakeside, Arizona topping the list for the biggest boost over its surrounding weeks.
| Ahead of Its Nearby Weeks | Holiday YoY | Nearby Weeks YoY | Holiday Nights | Biggest Boost vs. Nearby Weeks | Boost | Holiday Nights |
|---|---|---|---|---|---|---|
| College Station | +173.3% | -28.8% | 2,856 | Pinetop-Lakeside | +340.9% | 2,143 |
| Oxford | +297.2% | +133.6% | 2,439 | Eugene | +333.0% | 3,165 |
| Eugene | +78.8% | -46.7% | 3,165 | Moab | +307.9% | 2,374 |
| Lubbock | +119.8% | +25.6% | 2,569 | St. George | +306.6% | 8,288 |
| Lake Hartwell | +86.5% | -1.4% | 4,385 | Lake Hartwell | +304.5% | 4,385 |
| Buffalo/Niagara Falls | +79.7% | -0.5% | 3,959 | College Station | +296.4% | 2,856 |
| Columbus | +79.4% | +26.1% | 6,117 | Outer Banks | +292.5% | 4,912 |
| Tallahassee | +136.3% | +107.8% | 2,372 | Wilmington | +286.3% | 11,293 |
| Sarasota | +50.9% | +23.5% | 18,545 | Bend | +276.1% | 3,973 |
| Stamford/New Haven | +15.6% | -6.8% | 2,975 | Lubbock | +271.2% | 2,569 |
Create a Free Account
Free access to market data, Rentalizer estimates, and your listing's performance. No credit card.
FAQs
Is the U.S. short-term rental market slowing down?
No. Once the Labor Day calendar shift is netted out, U.S. short-term rental demand grew 2.1% across August and September 2026 combined, the fastest pace since October 2025, and occupancy rose 1.5%. What is slowing is supply: available listings grew just 1.6%, the weakest rate since the pandemic.
Are short-term rental bookings down in 2026?
Not on a like-for-like basis. August demand fell 2.5% and September rose 8.1% because Labor Day weekend moved from August in 2025 to September in 2026. Combined, the two months grew 2.1% year over year, and nights on the books are ahead of last year for every month from October 2026 through March 2027.
What were the average daily rate and occupancy for U.S. short-term rentals in September 2026?
ADR reached $254 in September 2026, up 7.2% year over year, and occupancy averaged 53.6%, up 3.7 percentage points. The Repeat Rent Index, which tracks price changes for the same listings, rose 7.8%.
Why is short-term rental supply growth slowing?
Higher mortgage rates. New listings tend to follow mortgage rates with a lag of around six months, and 30-year fixed rates rose from 6.66% at the end of August to 7.28% in early October 2026. September new listings fell 1.0% year over year, and new listing growth will likely stay subdued for at least the next six months.
Which markets are seeing the biggest Thanksgiving booking gains?
College towns with big home games lead. Thanksgiving nights on the books are up 297.2% in Oxford, Mississippi, 173.3% in College Station, Texas, and 78.8% in Eugene, Oregon. Pinetop-Lakeside, Arizona has the biggest Thanksgiving boost over its surrounding weeks.
ARTICLE SUMMARY
The U.S. short-term rental market gained momentum across August and September 2026. With the Labor Day calendar shift netted out, demand grew 2.1% and occupancy rose 1.5%, while ADR climbed 4.3% and listing growth slowed to 1.6%, its weakest pace since the pandemic, as mortgage rates climbed.
Bram Gallagher
AirDNA Director of Economics and Forecasting
Bram Gallagher is an Economist at AirDNA, specializing in uncovering insights that drive smarter short-term rental decisions. He put his Ph.D. in Economics from the University of Georgia to work researching and forecasting hotel data with CBRE prior to joining AirDNA, as well as teaching economics at a number of universities. In his spare time, Bram enjoys making wooden furniture with hand tools.
