

 Calculate Revenue
 Research Markets
 Find For Sale Properties
 Compare My Listing
 STR Revenue Calculator
 Custom Comp Sets
 Submarket Insights
 Custom Search Filters
 Rate Recommendations
 Performance Benchmarking
 Competitor Comparison
 Owner Contact Details
 Property-level performance data
 Tourism Insights
 Real Estate Investment Analytics
 About Us
 Sales
Sales Support
 Press
PressWhat College Football Home Games Are Really Worth to Short-Term Rental Markets
Published: August 27, 2026
Last updated: September 1, 2026

Linda Rollins
Most college football teams play only six to eight home games a season, but for the towns that host them, those few weekends can carry an outsized share of the local short-term rental economy. AirDNA analyzed 2025 performance and early 2026 booking pace across 32 SEC and Big Ten markets, the two conferences with the largest and most traveled fan bases, to measure how much a home game weekend is worth and how that value changes with market size.
For each of the 32 schools, we compared Friday and Saturday performance on regular season home game weekends against Friday and Saturday performance on non-game weekends within that same team’s season, defined as the window from a week before its first home game through a week after its last. We also pulled 2026 booking data for the regular season to see how this season is pacing so far.
Key Takeaways
- In the smallest college towns, seven to eight home game weekends generate up to 26% of a market’s entire annual short-term rental revenue.
- Occupancy on home game weekends topped 80% in 22 of the 32 markets studied in 2025.
- Revenue per available rental rose as much as 455% on home game weekends in Tuscaloosa, Alabama, compared with a typical fall weekend.
- Calendar timing beats opponent quality. Eighteen of 32 schools recorded their best occupancy weekend of 2025 in October, and seven of those landed on the same Saturday.
- The 2026 booking window is already tight in small markets: Nebraska has crossed 60% occupancy on six of its seven home games, while Rutgers has yet to cross it on any.

Home Games Are Worth the Most in the Smallest College Towns
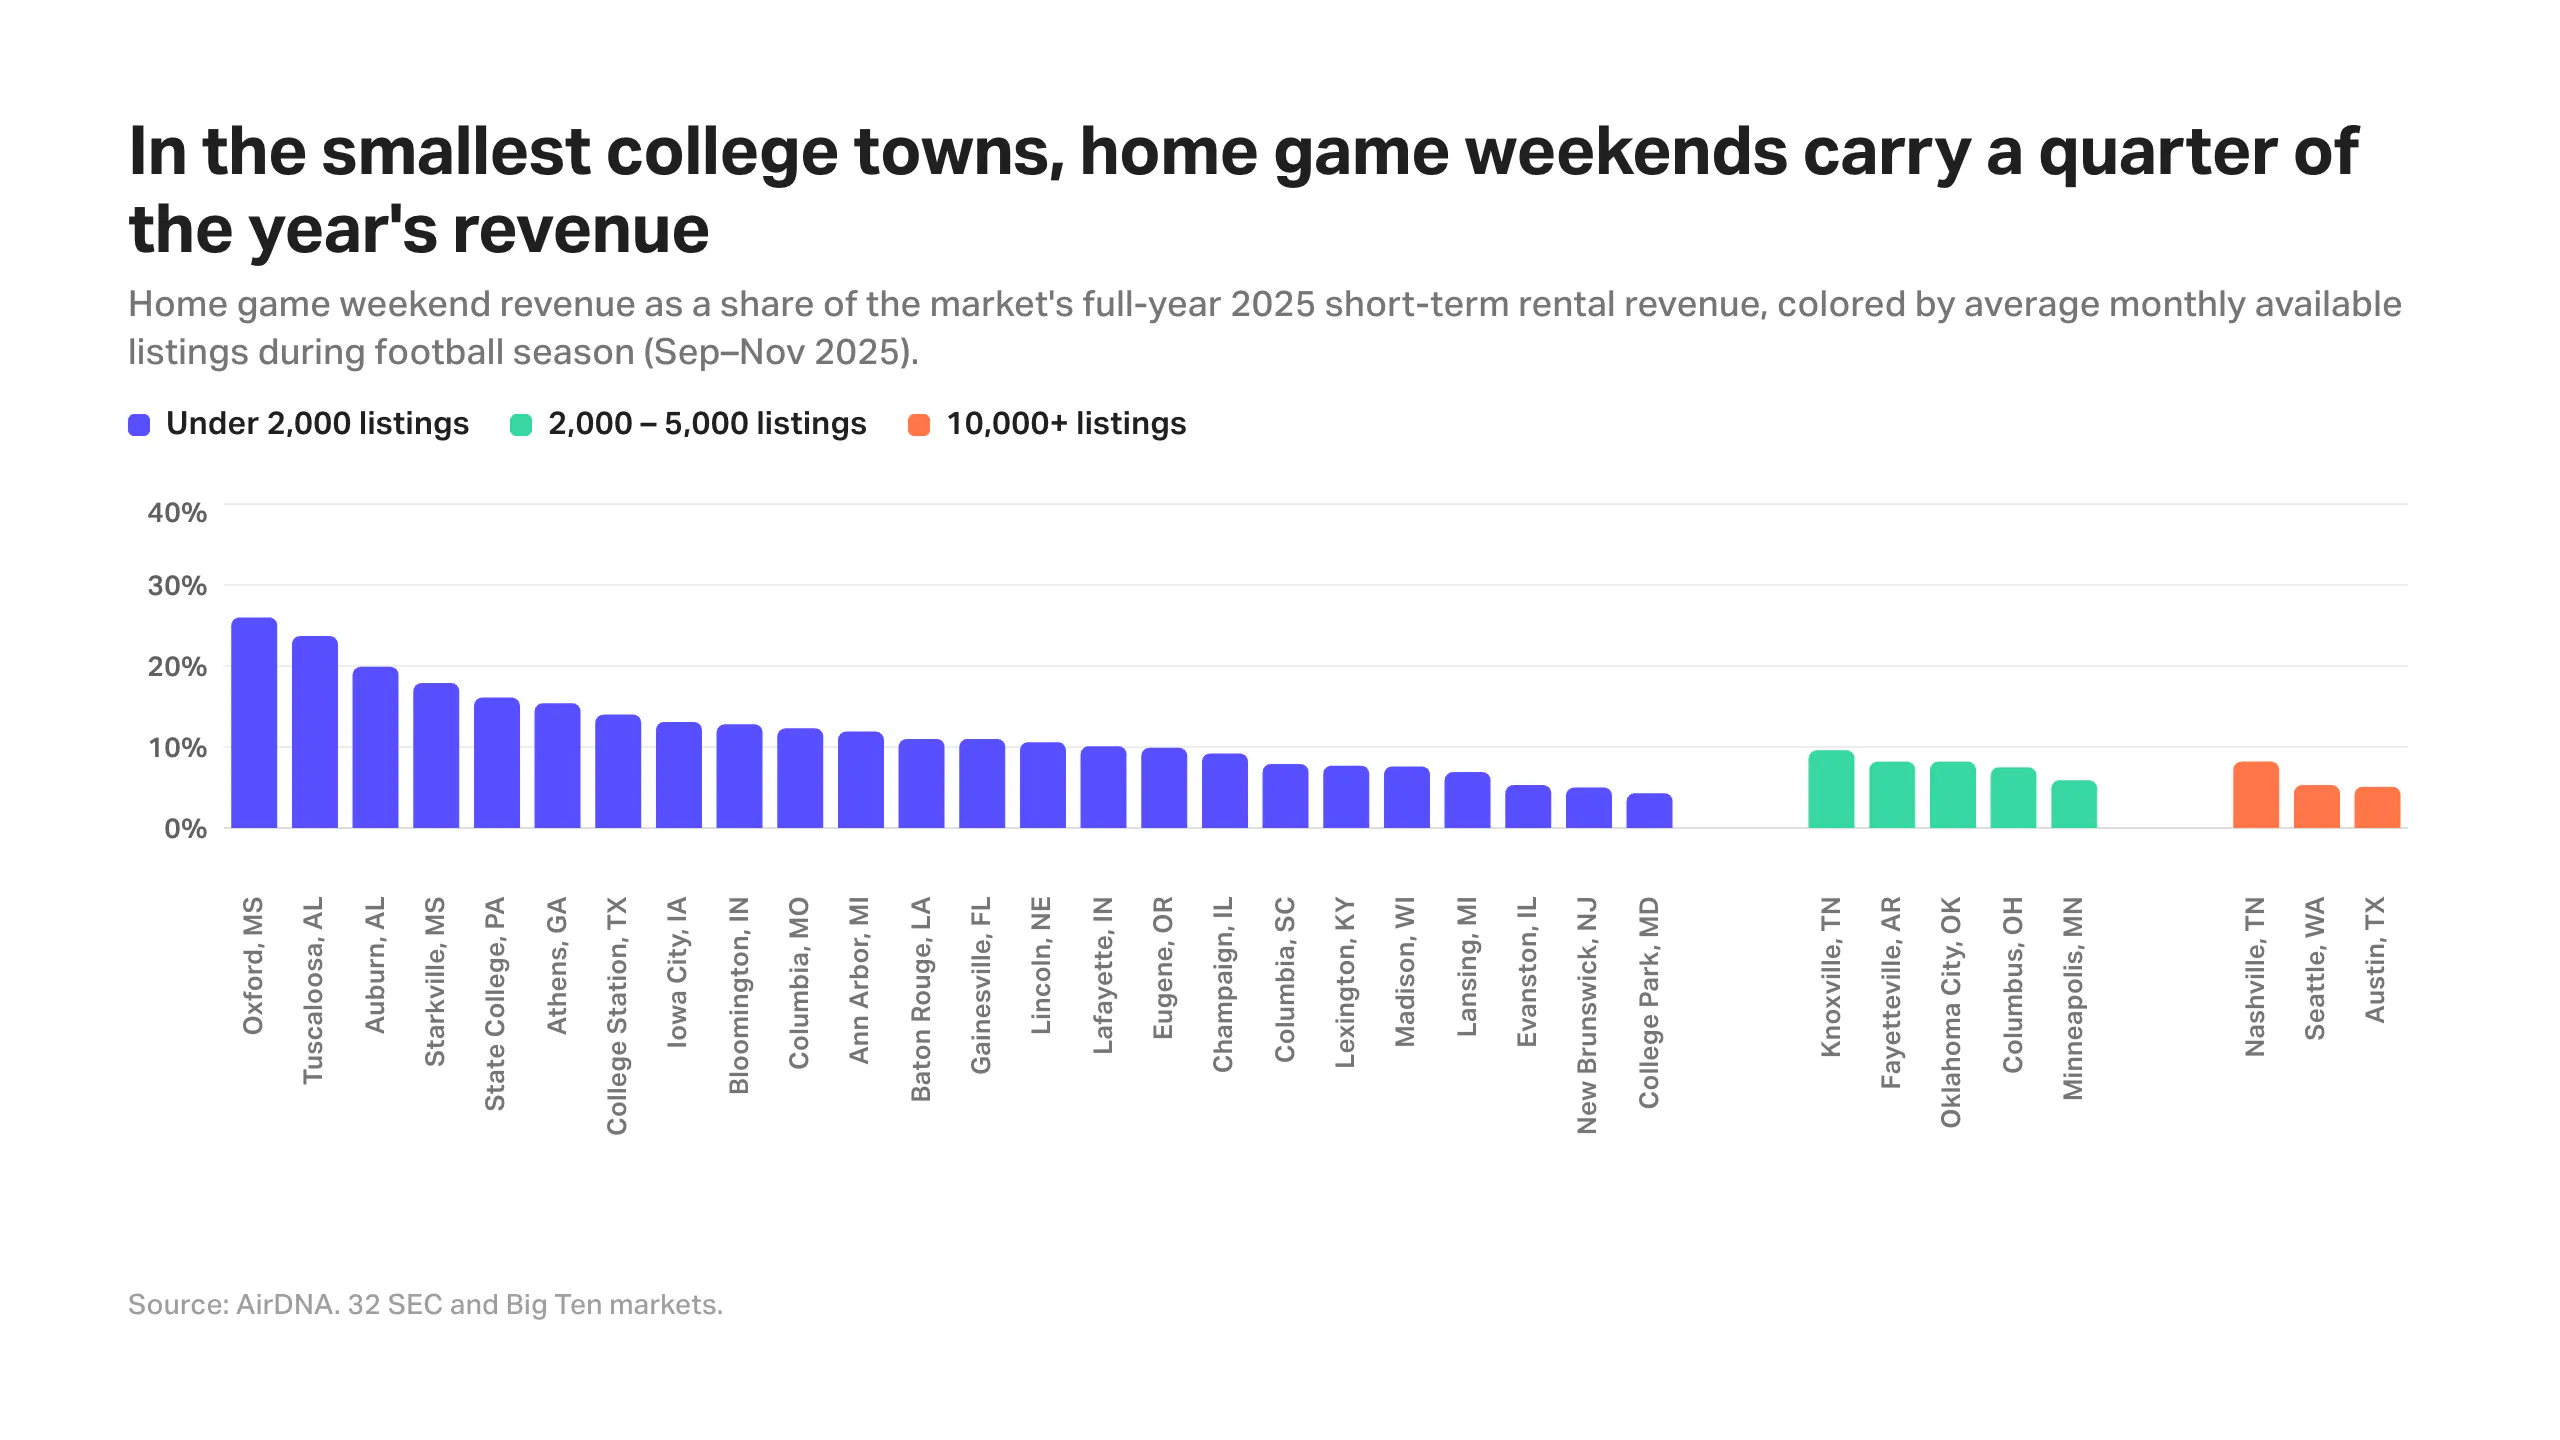
Revenue is heavily concentrated into a handful of weekends in the smallest college football markets, where there are fewer than 2,000 available listings and the university and its football program are the primary demand drivers. In Oxford, Mississippi, home game weekends for Ole Miss make up 26% of the market’s entire 2025 short-term rental revenue. In Tuscaloosa, Alabama, Alabama’s home game weekends account for 24%, and in Auburn, Alabama, they make up about a fifth of annual revenue. In each of these towns, seven to eight weekends carry roughly a quarter of the year.
Midsize markets with 2,000 to 5,000 monthly available listings see the same fall concentration at a smaller scale, because they have other demand drivers year-round. In Knoxville, Tennessee, home game weekends account for around 10% of Tennessee’s annual market revenue. In Columbus, Ohio; Fayetteville, Arkansas; and Oklahoma City, Oklahoma, they make up 7% to 8%.
In the largest markets, where monthly listings exceed 10,000 during football season, home games are one demand driver among many. Home game weekends account for around 8% of annual revenue in Nashville, Tennessee, and 5% in both Seattle, Washington, and Austin, Texas. Even a full slate of sold-out home games can’t move the needle in these markets the way it does in Oxford or Tuscaloosa.
Home Games Lift Occupancy and Rates Almost Everywhere, but Not Equally
Regardless of market size, a home game weekend brings a meaningful lift to demand, occupancy, average daily rate (ADR), and revenue per available rental (RevPAR). Average occupancy across home game weekends was over 80% in 22 of the 32 markets in 2025, and another nine markets recorded occupancy between 70% and 80%.
The smallest markets see the most dramatic swings because they start from such a low baseline on a typical fall weekend. In Starkville, Mississippi, occupancy on a non-game weekend averages just 34%. On a Mississippi State home game weekend it jumps to 87%, a 2.5x increase. Bloomington, Indiana tells a similar story: occupancy runs 51% on a typical weekend and climbs to 81% when Indiana plays at home.
Even in much bigger markets, home games still move occupancy. In Lexington, Kentucky, occupancy runs around five percentage points higher on Kentucky home game weekends than on non-game weekends. Columbus, Ohio records a similar, slightly smaller bump on Ohio State home game weekends.
Home game weekends also let many hosts command higher rates, and the smallest markets see the biggest gains. Half of the 24 markets with under 2,000 listings recorded ADR increases of more than 30% on home game weekends compared with non-game weekends in 2025. In the smallest towns, limited lodging inventory lets hosts raise rates more than 50%: Tuscaloosa (+66.7%), Oxford (+59.1%), Starkville (+51.2%), and Athens, Georgia (+50.5%).

In the largest markets, rate gains shrink to single digits. Nashville (+4.3%) and Seattle (+5.9%) both recorded modest ADR increases on home game weekends in 2025. Austin is the exception. The market has so many competing demand drivers in the fall that weekends with a home game don’t necessarily perform any better than weekends without one.
Putting occupancy and rate gains together, RevPAR tells the clearest story about what a home game is worth. RevPAR combines rates with occupancy to show what hosts earned for every night they were listed, whether or not the listing got booked. Among the smallest towns, where football and the university are effectively the whole local economy, RevPAR on a home game weekend is up as much as 285% to 455% over a typical fall weekend: Tuscaloosa leads at +455%, followed by Oxford (+360%), Auburn (+319%), and Starkville (+285%).
Midsize markets see a smaller lift: Oklahoma City (+57%), Knoxville (+42%), Fayetteville/Bentonville (+36%), and Minneapolis, Minnesota (+6%). In the largest markets, RevPAR moves the least. Nashville is up 15% and Seattle 12%, while Austin recorded RevPAR falling 15% on home game weekends compared with non-game weekends in 2025.
| School | Market | RevPAR vs Non-Game | ADR vs Non-Game | Occupancy vs Non-Game | Demand vs Non-Game | Avg Available Listings | Avg Nightly Demand | Occupancy | ADR | RevPAR |
|---|---|---|---|---|---|---|---|---|---|---|
| Alabama | Tuscaloosa | +454.8% | +66.7% | +232.7% | +242.7% | 1,027 | 626 | 79.3% | $642 | $509 |
| Ole Miss | Oxford | +360.1% | +59.1% | +189.1% | +203.6% | 1,774 | 1,041 | 81.1% | $707 | $573 |
| Auburn | Auburn | +318.7% | +45.7% | +187.4% | +183.7% | 717 | 494 | 84.9% | $495 | $420 |
| Mississippi State | Starkville | +284.5% | +51.2% | +154.3% | +151.8% | 500 | 370 | 87.2% | $356 | $311 |
| Florida | Gainesville | +151.6% | +48.7% | +69.2% | +74.5% | 1,628 | 1,162 | 83.9% | $296 | $248 |
| Georgia | Athens | +148.2% | +50.5% | +64.8% | +73.5% | 1,403 | 868 | 81.3% | $469 | $381 |
| Penn State | State College | +142.8% | +41.0% | +72.1% | +76.0% | 1,531 | 850 | 76.2% | $602 | $459 |
| LSU | Baton Rouge | +124.2% | +42.8% | +57.0% | +58.5% | 1,210 | 828 | 83.4% | $252 | $210 |
| Michigan | Ann Arbor | +105.4% | +42.5% | +44.2% | +52.2% | 1,018 | 685 | 82.6% | $436 | $360 |
| Iowa | Iowa City | +105.1% | +42.6% | +43.8% | +50.2% | 376 | 274 | 86.2% | $304 | $262 |
| Oregon | Eugene | +99.3% | +29.2% | +54.3% | +55.8% | 1,981 | 1,377 | 84.9% | $250 | $212 |
| Texas A&M | College Station | +99.0% | +31.0% | +52.0% | +55.5% | 1,480 | 960 | 81.6% | $401 | $327 |
| Indiana | Bloomington | +97.8% | +24.3% | +59.1% | +58.0% | 1,059 | 717 | 81.4% | $352 | $287 |
| Nebraska | Lincoln | +85.5% | +28.6% | +44.2% | +44.8% | 502 | 388 | 87.3% | $230 | $201 |
| Purdue | Lafayette | +79.0% | +30.7% | +37.0% | +38.7% | 390 | 276 | 80.2% | $240 | $192 |
| South Carolina | Columbia, SC | +66.8% | +25.8% | +32.5% | +33.6% | 1,931 | 1,299 | 80.7% | $254 | $205 |
| Missouri | Columbia, MO | +64.7% | +28.0% | +28.7% | +31.5% | 519 | 373 | 85.4% | $254 | $217 |
| Illinois | Champaign / Urbana | +61.9% | +23.9% | +30.6% | +31.9% | 566 | 406 | 84.1% | $211 | $177 |
| Michigan State | Lansing / East Lansing | +60.6% | +22.4% | +31.2% | +32.1% | 564 | 404 | 84.7% | $175 | $148 |
| Oklahoma | Oklahoma City | +57.4% | +26.2% | +24.7% | +25.0% | 3,161 | 2,158 | 82.2% | $198 | $163 |
| Tennessee | Knoxville | +42.2% | +19.0% | +19.5% | +18.7% | 2,780 | 1,934 | 80.8% | $267 | $216 |
| Arkansas | Fayetteville/Bentonville | +35.7% | +10.8% | +22.5% | +26.0% | 4,440 | 3,092 | 78.4% | $250 | $196 |
| Wisconsin | Madison | +33.6% | +16.3% | +14.9% | +17.0% | 695 | 480 | 82.9% | $241 | $200 |
| Vanderbilt | Nashville | +14.9% | +4.3% | +10.2% | +11.5% | 12,513 | 8,644 | 82.5% | $401 | $331 |
| Kentucky | Lexington | +13.7% | +7.0% | +6.2% | +7.8% | 1,488 | 977 | 79.1% | $262 | $207 |
| Ohio State | Columbus | +12.8% | +7.8% | +4.7% | +4.0% | 4,186 | 2,695 | 78.0% | $233 | $182 |
| Washington | Seattle | +12.4% | +5.9% | +6.2% | +7.9% | 11,818 | 6,706 | 75.7% | $205 | $155 |
| Minnesota | Minneapolis | +6.0% | +1.9% | +4.0% | +5.2% | 4,120 | 2,547 | 76.9% | $201 | $154 |
| Maryland | College Park / Hyattsville | +3.3% | +1.7% | +1.5% | +1.0% | 567 | 267 | 72.0% | $123 | $89 |
| Northwestern | Evanston | +3.2% | +3.3% | -0.1% | -0.7% | 293 | 206 | 80.6% | $229 | $184 |
| Rutgers | Edison / New Brunswick | -2.2% | -2.5% | +0.4% | +3.4% | 600 | 309 | 74.2% | $131 | $97 |
| Texas | Austin | -14.7% | -7.6% | -7.6% | -12.9% | 18,650 | 9,192 | 68.1% | $270 | $184 |
See How Your Listing Stacks Up
Your Performance Dashboard benchmarks your revenue, ADR, and occupancy against the properties you compete with.
Timing Beats Opponent: October Weekends Draw the Biggest Crowds
For each of the 32 schools, we put that team’s single highest-occupancy home game of the 2025 season side by side with its single lowest-occupancy home game, along with how far apart occupancy and ADR ran between the two.
The best game of the season isn’t always the marquee matchup. Alabama’s best occupancy weekend of 2025 came against Tennessee, a real rivalry game. Oklahoma’s best weekend came against Kent State, a non-conference opponent that wasn’t ranked at all. Across the 32 markets, the strongest occupancy weekend of 2025 had less to do with who was playing than when the game happened. Eighteen of the 32 schools recorded their best occupancy weekend of the year in October, and seven of those landed on the same Saturday, October 18. That is peak national travel season: comfortable weather, fall color in most of these college towns, and a full slate of conference games that still mattered for the playoff race.
A big-name opponent does help. Ohio State, Florida, Kentucky, and Georgia each recorded their best occupancy weekend of 2025 when Texas came to town. Arkansas, LSU, and Missouri saw the same pattern with Texas A&M, and Nebraska’s top weekend of the year came against Michigan. But in towns where football is the main local industry, an average opponent can still draw near-record occupancy just by landing in that October window. Auburn’s best occupancy weekend of 2025 came against South Alabama, and Michigan State’s came against Youngstown State, both well below blue-blood territory.
The worst weekends tell the same story in reverse, and they cluster just as tightly. Nineteen of the 32 schools recorded their lowest occupancy weekend of the season on one of two dates: September 6 or November 22. October doesn’t appear on the bottom list at all. The two low points have different causes. Early September lows come from season-opening games where a school pays a smaller, weaker opponent to travel in for a game it is all but guaranteed to win, and nobody plans a trip around. The late November low is different. Several of those games are real conference matchups, sometimes rivalries, that simply fall during Thanksgiving week, when cold weather and competing holiday plans pull demand down no matter who is playing.
Put together, the best and worst weekends point to a consistent conclusion: calendar timing, not opponent quality, is the biggest single lever on game weekend lodging demand in these markets.
| School | Market | Best Weekend Opponent | Best Weekend Occupancy | Worst Weekend Opponent | Worst Weekend Occupancy | Occupancy Gap in pp | ADR Gap |
|---|---|---|---|---|---|---|---|
| Alabama | Tuscaloosa | Tennessee | 94.4% | Eastern Illinois | 44.2% | 50.3 | $230 |
| Indiana | Bloomington | Illinois | 97.4% | Kennesaw State | 50.9% | 46.5 | $93 |
| Penn State | State College | Oregon | 98.6% | Florida International | 53.2% | 45.3 | $165 |
| Arkansas | Fayetteville/Bentonville | Texas A&M | 97.1% | Arkansas State | 52.6% | 44.5 | $57 |
| Texas A&M | College Station | South Carolina | 96.4% | Utah State | 52.7% | 43.7 | $161 |
| Auburn | Auburn | South Alabama | 98.1% | Mercer | 59.8% | 38.3 | $124 |
| Georgia | Athens | Texas | 94.8% | Charlotte | 57.6% | 37.2 | $186 |
| Kentucky | Lexington | Texas | 96.7% | Tennessee Tech | 60.9% | 35.8 | $89 |
| Missouri | Columbia, MO | Texas A&M | 96.5% | Central Arkansas | 60.9% | 35.6 | $87 |
| LSU | Baton Rouge | Texas A&M | 95.0% | Western Kentucky | 59.5% | 35.5 | $70 |
| Illinois | Champaign / Urbana | Rutgers | 95.6% | Northwestern | 61.9% | 33.7 | $57 |
| Ole Miss | Oxford | Florida | 93.8% | Georgia State | 62.0% | 31.8 | $353 |
| Tennessee | Knoxville | Arkansas | 95.3% | East Tennessee State | 64.4% | 30.9 | $61 |
| Purdue | Lafayette | Illinois | 93.6% | Southern Illinois | 63.4% | 30.3 | $39 |
| Ohio State | Columbus | Texas | 93.0% | Grambling | 63.0% | 30.0 | $52 |
| Mississippi State | Starkville | Tennessee | 97.5% | Alcorn State | 68.0% | 29.6 | $57 |
| Michigan | Ann Arbor | Wisconsin | 91.5% | Purdue | 62.5% | 29.1 | $133 |
| Iowa | Iowa City | Minnesota | 95.5% | Michigan State | 66.5% | 29.1 | $15 |
| South Carolina | Columbia, SC | Alabama | 91.2% | Coastal Carolina | 62.8% | 28.4 | $52 |
| Florida | Gainesville | Texas | 97.7% | South Florida | 69.4% | 28.3 | $78 |
| Vanderbilt | Nashville | LSU | 94.4% | Kentucky | 67.1% | 27.3 | $105 |
| Minnesota | Minneapolis | Nebraska | 90.9% | Michigan State | 64.0% | 26.9 | $42 |
| Oregon | Eugene | Wisconsin | 96.3% | Minnesota | 70.6% | 25.7 | $28 |
| Washington | Seattle | Ohio State | 84.5% | Purdue | 61.6% | 22.9 | $58 |
| Wisconsin | Madison | Ohio State | 92.3% | Illinois | 69.6% | 22.7 | $59 |
| Michigan State | Lansing / East Lansing | Youngstown State | 93.1% | Penn State | 72.5% | 20.6 | $4 |
| Nebraska | Lincoln | Michigan | 94.6% | Iowa | 75.2% | 19.4 | $49 |
| Maryland | College Park / Hyattsville | Nebraska | 82.9% | Towson | 65.0% | 17.8 | $28 |
| Oklahoma | Oklahoma City | Kent State | 89.3% | Missouri | 74.8% | 14.5 | $12 |
| Texas | Austin | Sam Houston | 75.3% | San Jose State | 63.7% | 11.6 | $17 |
| Rutgers | Edison / New Brunswick | Oregon | 77.8% | Miami (OH) | 69.0% | 8.8 | $8 |
| Northwestern | Evanston | Purdue | 84.9% | UCLA | 78.1% | 6.8 | $32 |
Early Season Games Are Already Booking Up for 2026
It is still early in the 2026 booking window, so a lot can change between now and kickoff. But the pattern so far is clear: home games in September and October are pacing well ahead of home games in November. Part of that gap is simply the calendar. A November game is still two to three months out, while most September and October games are right around the corner, so November has had far less time to accumulate reservations. That gap should narrow as those later dates approach, the same way any single game’s occupancy builds the nearer you get to kickoff.
In smaller markets, though, more guests book early. In a market with only a few hundred listings, waiting means risking that nothing is left, so travelers heading to a small college town for a big weekend tend to lock in a stay as soon as they know they’re going. In a market with thousands of listings, that risk is much smaller, so guests can afford to wait.
Looking at how many of each school’s 2026 home games have already crossed 60% occupancy, the smallest towns are already mostly booked, well ahead of what the calendar effect alone would predict. Nebraska has crossed 60% occupancy on six of its seven home games. Illinois, Iowa, LSU, and Mississippi State have each crossed that mark on five of seven.
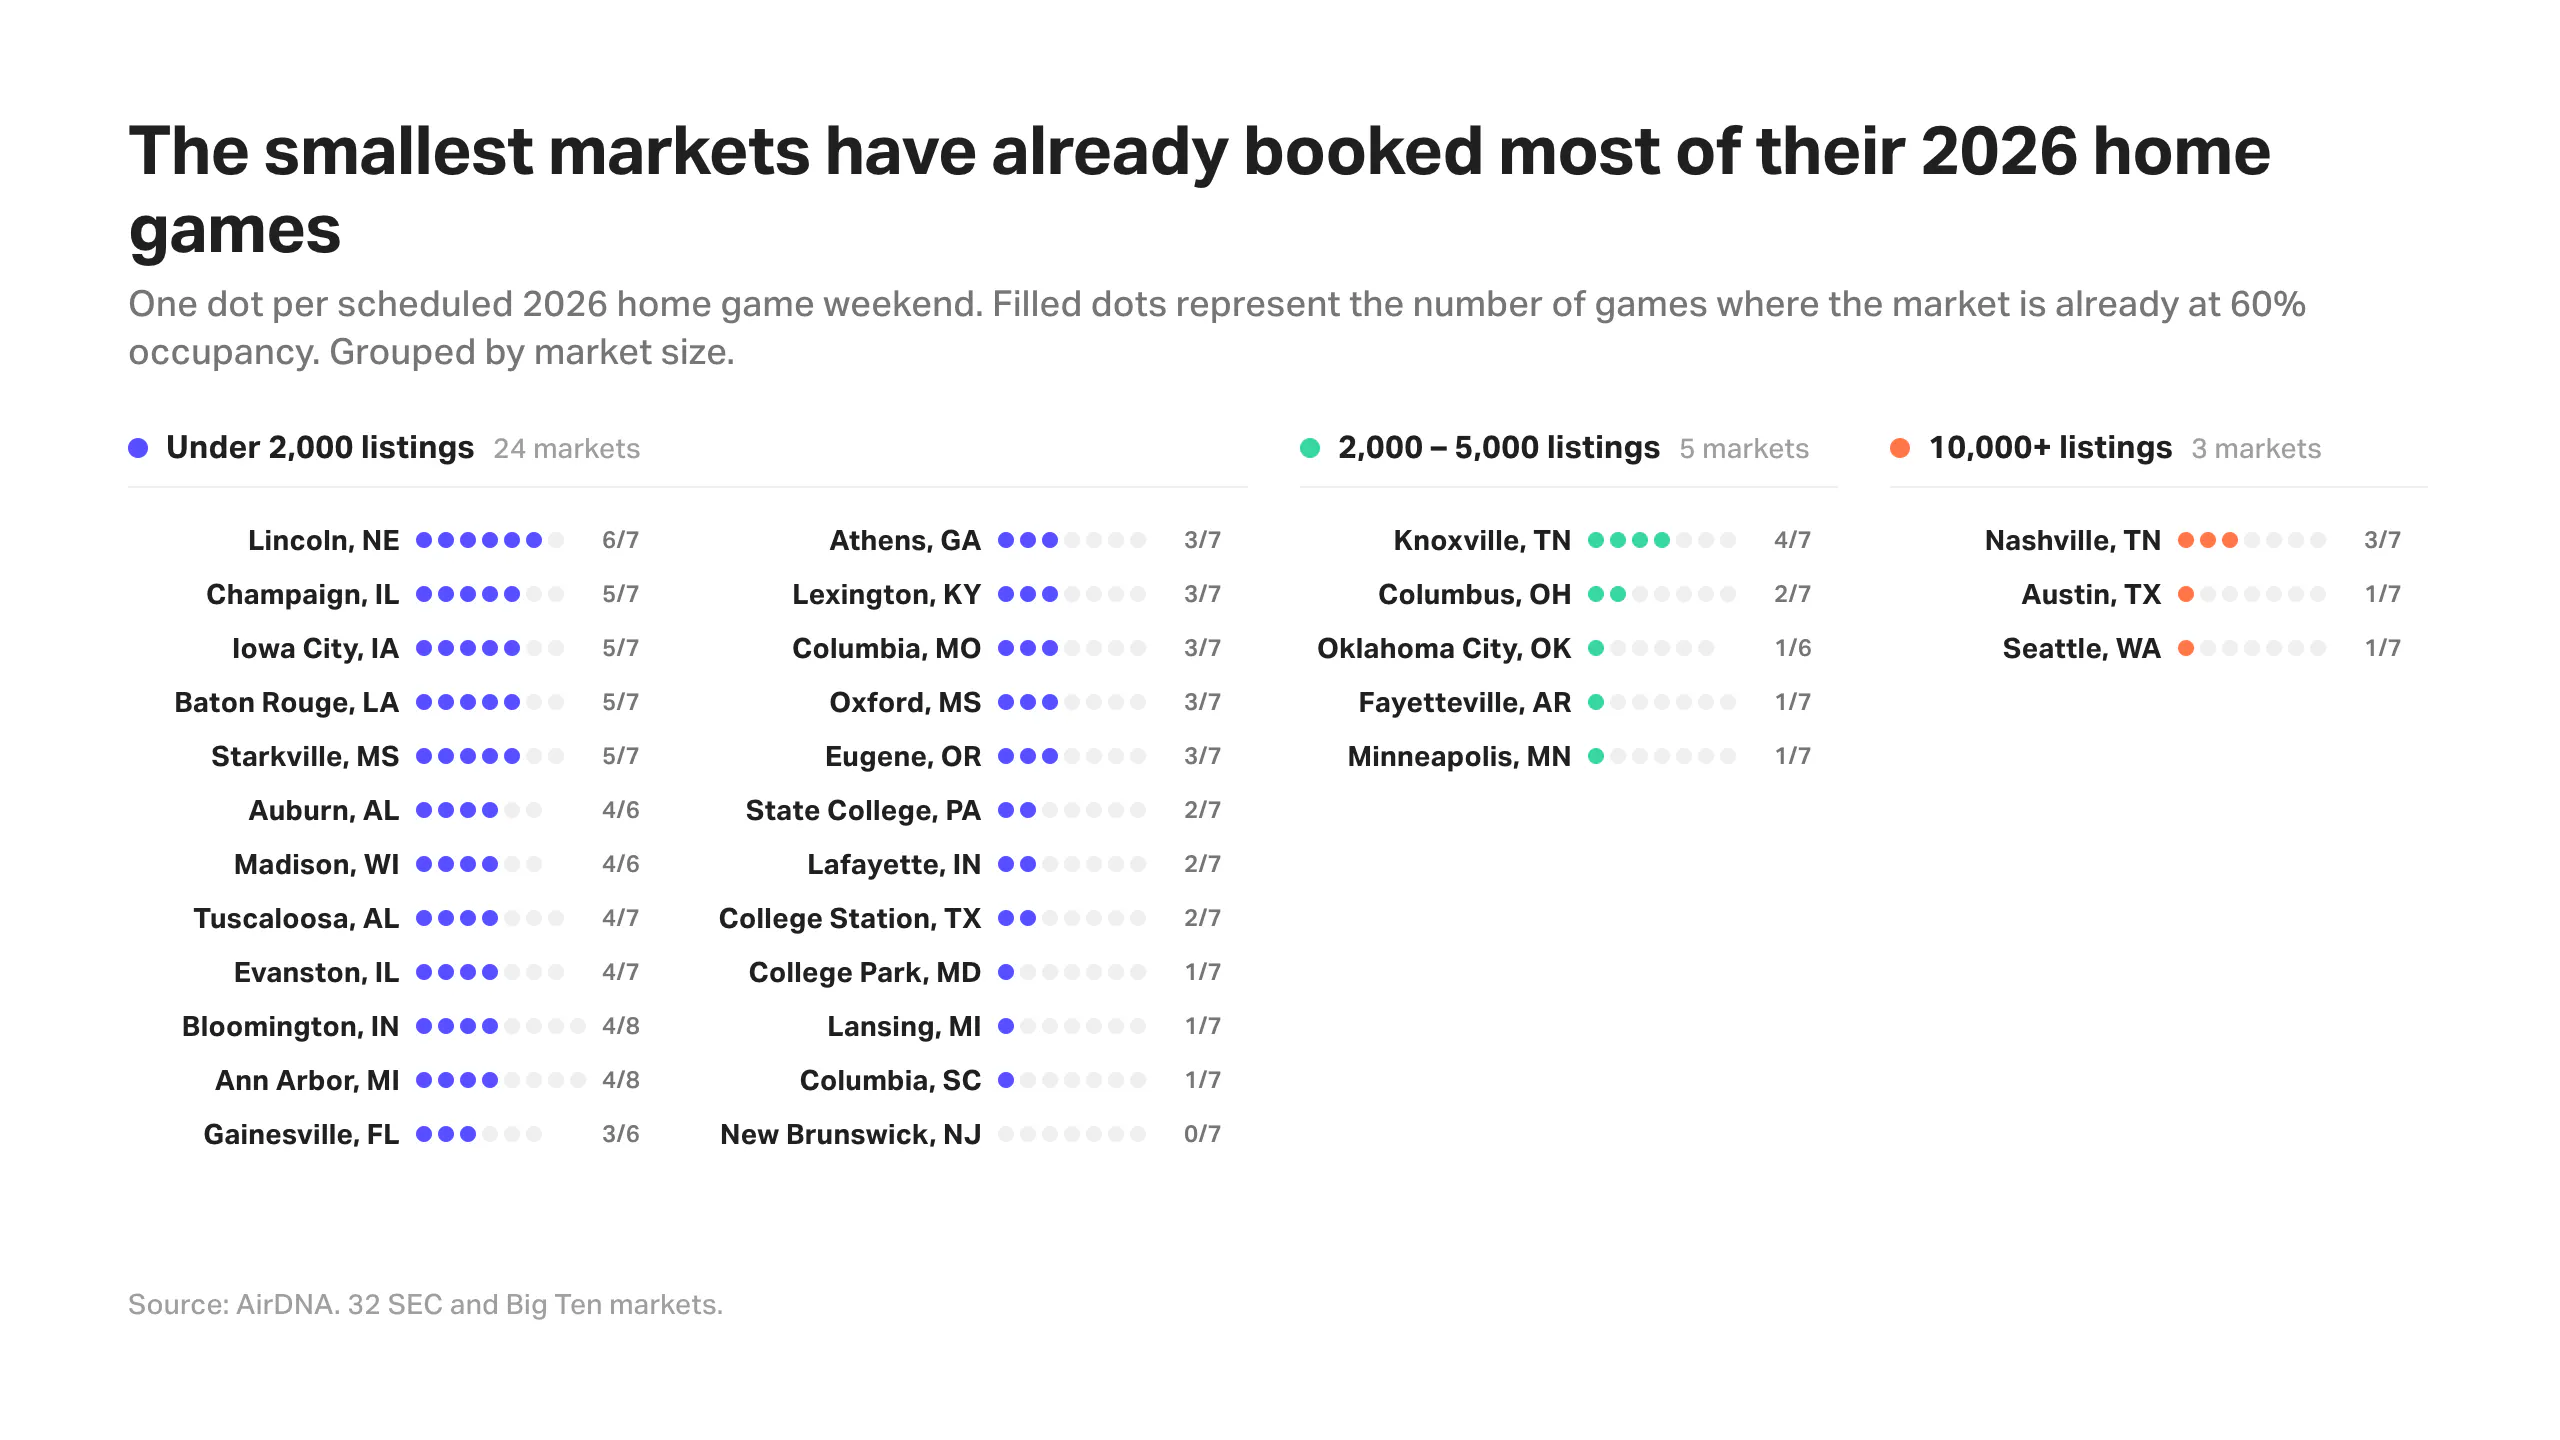
Larger markets take longer to fill in. Columbus has crossed 60% occupancy on two of seven home games so far, Lexington is at three of seven, and Minneapolis and Austin are both at one of seven. Rutgers stands out even among the larger markets: none of its seven home games have crossed 60% occupancy yet, including its early September opener, which suggests football brings a smaller lift to begin with in that market, on top of the calendar effect.
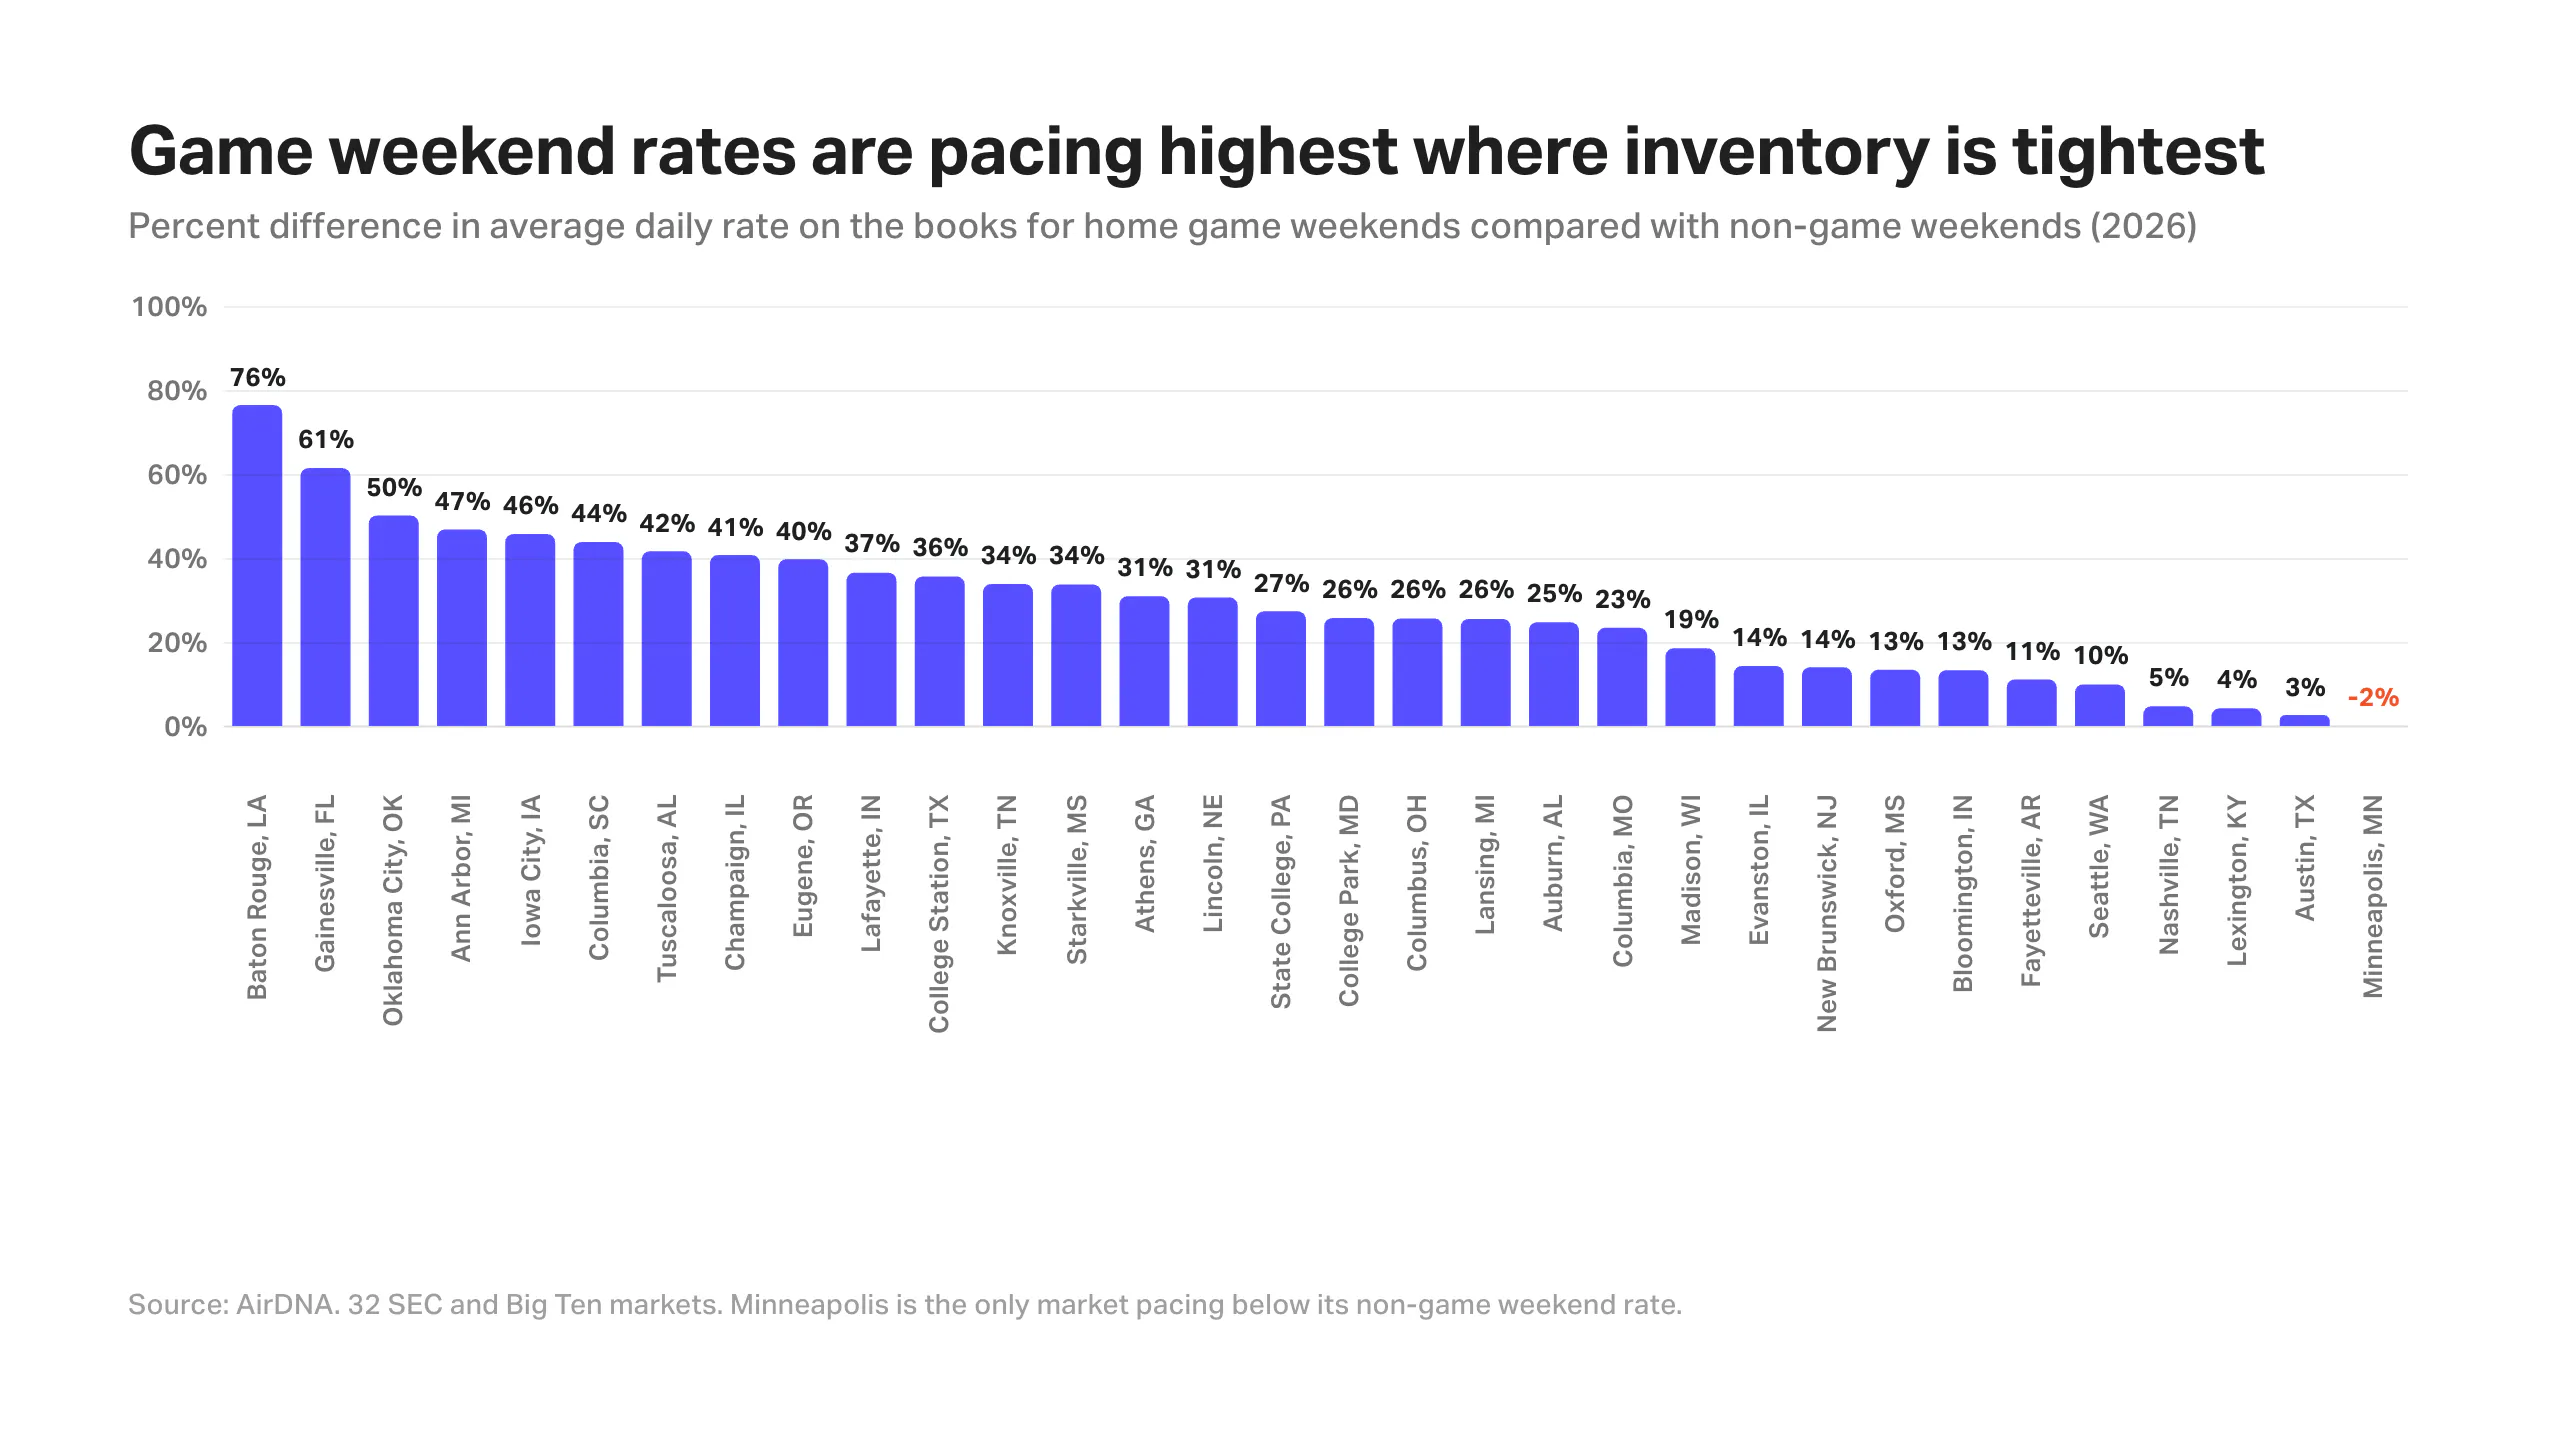
Rates are pacing strong across the board. In 21 of the 32 markets, 2026 home game weekend rates are already running more than 20% ahead of non-game weekend rates for the season. The strongest early gains are in Baton Rouge, Louisiana, where LSU home game rates are pacing 76% ahead of non-game rates, followed by Gainesville, Florida (+61%), Oklahoma City (+50%), Ann Arbor, Michigan (+47%), and Iowa City, Iowa (+46%). Gains are still modest in a handful of markets. Nashville, Lexington, and Austin are all pacing under 5% ahead of non-game rates, and Minneapolis is pacing slightly below its non-game rate. In many of these markets the games currently posting the highest occupancy also carry the highest average nightly rates, a sign that demand and pricing are moving together rather than one lagging the other.
To track how each individual home game is performing, we built an interactive dashboard covering current occupancy and booked rates for every 2026 home game across all 32 markets as of August 24. Select a market to see each of its home games plotted by occupancy and rate, so you can quickly spot which weekends are already strong and which still have room to book.
What This Means for Hosts
The story across all 32 markets is the same: home game weekends are worth more the smaller the market, but the lift is real almost everywhere. In the smallest towns, occupancy, rates, and revenue can each multiply several times over on a home game weekend, while even the largest markets pick up a meaningful, if smaller, boost.
Football season is one of the most important stretches of the year for hosts to watch rates closely. In the smallest towns, where a handful of home game weekends can carry a fifth or more of annual revenue, getting stuck at a low rate on a weekend when nearly every listing in town books is a costly mistake to make even once. In bigger markets the calculation cuts both ways. Not every home game weekend fills the entire town, so pricing too aggressively risks sitting unbooked, while pricing too conservatively risks leaving money on the table for the one game each season where occupancy climbs above 90%.
Pricing tools such as AirDNA’s Adapt can help hosts monitor and adjust rates game by game, so you don’t have to worry about getting booked for less than you’re worth or sitting empty. By analyzing the booking performance of nearby comparable properties, Adapt sets rates well ahead of the booking window and continually refines them as market occupancy trends evolve.
Stop Guessing Your Nightly Rate
Most hosts price on gut feel. Adapt prices every night on real demand, real competition, and what drives bookings.
FAQs
How much of a college town’s short-term rental revenue comes from football weekends?
In the smallest markets, a great deal. Home game weekends account for 26% of annual short-term rental revenue in Oxford, Mississippi, 24% in Tuscaloosa, Alabama, and about a fifth in Auburn, Alabama. In midsize markets such as Knoxville, Tennessee, the share is closer to 10%, and in the largest markets such as Austin, Texas and Seattle, Washington it falls to around 5%.
How much does occupancy rise on a college football home game weekend?
Across the 32 SEC and Big Ten markets AirDNA analyzed, occupancy on home game weekends topped 80% in 22 markets and ran between 70% and 80% in another nine. The largest swings are in the smallest towns: Starkville, Mississippi averages 34% occupancy on a non-game weekend and 87% on a Mississippi State home game weekend.
Which college football market sees the biggest revenue lift on game weekends?
Tuscaloosa, Alabama. RevPAR on an Alabama home game weekend ran 455% above a typical fall weekend in 2025, the largest lift of any market in the study. Oxford, Mississippi (+360%), Auburn, Alabama (+319%), and Starkville, Mississippi (+285%) follow.
Does a bigger opponent mean a better weekend for hosts?
Not usually. Calendar timing matters more than opponent quality. Eighteen of the 32 schools recorded their best occupancy weekend of 2025 in October, and seven of those fell on the same Saturday, October 18. Auburn’s best weekend came against South Alabama and Michigan State’s against Youngstown State, neither a marquee matchup.
When should hosts in college towns set their game weekend rates?
Early, especially in small markets. In markets with only a few hundred listings, guests book as soon as they know they’re going: Nebraska has already crossed 60% occupancy on six of its seven 2026 home games. Waiting until the weekend is close means the highest-demand nights may already be booked at a rate set months earlier.
ARTICLE SUMMARY
AirDNA analyzed 2025 performance and 2026 booking pace across 32 SEC and Big Ten short-term rental markets to measure what a college football home game weekend is actually worth. In the smallest college towns, seven or eight weekends carry up to a quarter of the market’s entire annual revenue, and revenue per available rental climbs as much as 455% over a typical fall weekend. In the largest markets the lift is real but modest. Timing, not opponent quality, turns out to be the single biggest lever on game weekend demand.
Linda Rollins
Senior Research Analyst
Linda Rollins is a Senior Research Analyst at AirDNA and a self-managing short-term rental host, which means she understands the market as both an analyst and an operator. She writes research and blogs for AirDNA and for Adapt, its revenue management tool, making her work a go-to resource for investors trying to find and size up the right opportunities, and for operators looking to understand changing market dynamics and find concrete ways to improve occupancy, rates, and guest experience. Her data is regularly cited in major news outlets, and she has a knack for bringing both the numbers and the story behind them. In her free time, Linda enjoys spending time with her family, traveling, and looking for good eats.
