U.S. Review May 2026: So Begins the Summer of Promise
Published: June 12, 2026
Last updated: October 22, 2026

Bram Gallagher
Key Takeaways:
- The U.S. STR market showed signs of improvement in May, with occupancy rising 0.5% year-over-year despite softer demand growth and continued supply expansion.
- Listing growth remained modest at 3.0%, as elevated mortgage rates and a sluggish housing market continued to limit new supply.
- ADR growth slowed to 2.1%, while the Repeat Rent Index (RRI) continued to outpace ADR, suggesting existing operators are maintaining stronger pricing power than new entrants.
- The outlook for the second half of 2026 remains positive, with strong pacing through November and additional demand expected from summer travel, the FIFA World Cup, and America’s 250th Anniversary celebrations.
The news seems gloomy, and confidence is low, but there is still plenty to be optimistic about in the STR market.
We dubbed 2025 the “Tale of Two Halves” because the first half of the year delivered outsized growth, while the second half was lackluster and saw occupancy decline year-over-year (YoY). In many ways, 2026 may be the reverse. Tough comparisons and a severe snow drought contributed to weak growth in the first half of the year, but the outlook for the second half is far more encouraging. Summer travel and the World Cup are helping to boost demand, occupancy returned to growth in May, and pacing through November looks strong.
There’s a bright side to STRs, after all!
At a Glance: Key U.S. STR Performance Metrics for May 2026
- Revenue per Available Rental (RevPAR) increased 2.6% year-over-year (YoY) to $147.97
- Available listings reached 1.73 million, a 3.0% increase YoY
- Demand nights were up 1.5%
- Occupancy averaged 57.2%, up 0.5% YoY
- Average Daily Rates (ADR) climbed to $258.91, up 2.1% from last year
- The Repeat Rent Index (RRI) rose 3.5% YoY
- Total nights booked were up 3.5% from 2025
Economic Outlook
The May jobs report from the Bureau of Labor Statistics (BLS) surprised to the upside, capping off three consecutive months of solid gains. The labor market has weathered considerable uncertainty stemming from the Trump Administration’s policies, including the broad tariffs announced last April and the ongoing energy crisis resulting from the U.S. war in Iran. The unemployment rate remained at 4.3%, historically low and broadly in line with levels seen over the past two years.
The strongest gains came from the leisure and hospitality sector, which added 70,000 jobs in May. Although this coincided with renewed strength in hotel performance, most of those gains occurred in food service and leisure activities. At the same time, the strong headline figures mask a more rigid labor market, with hiring and firing rates hovering near lows not seen since the recovery from the Great Recession. Around 2 million workers also remained long-term unemployed. As a result, both workers and businesses appear to be delaying major labor decisions while awaiting greater clarity on energy prices and the productivity impact of AI investments.
Meanwhile, a labor market showing few signs of immediate distress has all but dashed hopes for lower interest rates from the Federal Reserve, with expectations of a December rate hike becoming increasingly plausible. Given the Fed’s dual mandate of maximum employment and 2% inflation, the May CPI reading of 4.2% year-over-year is likely to keep the focus firmly on price stability.
Listing Growth Picks up Slightly in May, Likely Will Stay Lower Longer
May growth in available listings reached 3.0%, up only slightly from 2.8% in April. At the start of the year, expectations for falling interest rates led us to believe that 2026 would be a strong year for new investment and that listing growth would accelerate accordingly. While some of that may be beginning to materialize, with mortgage rates briefly falling below 6% in February, the ongoing conflict over the Strait of Hormuz quickly pushed rates back toward 6.5%, and the anticipated spring home sales boom never materialized.
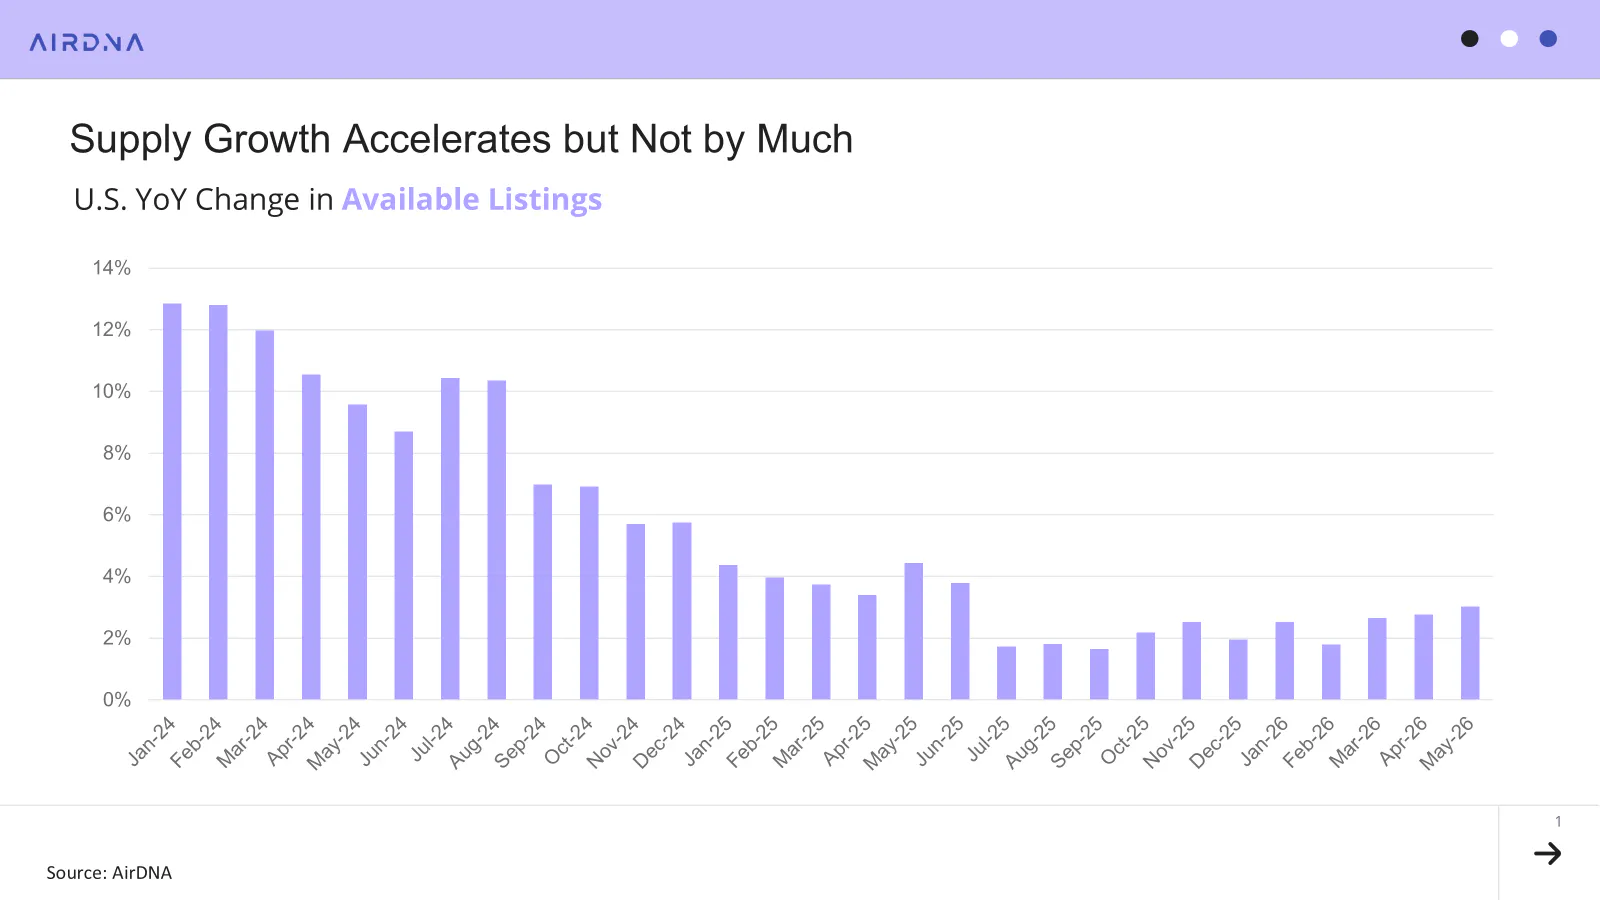
Growth rates may still pick up modestly in the second half of the year, as the back half of 2025 was generally sluggish and provides easier year-over-year comparisons.
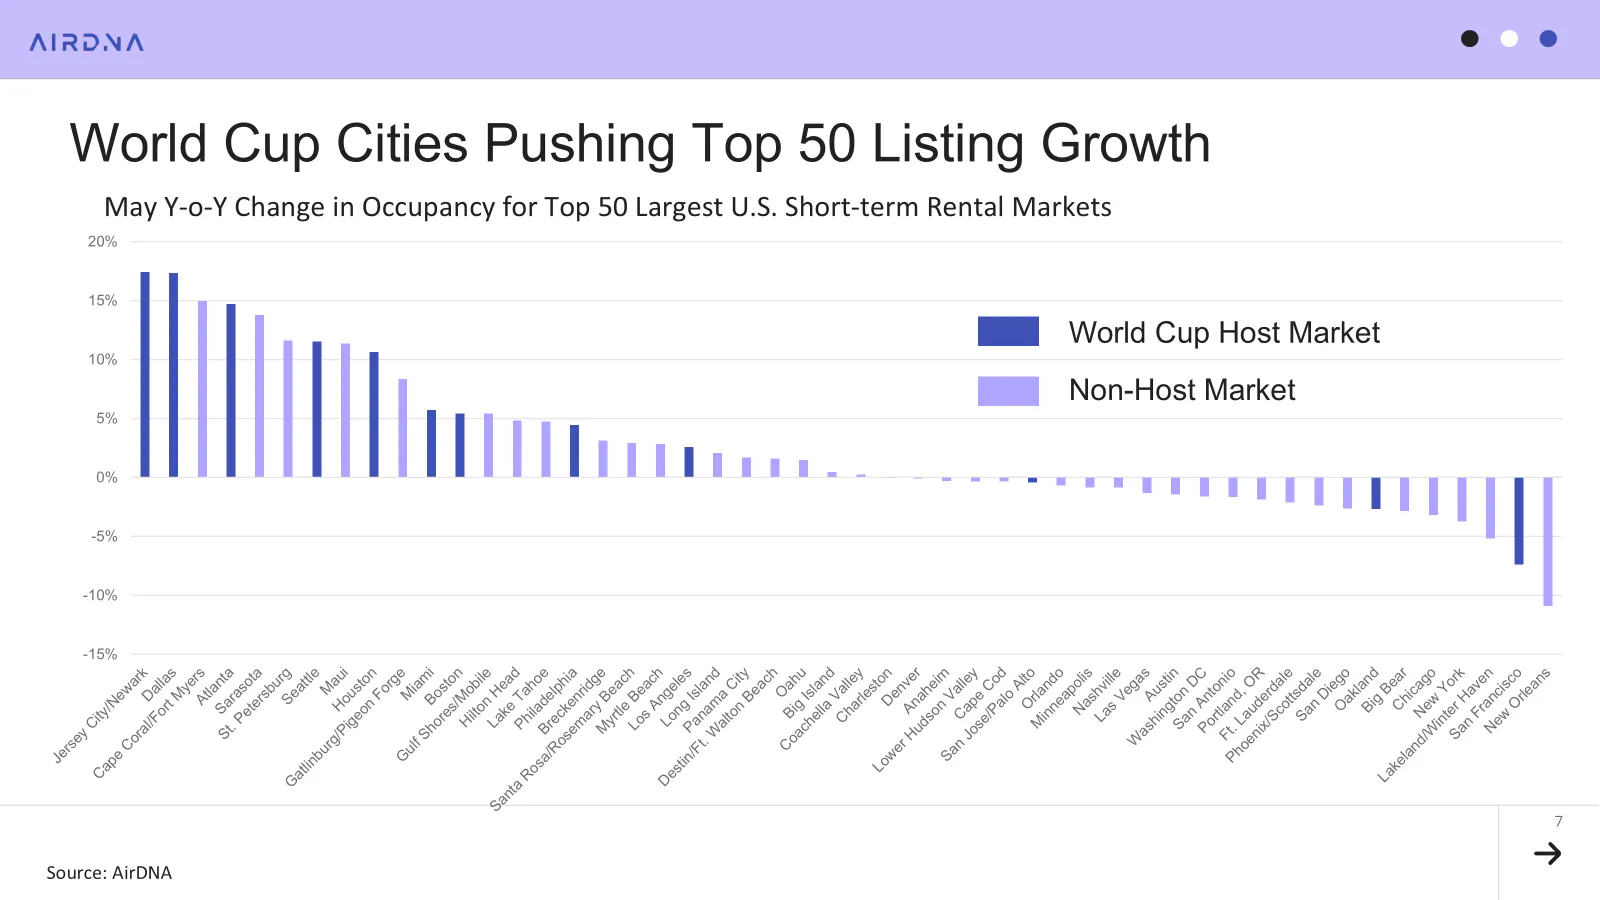
Additionally, many urban markets are seeing strong supply growth as they prepare to host World Cup matches beginning in June and continuing through July. For a deeper look at supply changes in World Cup host cities, explore our blog and interactive dashboard: Short-Term Rental Demand Builds Ahead of the 2026 FIFA World Cup.
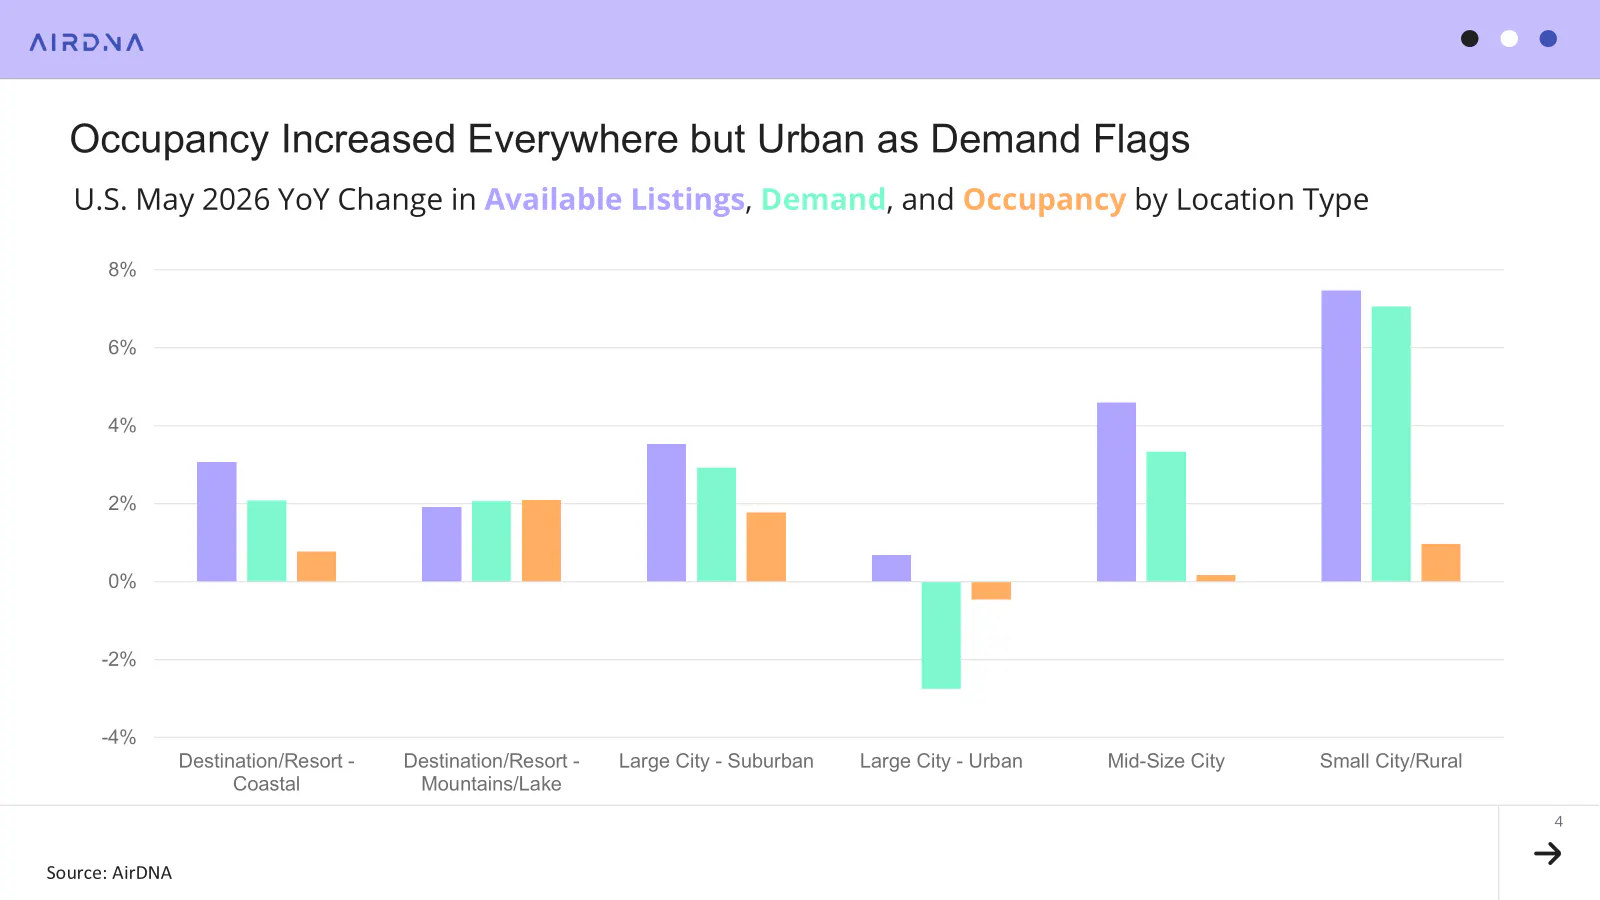
However, urban markets as a whole recorded the slowest supply growth of any location type. Many large metros continued to see declines in available listings, particularly Bay Area markets, New York City, and New Orleans, where ongoing regulations continue to impact supply. Urban markets were also the only location type to record declines in both demand and occupancy year-over-year, as travelers increasingly favored mid-sized cities and small towns.
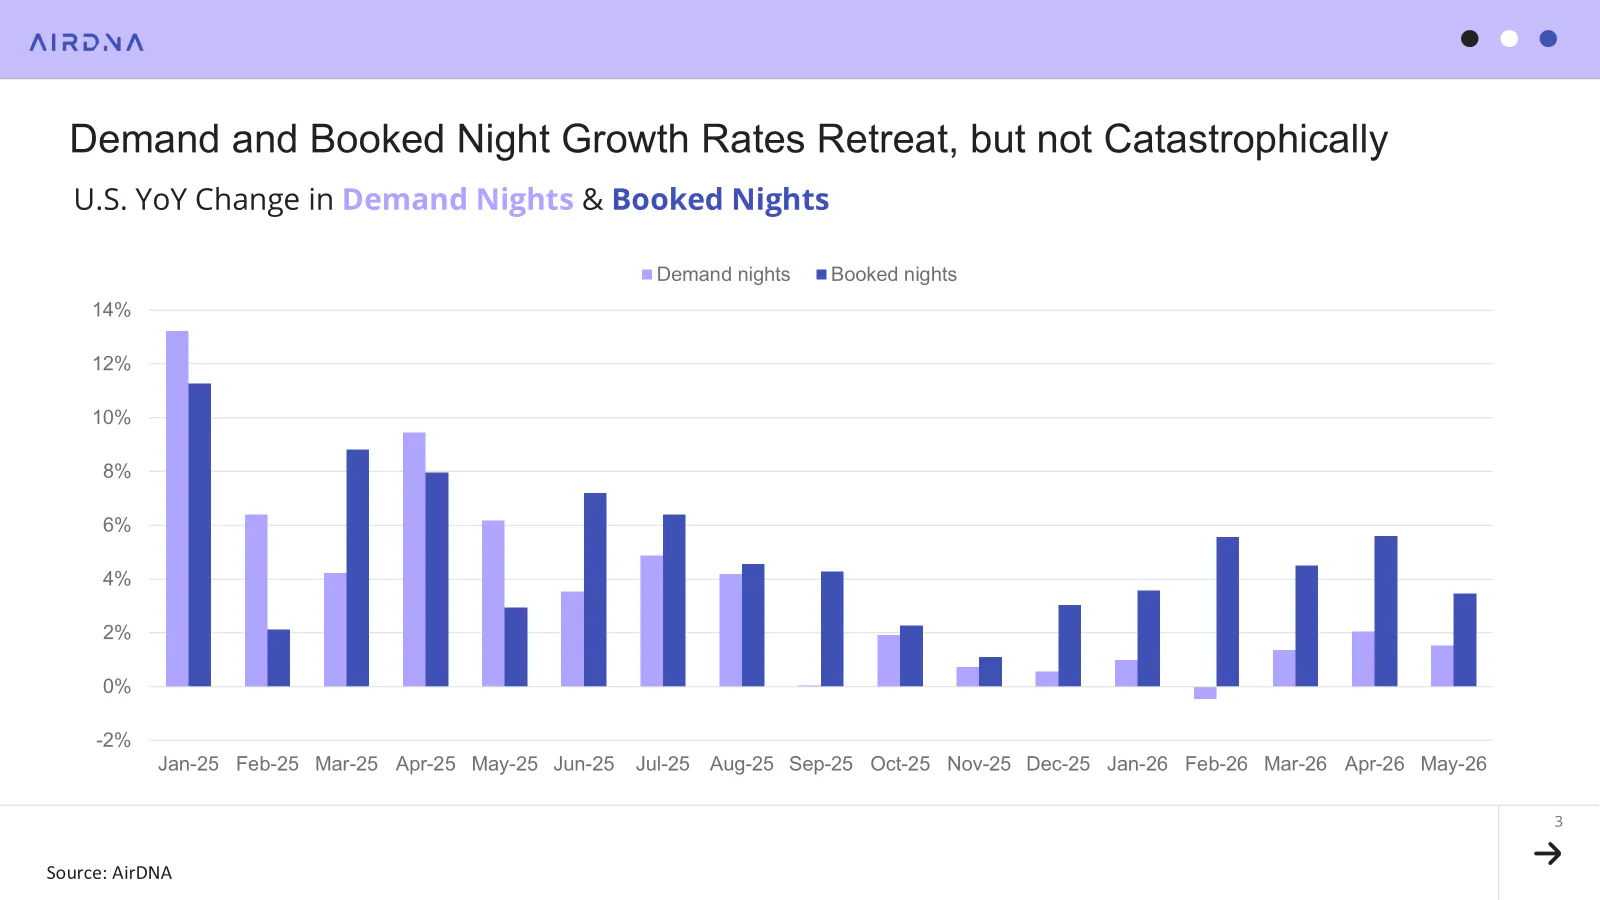
Demand Growth Softens but Comparisons Improve
Demand growth softened in May, rising 1.5% year-over-year, down from 2.0% in April. However, this comes against a strong comparison period, as demand grew 6.2% in May 2025. Looking ahead, we expect demand growth to strengthen in the second half of the year as comparisons to 2025 become considerably easier.
Booking growth also moderated, increasing 3.5% compared to April’s 5.6% growth rate. Even so, this performance was still stronger than May 2025, when bookings increased by 2.9%.
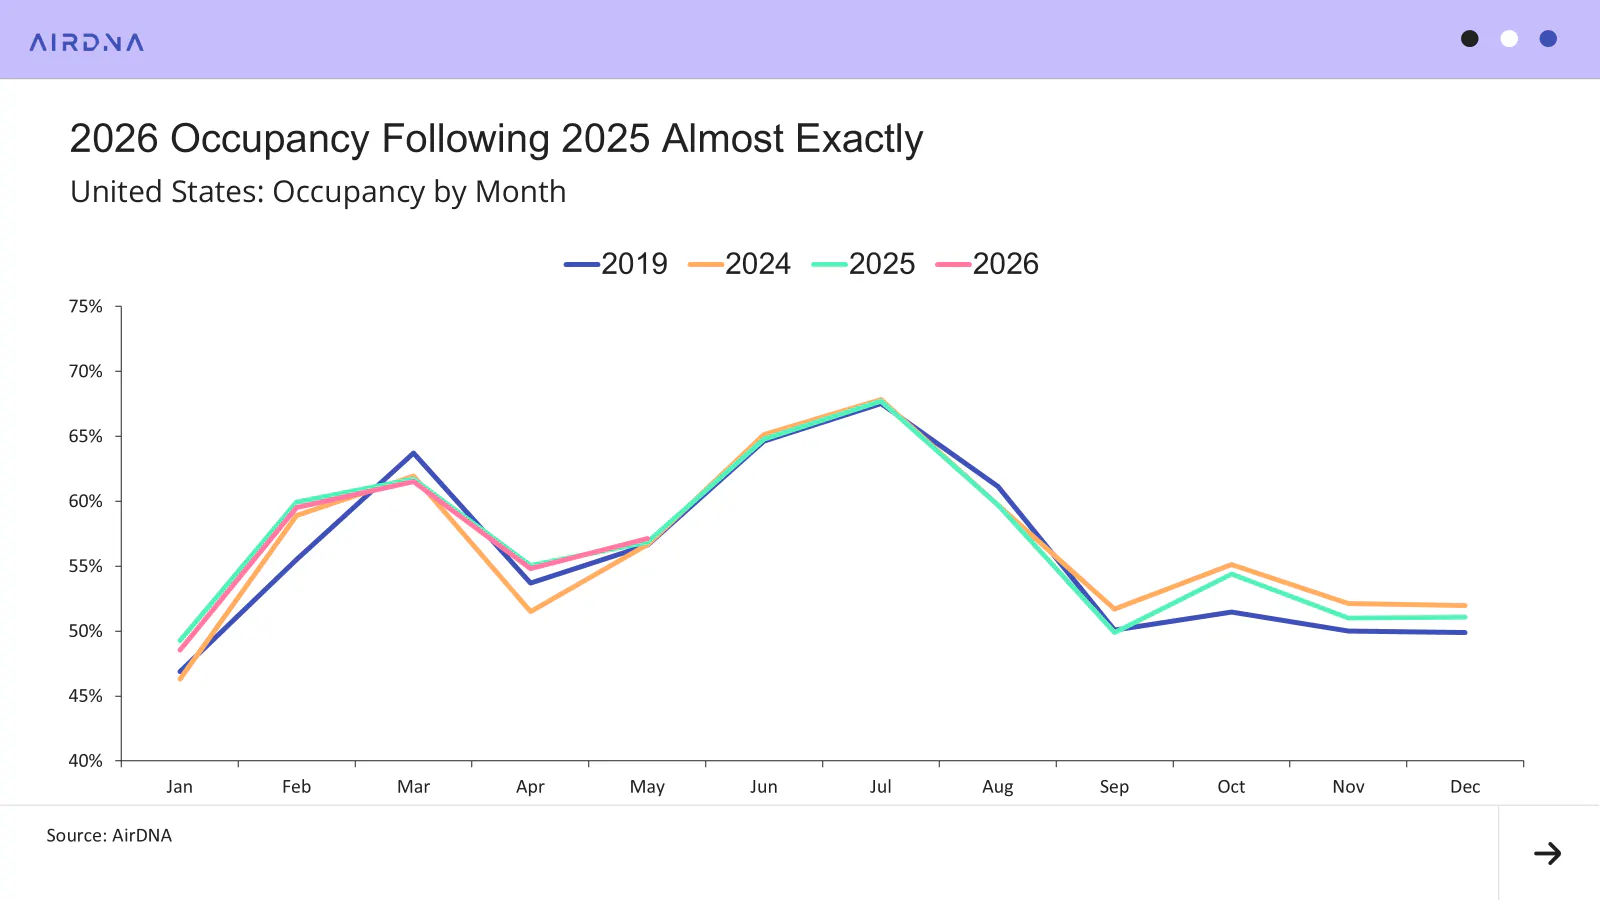
Although available listing growth continued to outpace demand growth, the number of nights offered per listing declined slightly, resulting in a net occupancy gain. Occupancy in 2026 has remained broadly in line with 2025 levels and well above 2024. May marked a shift from the slight year-over-year occupancy declines seen earlier in the year to a modest increase of 0.5%.
With easier comparisons for the remainder of the year and high interest rates continuing to limit new housing inventory, we expect occupancy to post further modest gains through the rest of 2026.
ADR Growth Slows While RRI Remains Elevated
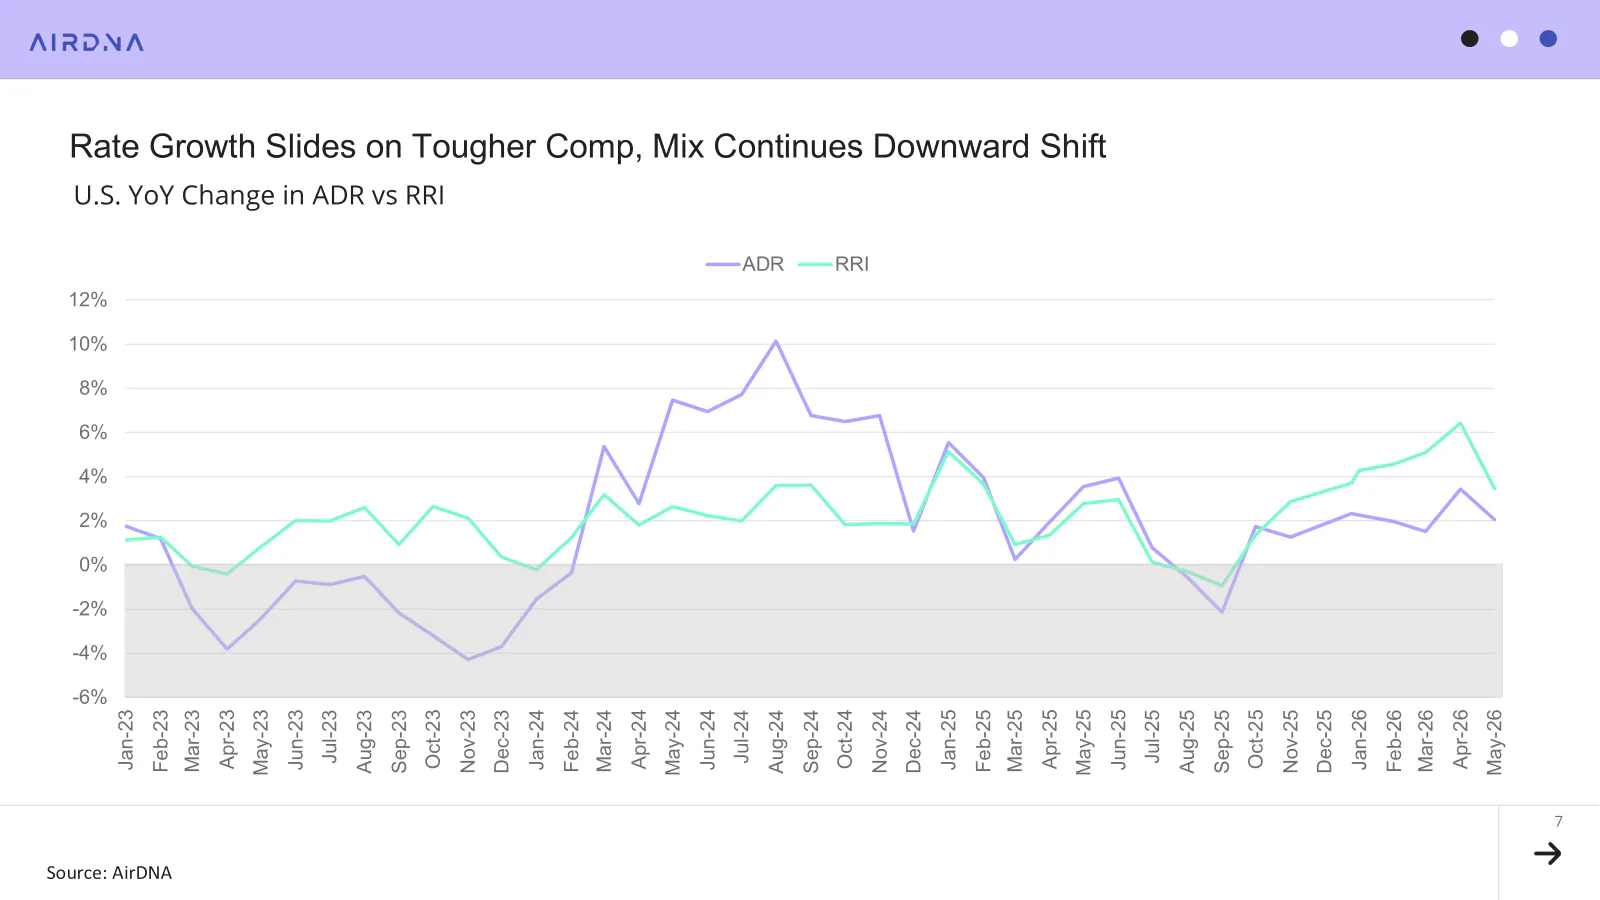
Turning to prices, ADR growth slowed to 2.1% in May, down from 3.4% in April. However, the May growth rate remains broadly in line with the trend seen since October 2025, with ADR growth consistently hovering around 2%. Some of the slowdown can also be attributed to a strong comparison period, as ADR grew 3.6% in May 2025, up from 1.9% in April 2025—a near mirror image of the pattern seen in April and May 2026.
A more compelling dynamic exists between ADR and the AirDNA Repeat Rent Index (RRI), which excludes mix shift to show how existing operators are changing prices.
Since November 2025, RRI growth has exceeded ADR growth, a pattern last seen during the high-inflation environment of 2022 and 2023. Inflation can put pressure on household budgets and reduce discretionary spending, which may encourage newer listings to compete more aggressively on price. Existing operators, by contrast, benefit from review history and established demand, allowing them to maintain greater pricing power in an uncertain economic environment. As a result, mix shift can cause ADR growth to lag behind RRI growth.
The opposite tends to occur when consumer confidence is stronger and travelers seek out newer, larger, or more luxurious properties. This dynamic was particularly evident throughout 2024 and much of 2025.
Inflation sparked back to life after the Trump Administration's “Liberation Day” tariff announcement, as higher import costs were passed on to consumers. Just as those effects began to work their way through the economy, the Administration initiated the War on Iran, leading to the closure of the Strait of Hormuz and renewed inflationary pressure through higher energy prices. Throughout this period, RRI has continued to outpace ADR, potentially reflecting weaker consumer confidence.
Fortunately, while May’s 4.2% inflation rate is elevated, it remains well below the levels seen during the post-pandemic supply chain disruption. And although ADR growth continues to trail RRI growth, it has remained positive throughout 2026.
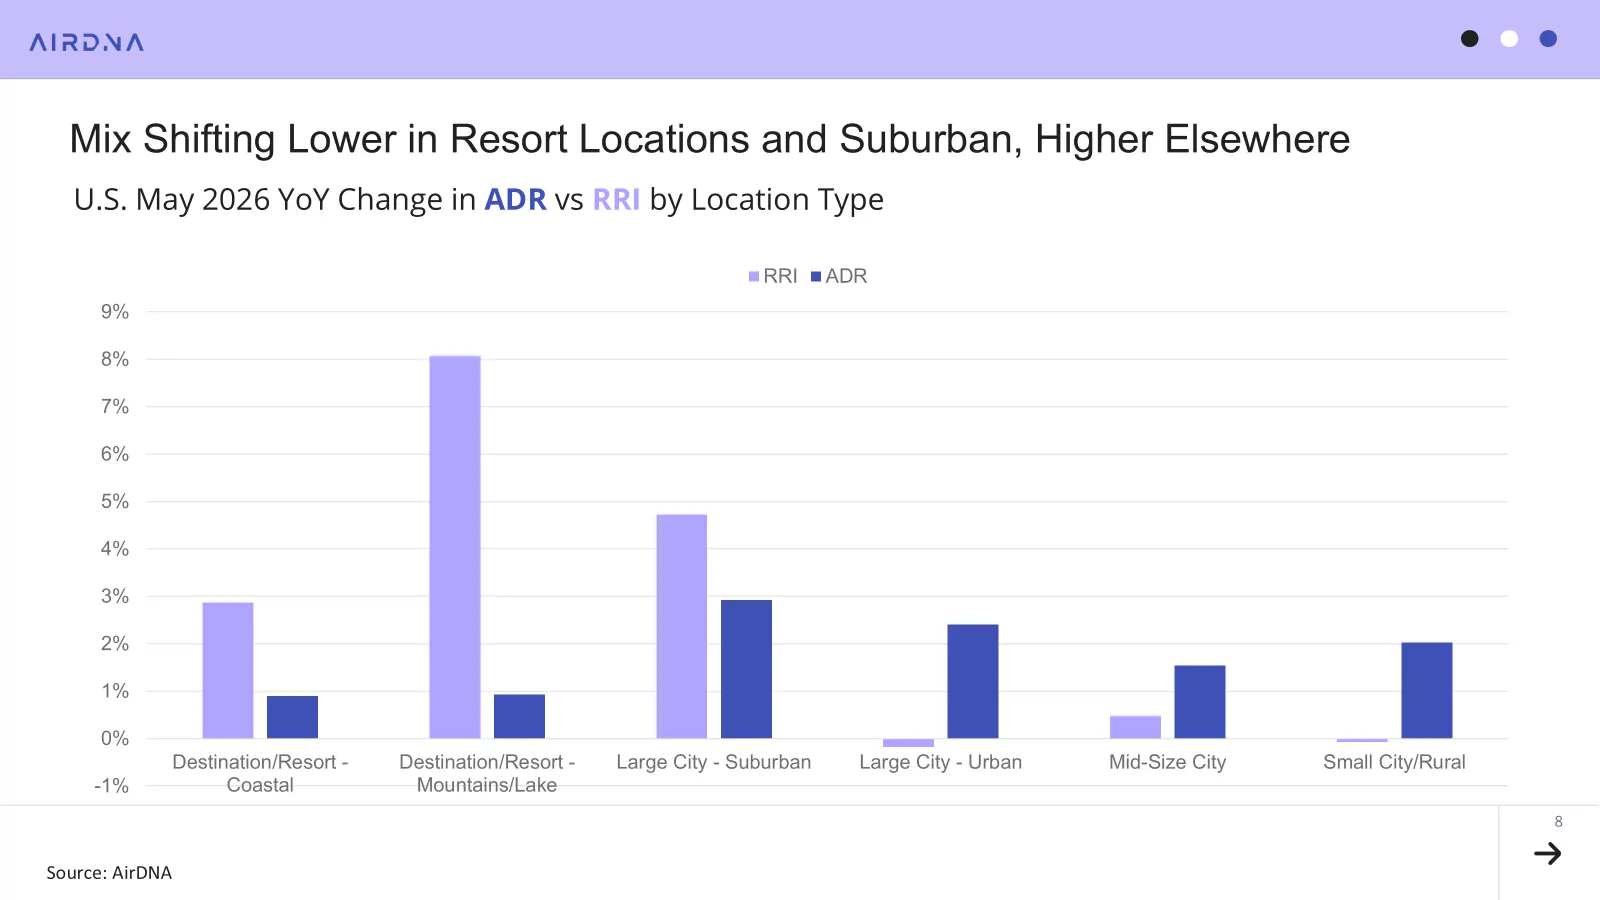
Interestingly, this pattern is not consistent across all location types. Destination and resort markets show the largest gap between RRI and ADR growth. These markets typically command higher rates and rely heavily on leisure travel, which may make travelers more sensitive to pricing changes.
Pacing Points to a Strong Second Half
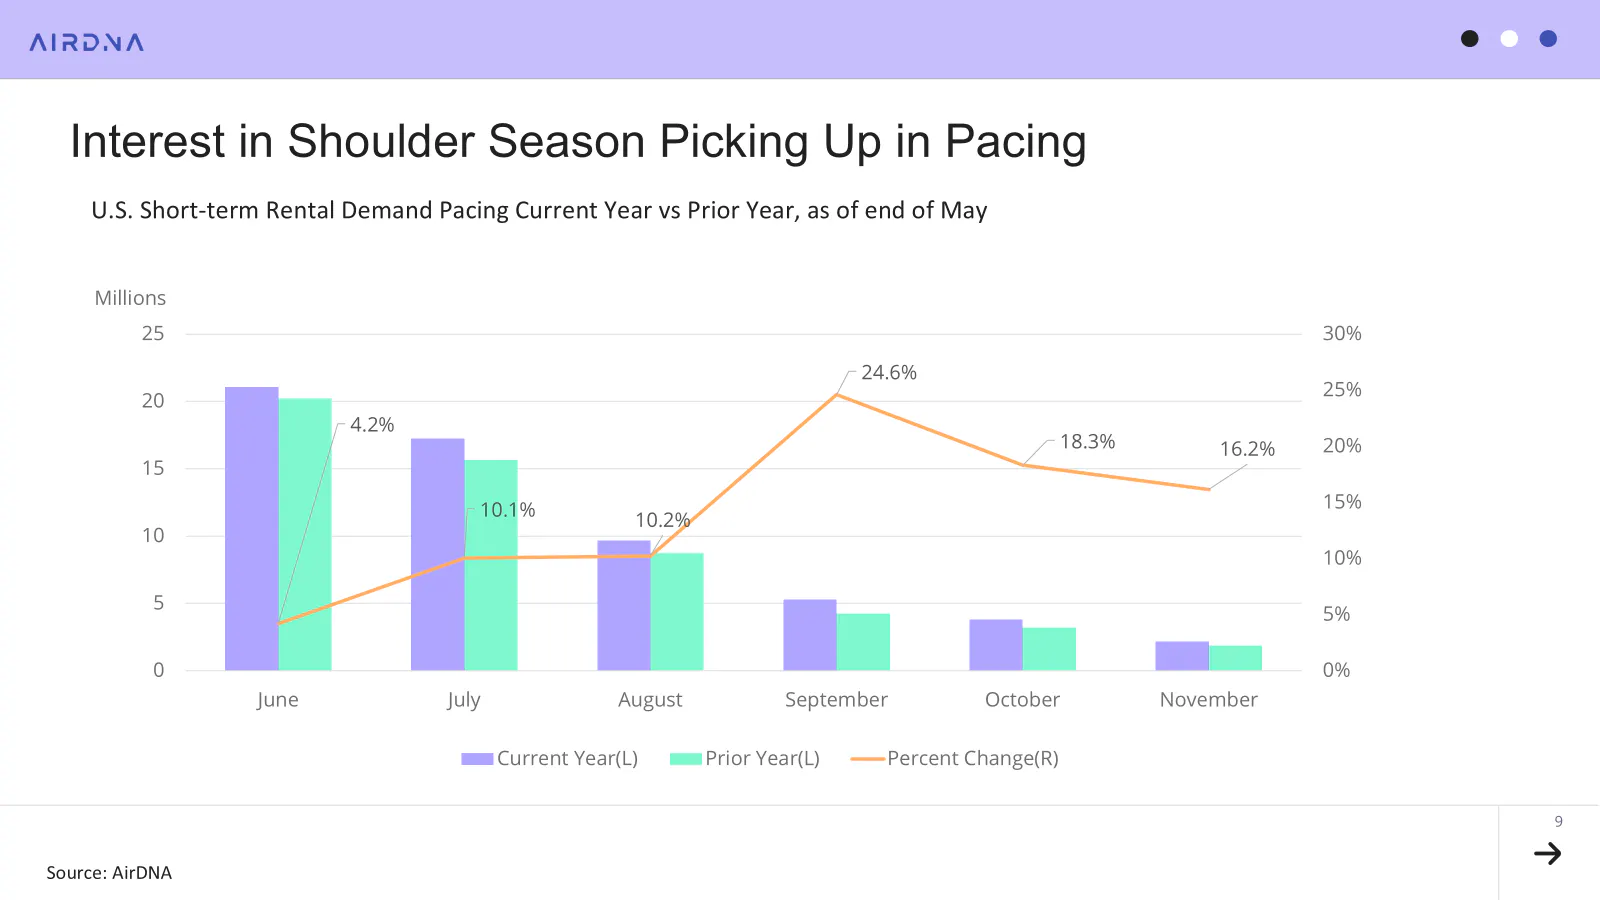
Looking ahead, the rest of the year is pacing strongly, particularly during the shoulder season from September through November. These months saw very weak demand growth in 2025, creating easier year-over-year comparisons that should support stronger performance in 2026.
The World Cup is also expected to provide a meaningful boost to demand across many urban markets. Beyond the host cities themselves, the tournament may also drive additional demand in secondary destinations as travelers extend their trips and add side excursions to their itineraries.
Fourth of July Demand Surges Ahead of America's 250th Anniversary
However, The World Cup isn’t the only event driving demand this summer!
This year’s Fourth of July celebrations coincide with the nation’s 250th Anniversary, elevating an already popular travel weekend into something even bigger. Nationwide, demand is currently pacing 10.3% ahead of the same time last year, with some markets seeing even stronger growth. Major celebrations are planned across the country, and several of the top-performing markets may also benefit from increased travel related to the World Cup.
Although World Cup matches have not yet been announced for July dates, several host cities appear among the top pacing markets for the holiday weekend. Miami is pacing 68% ahead of last year, while Philadelphia is up 59%. Houston (+38%) and Kansas City (+37%) also rank among the top ten. Washington, DC (+35%) is seeing significant growth as well, despite not hosting any World Cup matches.
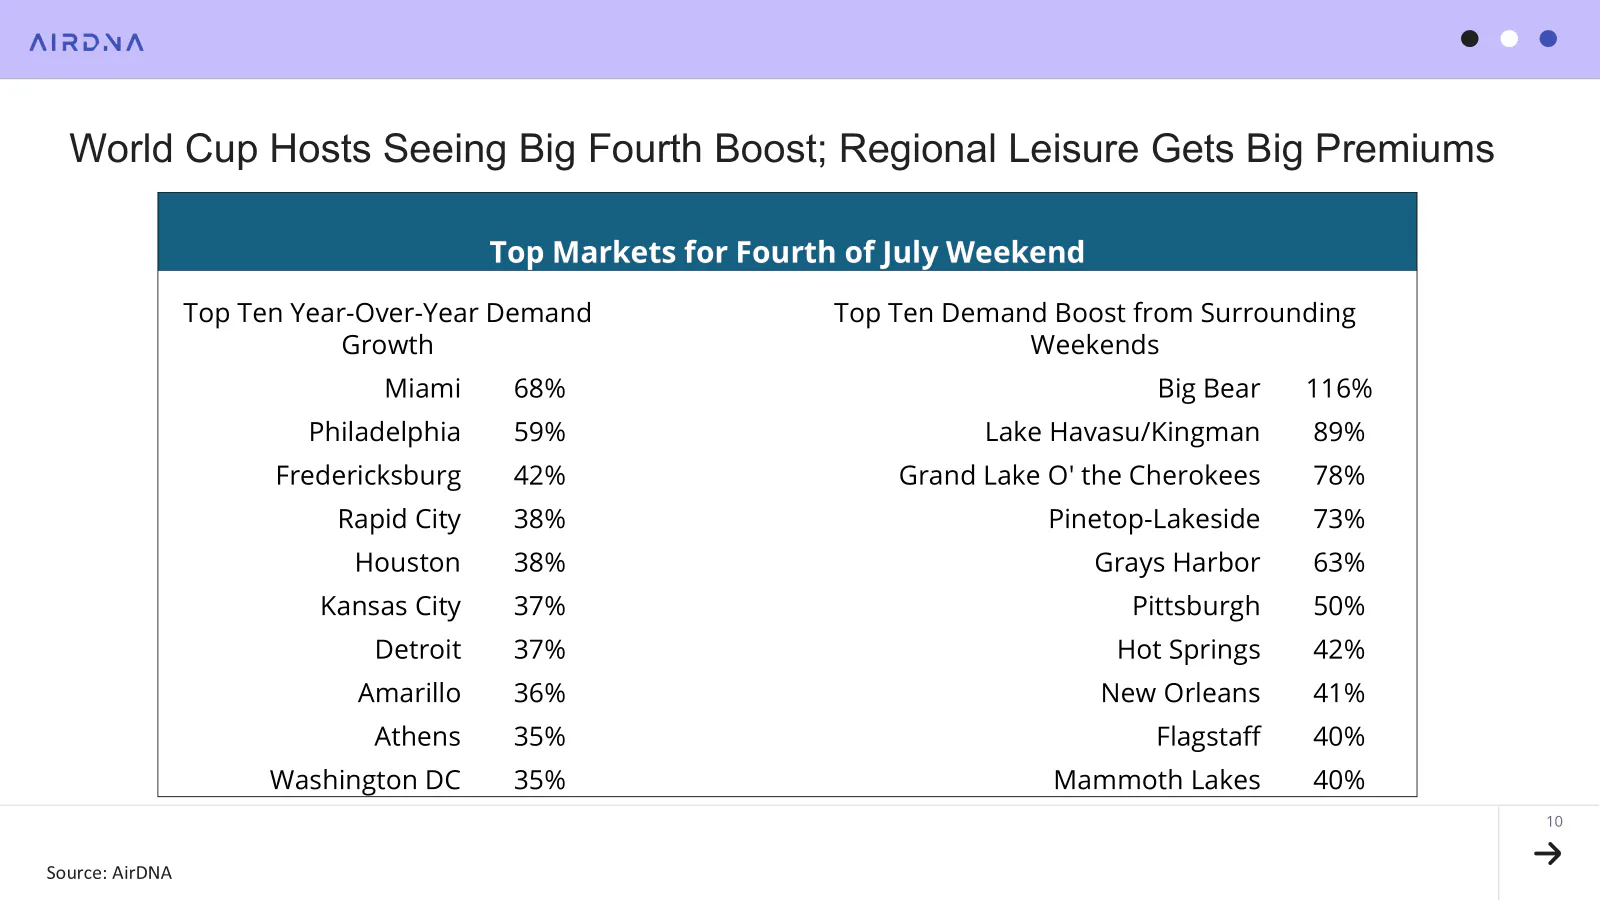
We also looked at which markets receive the biggest boost from the Fourth of July itself, regardless of year-over-year growth. To do this, we compared demand during the holiday weekend to the average demand on the weekends immediately before and after. The results suggest that many travelers are opting for regional mountain and lake destinations. California drive-to favorite Big Bear (+116%) tops the list, more than doubling its typical weekend demand, while several well-known lake destinations also saw substantial holiday demand boosts.
ARTICLE SUMMARY
The U.S. short-term rental market showed encouraging signs in May, with occupancy returning to growth, ADR remaining positive, and strong pacing pointing to a stronger second half of 2026. Summer travel, the FIFA World Cup, and America's 250th Anniversary celebrations are all expected to support demand in the months ahead.
Bram Gallagher
AirDNA Director of Economics and Forecasting
Bram Gallagher is an Economist at AirDNA, specializing in uncovering insights that drive smarter short-term rental decisions. He put his Ph.D. in Economics from the University of Georgia to work researching and forecasting hotel data with CBRE prior to joining AirDNA, as well as teaching economics at a number of universities. In his spare time, Bram enjoys making wooden furniture with hand tools.