Short-Term Rental Demand Builds Ahead of the 2026 FIFA World Cup
Published: February 5, 2026
Last updated: June 9, 2026

Linda Rollins
Key Takeaways
- Demand is surging across all host cities, with Mexico showing the sharpest growth and a wave of last-minute bookings still to come.
- Supply is moving fast to meet it, with new listings added in over the past two months, most of which will stay on the market after the tournament ends.
- Rate performance is splitting by market: supply-constrained cities are converting higher prices into real bookings; markets with more inventory are seeing guests push back.
The 2026 FIFA World Cup is on track to drive record-breaking travel across North America. Spanning 39 days and 16 host cities in the United States, Canada, and Mexico, it will be the largest tournament in FIFA history, with more than 5 million fans expected to attend at least one of the 104 matches between June 11 and July 19, 2026.
Hotels will absorb most of that demand, but short-term rentals are set to play a critical supporting role, particularly in host cities where hotel supply is tight. Airbnb, the official Alternative Accommodations and Experiences Booking Platform for the FIFA World Cup 2026, estimates that more than 380,000 guests will stay in Airbnb listings during the tournament, contributing approximately $3.6 billion to local host city economies.
AirDNA has been tracking short-term rental demand across Airbnb and Vrbo in all 16 host cities, and the booking data so far reinforces what the projections suggest. The 2026 tournament will deliver a meaningful lift to North American travel demand and revenue.
Bookings Are Surging Across World Cup Cities
Demand for World Cup dates is up 16% year-over-year (YoY) across host cities, with the steepest growth concentrated in Mexico. Bookings in Guadalajara and Monterrey are up more than 100% YoY, and bookings in Mexico City are up 42% YoY.
In the U.S., Kansas City leads YoY booking growth (+44%), followed by Dallas/Fort Worth (+30%) and Miami/Ft. Lauderdale (+28%). Most host cities are posting more than 10% YoY growth for tournament dates, though a handful, including Seattle, Vancouver, and San Francisco, are seeing muted or negative growth.
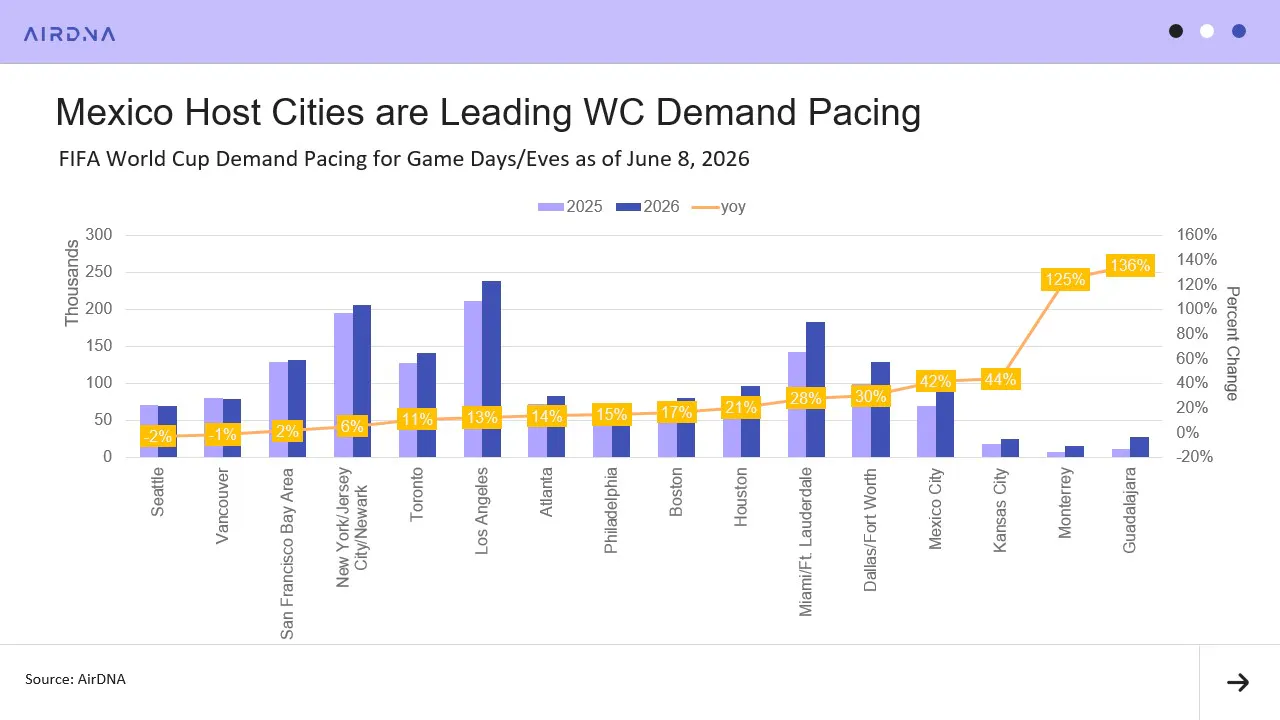
While the tournament kicks off this week, a significant share of demand has yet to materialize, and trends may still shift as last-minute bookings arrive. Across host cities, 2.3M nights are currently on the books for the Group Stage (June 10–27, 2026), an 11% increase from the same point last year. Closing the gap to last year's final total of 2.76M nights would require another 428K bookings, but with pacing still running ahead, overall demand is on track to surpass last year, though gains will vary considerably by market.
The clearest outperformers are Guadalajara and Monterrey, where supply is most constrained, and World Cup bookings surged ahead of last year's pace early in the booking window. Group Stage bookings in Guadalajara have already eclipsed last year's final total, and Monterrey is just 2,500 bookings away from doing the same.
Other markets tell a more mixed story. New York, Philadelphia, and Miami/Fort Lauderdale saw a clear surge in bookings following the Final Draw, but that momentum has since cooled, and their year-over-year leads have largely eroded. Seattle and Vancouver followed a similar trajectory, building strong early leads before losing ground as the tournament drew closer, with demand now trailing last year. San Francisco is the starkest outlier, having generated almost no incremental lift across the entire booking window.
World Cup Supply Has Been Racing to Meet Demand
On the other side of the equation, supply growth has become a major and increasingly influential factor shaping World Cup performance. The tightest markets have seen the strongest listing growth, as new hosts move to capture the income opportunity where rooms are scarce, and rate premiums run highest.
Since last June, listing growth has been led by Kansas City (+56%), Monterrey (+26%), and Guadalajara (+18%). All three markets have fewer than 50,000 hotel and short-term rental rooms, leaving supply tight even as new listings have been entering the market.
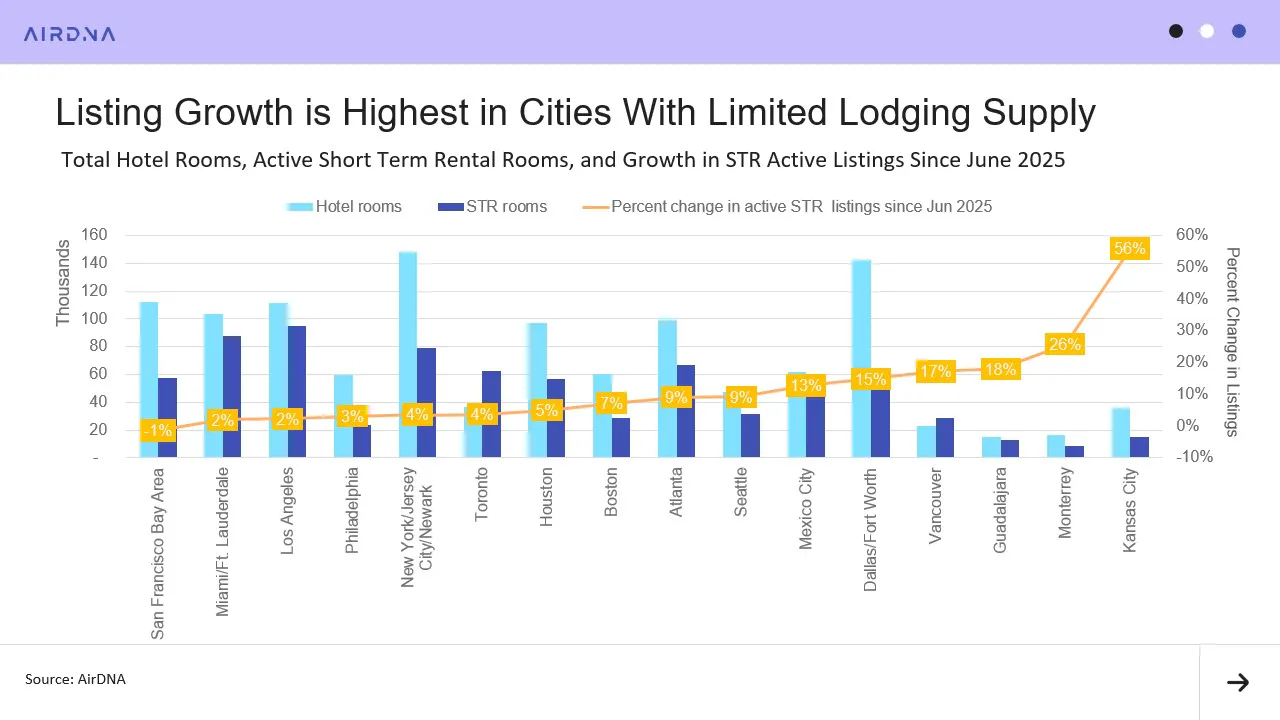
Listing growth has accelerated as the tournament has drawn closer. Active listings across host cities were up just 2% from last June at the start of this year. As of May, that figure has climbed to 6%, with most of the gain concentrated in March, April, and May.
Driving listing growth has been a surge in new supply coming online. New listings accounted for about 2% of active listings each month across host cities prior to March. In March and April, that share increased to 3.5%, and in May it was 5%.
All host cities have seen an increase in new listing share over the last three months, but several, including Vancouver, Monterrey, and Kansas City, have seen particularly notable growth. In Kansas City, active listings are up nearly 40% since February, with new listings making up 10% of all listings. Vancouver and Monterrey have both increased their active listings by more than 15% since February, with new listings accounting for 5-7% of those listings.
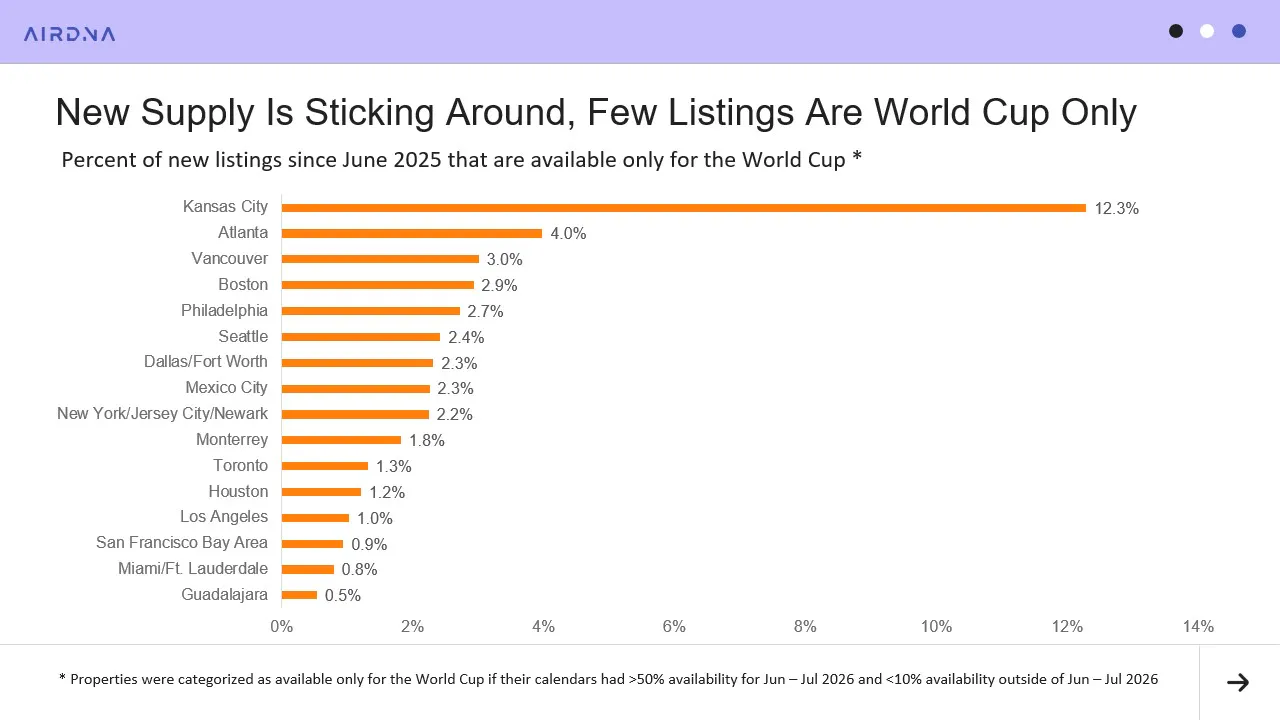
Despite the surge in new listings, very little of the new inventory is World Cup exclusive. In all but one host city, fewer than 5% of listings added since June 2025 are available exclusively for World Cup dates. This means most of the new inventory will remain on the market well after the tournament ends. Kansas City is the one exception, with 12% of new listings tied solely to World Cup dates.
Occupancy Is Highest for Group Stage Matches
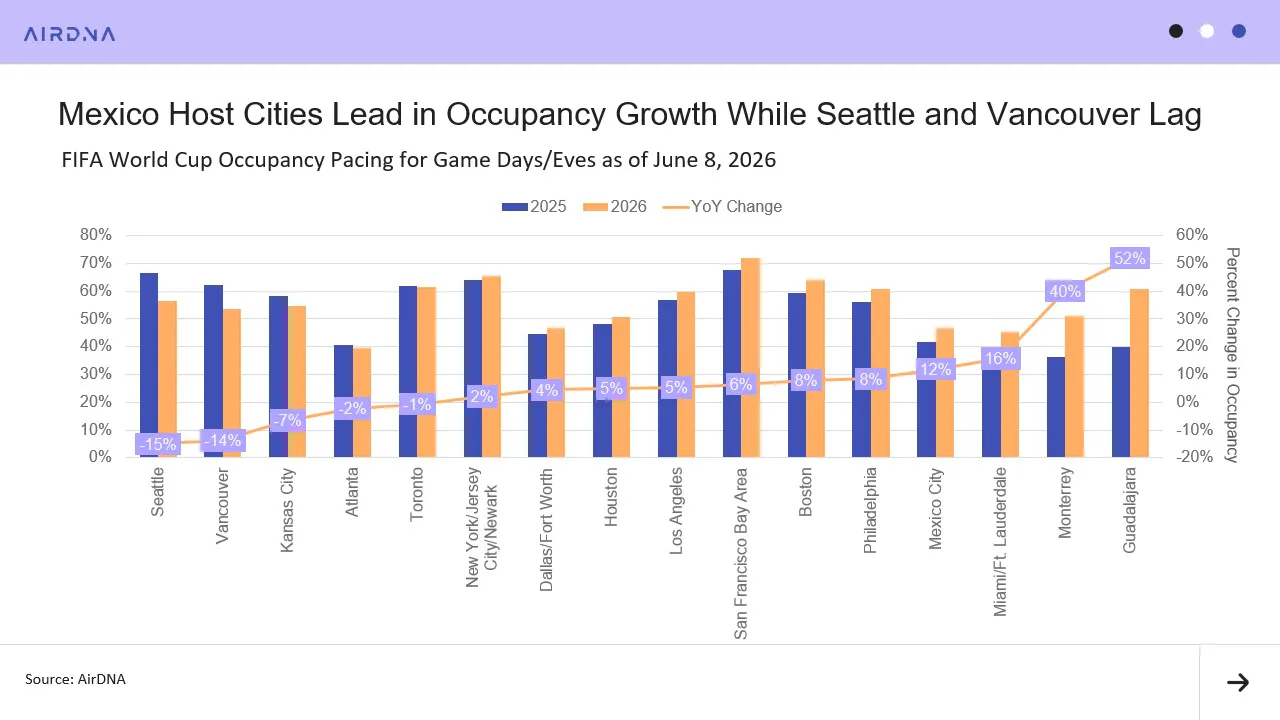
Despite the supply surge, occupancy is trending upward in 11 of the 16 host cities. Guadalajara is seeing the largest YoY occupancy gains, driven by dramatic YoY growth in booking activity. Seattle and Vancouver are the biggest laggards: soft demand combined with rising supply is pulling occupancy down YoY in both markets. Despite robust booking growth, Kansas City’s occupancy is down 7% YoY, as demand has been unable to keep pace with the immense supply growth the market has seen.
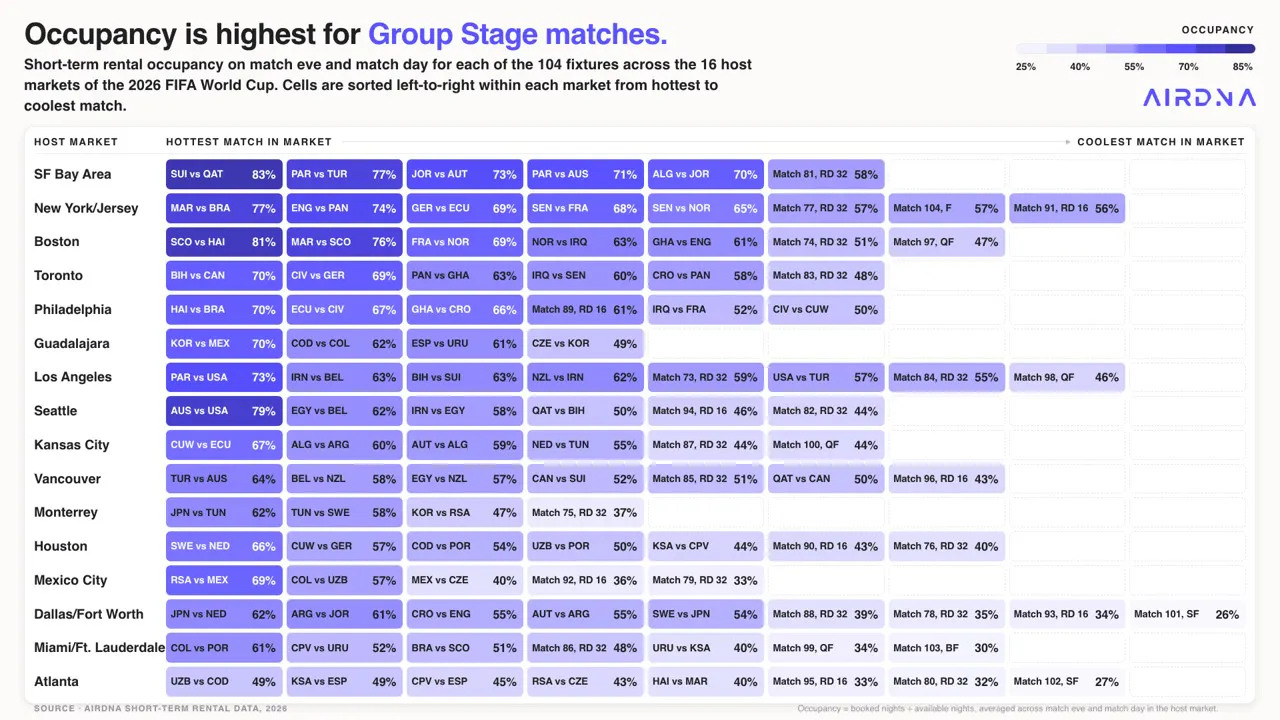
Group stage matches are currently commanding the highest occupancy rates across host cities. Occupancy for matches in qualifying rounds is lower as those dates are further out, and guests are waiting for the matchups to be determined before booking.
The group stage matches in which short-term rentals are filling up the fastest are:
- San Francisco Bay Area: SUI vs QAT (83%)
- Boston: SCO vs HAI (81%)
- Seattle: AUS vs USA (79%)
- San Francisco Bay Area: PAR vs TUR (77%)
- New York/Jersey City/Newark: MAR vs BRA (77%)
- Boston: MAR vs SCO (76%)
The group stage matches that are seeing the weakest demand and lagging the furthest behind in occupancy are:
- Miami/Ft. Lauderdale: URU vs KSA (40%)
- Atlanta: HAI vs MAR (40%)
- Mexico City: MEX vs CZE (40%)
- Atlanta: RSA vs CZE (43%)
- Atlanta: KSA vs CPV (44%)
Occupancy Trends Show Guests are Trading Down on Price and Size
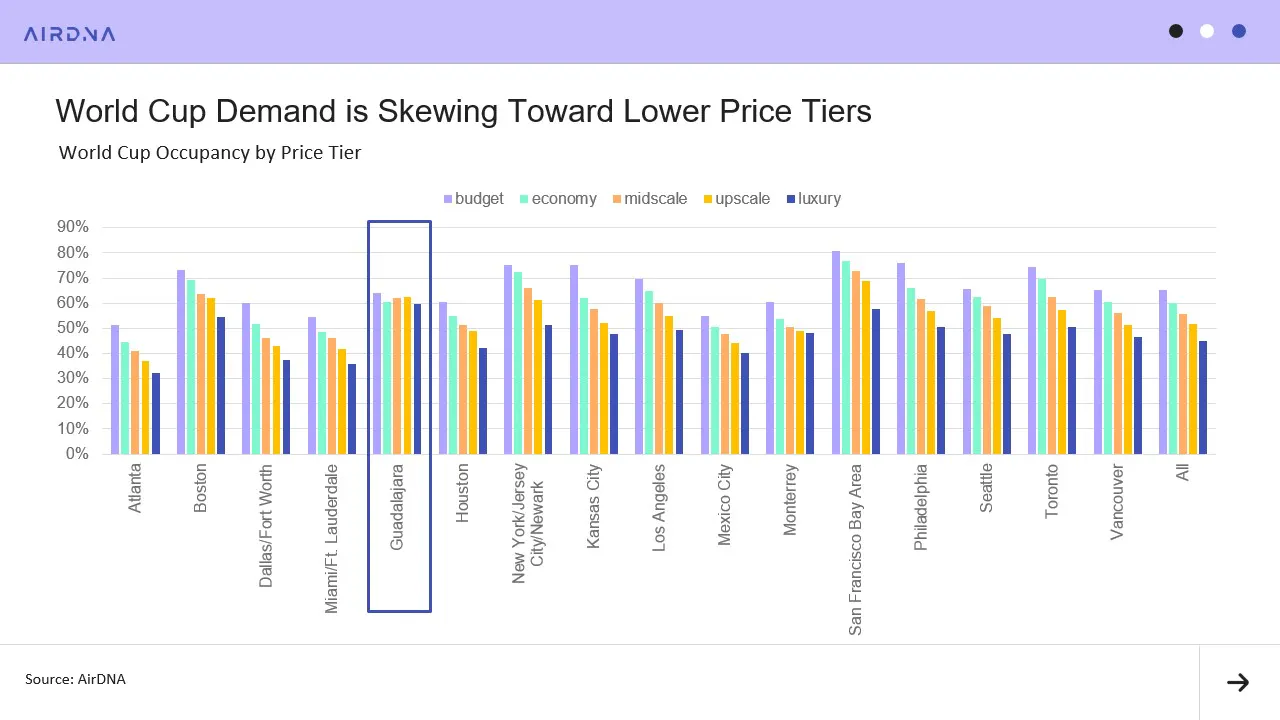
In most host cities, lower-priced listings are outperforming in occupancy, with economy and budget properties pulling ahead of upscale and luxury properties. The trade-down effect is most pronounced in Kansas City, Toronto, Philadelphia, and New York.
Guadalajara is the one exception. Higher-priced listings are seeing stronger occupancy than lower-priced ones, likely because Guadalajara has the lowest rates of any host city, leaving more headroom for travelers to splurge.
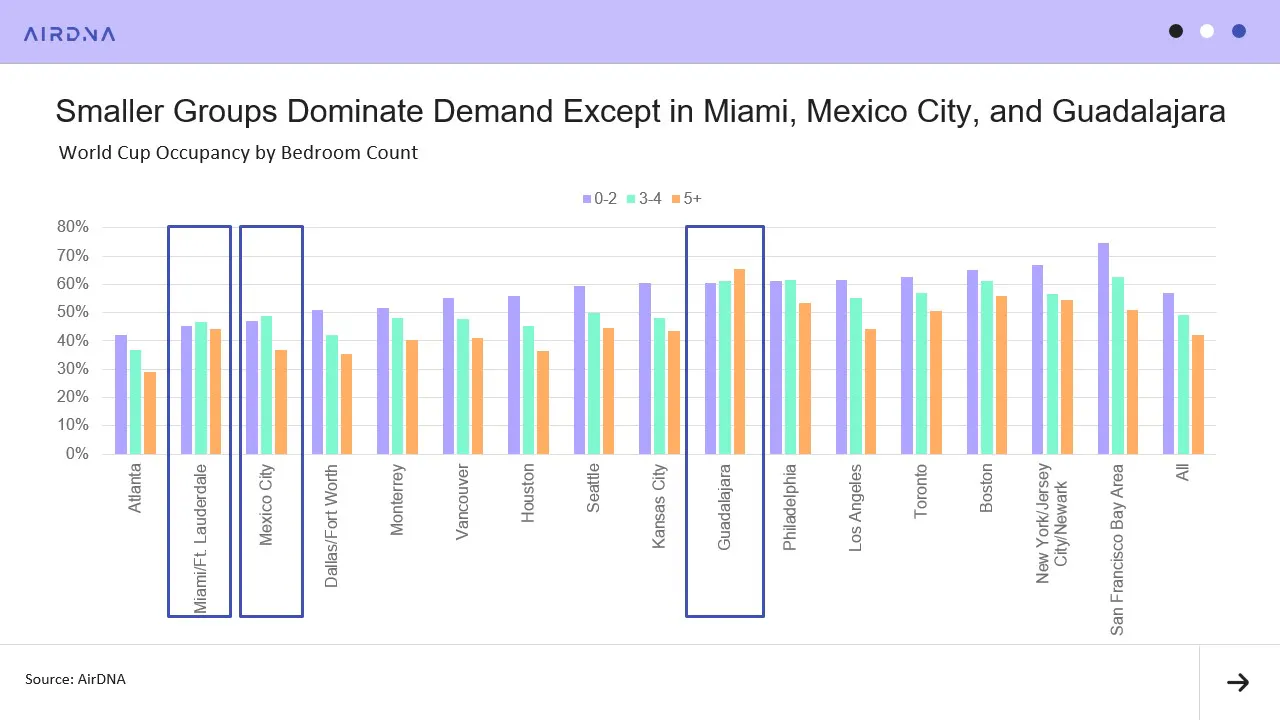
Smaller bedroom properties are also outperforming in most host cities, suggesting that World Cup travelers are predominantly traveling in smaller groups. Miami, Guadalajara, and Mexico City buck the trend. Occupancy in these markets skews toward larger-bedroom properties, suggesting a higher share of group travel in these cities.
Rate Premiums Will Hinge on How Supply and Demand Settle
Hosts across the board have moved aggressively on pricing. Asking rates for available dates are up more than 70% YoY in ten host cities. But only the supply-constrained markets are actually converting those higher prices into bookings.
In Kansas City, Guadalajara, Monterrey, Vancouver, and Mexico City, where rooms are scarce, booked rates are up more than 50% YoY. But in high supply markets like Miami, Houston, and Dallas, the picture is different. Hosts there have nearly doubled their asking rates year-over-year, but ample inventory is giving guests room to shop, and booked rates have moved modestly even as listed prices have soared.
Cities with tight supply and high occupancy are positioned to maintain or even build on their pricing momentum in the next few weeks. Markets with more supply availability, on the other hand, are facing downward adjustments.
Staying Ahead of Shifting World Cup Booking Dynamics
The World Cup is a highly dynamic event, and supply, demand, and rates will continue to shift in the weeks ahead.
A large share of demand has yet to be booked, additional short-term rental supply could still enter the market, and demand around qualifying round matchups won’t be finalized until the group stage wraps. Demand for those games will depend heavily on which teams advance.
To help hosts and market participants track these shifts in real time, AirDNA maintains a World Cup dashboard updated weekly with the latest demand, occupancy, and rate trends for every host city and match. For anyone weighing a hosting opportunity during the tournament, our World Cup revenue calculator estimates potential earnings for a specific property based on its location.
ARTICLE SUMMARY
STR booking data for the 2026 FIFA World Cup shows strong short-term rental demand across host cities, with growth shaped by match lineups, supply constraints, and pricing.
Linda Rollins
Senior Research Analyst
Linda Rollins is a Senior Research Analyst at AirDNA and a self-managing short-term rental host, which means she understands the market as both an analyst and an operator. She writes research and blogs for AirDNA and for Adapt, its revenue management tool, making her work a go-to resource for investors trying to find and size up the right opportunities, and for operators looking to understand changing market dynamics and find concrete ways to improve occupancy, rates, and guest experience. Her data is regularly cited in major news outlets, and she has a knack for bringing both the numbers and the story behind them. In her free time, Linda enjoys spending time with her family, traveling, and looking for good eats.