The Top 11 Metrics Every Short-Term Rental Owner Should Know
Published: February 8, 2025
Last updated: September 3, 2025

Jamie Lane
Key Takeaways
- The right metrics reveal where to improve profitability.
- Operational efficiency impacts your bottom line. Metrics like turnover times and utility expenses help you streamline processes.
- AirDNA provides accurate insights that help you optimize pricing, evaluate investments, and stay competitive.
As a host, you find yourself saying, "My occupancy looks good, but my profits don't match up." Another common refrain is: "I'm getting bookings, but I feel like I'm still not maximizing my revenue." Perhaps you take a look at other short-term rentals (STR) in your area and find yourself wondering, "Other properties in my area seem to be doing better—but I can't figure out why."
Sound familiar? As a short-term rental owner, you're juggling countless numbers—occupancy rates, daily rates, operating costs, and more. Which ones really matter, though? More importantly, how do you use them to make decisions that actually improve your bottom line? In this article, we'll cover all that and more. You'll walk away with a clear sense of which numbers are meaningful and why.
Why Vacation Rental Metrics Matter
In the short-term rental business, success comes down to using data to make smarter decisions. Real estate metrics are your property’s diagnostic tools, offering insight into its performance and profitability. Just as you wouldn’t expect a doctor to diagnose an issue without tests, you shouldn’t make pricing, marketing, or investment decisions without first understanding your key performance indicators (KPIs). They help you answer essential questions like:
- Which pricing decisions will actually boost your bottom line?
- Where are you spending money that isn't delivering results?
- What property improvements will give you the best return?
- How can you grow your business more strategically?
But here's the key: these metrics work together to give you a complete picture of your business health. Understanding what each number means and how they influence each other, helps you spot opportunities you might otherwise miss.
Let’s take a closer look at the real estate KPIs that can help you transform your short-term rental business.

Key Performance Metrics for Short-Term Rentals
1. Occupancy rate
Occupancy rate measures how often your property is booked, expressed as a percentage of available nights. It is a fundamental indicator of market demand and property performance. A high occupancy rate reflects effective pricing, marketing strategies, and strong guest appeal, while a low rate might signal misaligned pricing or off-peak challenges.
Here’s how occupancy rate is calculated
Occupancy Rate (%) = (Booked Nights ÷ Available Nights) × 100
Occupancy rate provides a snapshot of your property’s ability to attract bookings, helping identify areas for improvement. It also serves as a foundation for calculating other key metrics like revenue per available rental (RevPAR).
Factors influencing occupancy include seasonality, pricing strategies, and local competition. Properties leveraging dynamic pricing tools or adjusting rates to align with demand tend to maintain healthier occupancy rates.
Example: A host managing a beachfront rental in Florida noticed a sharp dip in occupancy during the fall shoulder season, with rates hovering around 55%. By introducing midweek discounts and promoting the property on local travel websites, the host boosted bookings to 80% occupancy within two months. This strategic shift also provided insights into market segmentation—weekday guests were often retirees or remote workers attracted by the discounts.
2. Average Daily Rate (ADR)
Average Daily Rate (ADR) calculates the average revenue earned per booked night, serving as a core metric for assessing a property’s profitability. It reflects how effectively a property generates revenue relative to demand.
Here’s how to calculate ADR
ADR = Total Booking Revenue ÷ Number of Booked Nights
ADR helps gauge the impact of pricing strategies and can highlight opportunities to increase per-night revenue. A higher ADR is often tied to premium amenities, unique guest experiences, or event-based pricing. Optimizing ADR can make even modest occupancy levels profitable.
Example: A mountain cabin in Colorado sought to increase its Average Daily Rate (ADR) from $200 to $250 during the lucrative winter season. To attract high-income travelers, the owner improved marketing efforts, highlighting premium amenities like the hot tub, ski-in access, and proximity to popular slopes. Then, they used dynamic pricing tools to adjust rates based on local demand and competitor pricing.
As a result, the cabin achieved an ADR of $245, representing a 22.5% increase over the previous year. This boost significantly enhanced overall revenue without relying on higher occupancy, allowing the owner to maintain profitability even during off-peak periods.
3. Revenue Per Available Rental (RevPAR)
Revenue Per Available Rental (RevPAR) combines occupancy rate and ADR, offering a comprehensive measure of a property’s revenue performance. It indicates how well a property monetizes its available nights.
Here’s how to calculate RevPAR
RevPAR = Occupancy Rate × ADR
or
RevPAR = Total Booking Revenue ÷ Available Nights
Unlike occupancy or ADR alone, RevPAR captures the interplay between these two metrics, providing a balanced view of overall performance. It is particularly useful for comparing properties of different sizes or price points within a portfolio.
Example: A property manager in Nashville used RevPAR to compare two rentals. Property A had an ADR of $150 and a 90% occupancy rate, resulting in a RevPAR of $135. Property B, with an ADR of $200 and a 60% occupancy rate, had a lower RevPAR of $120. Although Property B charged more per night, its lower occupancy rate reduced its overall revenue potential. Recognizing this, the property manager adjusted Property B’s pricing strategy to better match local market demand. By lowering the ADR to $175, they increased occupancy to 75%, raising RevPAR to $150 and surpassing Property A’s performance.
Financial Short-Term Rental Metrics
4. Net Operating Income (NOI)
Net Operating Income (NOI) is the total revenue generated by a property minus its operating expenses. Your total revenue includes nightly rates, cleaning fees, pet fees, and any additional services like concierge offerings. Operating expenses typically cover costs like cleaning, maintenance, utilities, property management fees, supplies, and marketing.
Here’s how to calculate NOI
NOI = Gross Operating Revenue – Operating Expenses
NOI is a critical measure of a property’s financial performance because it directly reflects how much income is left after covering all operating expenses. It’s the foundation for understanding a property’s profitability and can reveal where costs are eating into profits or where there’s room to increase revenue.
Example: A vacation rental in Austin generated $120,000 in annual revenue, with $40,000 in operating expenses, resulting in an NOI of $80,000. After reviewing costs, the owner discovered cleaning fees accounted for $15,000 annually due to a fixed rate per turnover. By renegotiating contracts with cleaning services and offering mid-stay cleaning as an add-on for guests, the owner reduced cleaning expenses by 10%, saving $1,500. This adjustment brought total operating expenses down to $38,500, boosting NOI to $81,500.

5. Cash-on-cash return
Cash-on-cash Return measures the return on an investor’s initial cash investment, offering a straightforward way to evaluate a short-term rental’s profitability. It calculates how much cash you’re earning relative to what you’ve invested upfront.
Here’s how to calculate cash-on-cash return
Cash-on-cash return (%) = (Cash Flow After Expenses and Mortgage ÷ Initial Cash Investment) × 100
Example: An investor purchased a short-term rental for $400,000, making a $100,000 cash investment for the down payment and closing costs. Over the first year, the property earned $60,000 in gross rental revenue, with $25,000 in operating expenses and $20,000 in mortgage payments, leaving $15,000 in cash flow.
Cash-on-cash return = ($15,000 ÷ $100,000) × 100 = 15%
This 15% cash-on-cash return was strong, but the investor wanted to evaluate whether it could be improved. They analyzed expenses and identified opportunities to reduce cleaning costs by negotiating service contracts, saving $2,000 annually. Additionally, they implemented dynamic pricing during high-demand periods to boost revenue. These changes were projected to increase cash flow by $5,000, improving the CoC to 20% in the following year.
6. Debt Service Coverage Ratio (DSCR)
Debt Service Coverage Ratio (DSCR) evaluates a property’s ability to cover its debt payments with its net operating income. Lenders often rely on this metric to determine whether a property is a safe investment for loans.
Here’s how to calculate DSCR
DSCR = Net Operating Income (NOI) ÷ Annual Debt Service
A DSCR of 1.25 means the property generates 25% more income than needed to cover its debt payments. This is considered an ideal minimum for short-term rental investments, as it provides a comfortable buffer to handle unexpected costs, market fluctuations, or dips in occupancy.
For investors seeking financing, lenders typically look for a DSCR of at least 1.2 to 1.5 for short-term rentals. A DSCR closer to 2.0 signals even stronger financial stability, which may allow for better loan terms. Conversely, a DSCR below 1.0 indicates that the property’s income doesn’t fully cover its debt obligations, raising concerns for both the investor and lenders.
Example: A vacation rental generates a Net Operating Income (NOI) of $50,000 annually, with annual debt payments of $40,000, resulting in a Debt Service Coverage Ratio (DSCR) of:
DSCR = $50,000 ÷ $40,000 = 1.25
The investor sees that the DSCR of 1.25 meets lender requirements for financing but leaves only a modest margin for unexpected costs or dips in revenue. To improve profitability and create a stronger buffer, they decide to explore revenue-boosting strategies, such as increasing nightly rates during peak seasons or offering premium services like pet-friendly stays. Additionally, the investor considers refinancing the property at a lower interest rate to reduce debt payments and further improve cash flow.

Operational Short-Term Rental Metrics
Running a successful short-term rental isn’t just about making money—it’s about running your property efficiently.
By tracking metrics like booking trends, turnover times, and expenses, you can find ways to streamline operations, cut costs, and improve the guest experience. With the right data, it’s easier to keep things running smoothly and boost your bottom line.
7. Booking lead time
Booking lead time refers to how far in advance guests typically book a property. Tracking this metric reveals guest behavior patterns, allowing hosts to plan pricing, marketing campaigns, and operational schedules effectively.
Understanding booking lead times helps you balance revenue and occupancy by targeting guests at different stages of the booking cycle. Properties with shorter lead times might prioritize last-minute discounts, while longer lead times allow for advanced planning and premium pricing.
Example: A lakefront property in Michigan analyzed its booking data and found that 70% of guests booked 30–45 days in advance, with a secondary spike in bookings less than seven days out. By targeting early bookers with promotional email campaigns six weeks prior, the owner secured more revenue at premium rates. Simultaneously, they implemented last-minute dynamic pricing for the remaining dates, capturing spontaneous travelers. As a result, they increased revenue by 15% while maintaining an 85% occupancy rate during peak season.
8. Turnover and maintenance metrics
Turnover metrics measure the time and resources needed between guest stays, including:
- Time to clean and prepare units
- Time windows between bookings
- Frequency of maintenance tasks
- Emergency repair rates
Tracking these helps optimize scheduling, control costs, and maintain quality. For example, analyzing turnover data might reveal that booking buffer times under 4 hours lead to rushed cleaning and poor reviews, while understanding maintenance patterns helps prevent emergency repairs that cost 2-3x more than scheduled upkeep.
Watch the relationship between your turnover metrics and guest satisfaction scores—they often reveal operational issues before they become costly problems.
Example: A city-center apartment rental experienced high guest turnover, with average stays of three nights and tight back-to-back bookings. Cleaning teams often struggled to meet deadlines, leading to delayed check-ins and negative reviews. By implementing standardized cleaning checklists and hiring an additional part-time cleaner for peak seasons, the owner reduced average turnover times by 30 minutes and improved property readiness. Additionally, scheduling routine maintenance during mid-week gaps reduced emergency repair costs by 20%, saving $1,000 annually and improving guest satisfaction scores.
9. Utility and operating expenses
Utility and operating expenses include recurring costs like electricity, water, internet, supplies, and staff wages. Monitoring these costs ensures positive cash flow and identifies areas for savings.
Rising operating expenses can erode profitability. Tracking these costs enables better budgeting and highlights inefficiencies. It also allows for strategic upgrades, such as energy-efficient appliances, that provide long-term savings.
Example: A desert vacation rental in Arizona faced significant energy costs due to summer AC usage. By installing smart thermostats, sealing windows, and switching to solar-powered outdoor lighting, the owner reduced electricity bills by 20%, saving $2,400 annually. The savings allowed the owner to reinvest in guest amenities, such as high-speed internet, which helped attract remote workers and increased off-season occupancy by 10%.
Short-Term Rental Metrics for Real Estate Investments
Key real estate investment return metrics give you the tools to evaluate a property’s potential short term rental performance, uncover opportunities for improvement, and make smarter decisions.
10. Yield
Yield is one of the most important real estate investment metrics because it gives investors a clear view of a property’s annual return relative to its value.
Yield measures the annual income generated by a property as a percentage of its purchase price or current market value (here’s more information on how to value a vacation rental property).
Here’s how to calculate yield
Yield (%) = (Annual Rental Income ÷ Property Value) × 100
Your annual rental income includes nightly rates, cleaning fees, pet fees, and any additional services offered to guests. The property value can be the purchase price or the current market value, depending on your use case.
Yield is an essential metric for short-term rental investors because it provides a straightforward way to evaluate profitability. It allows you to determine how well a property generates returns relative to its value, compare potential investments across different markets, and measure performance over time. Yield also helps identify areas for improvement—whether that’s boosting income through premium services or addressing costs to enhance profitability.
Example:
An investor is comparing two properties for a short-term rental investment.
- Property A is a downtown apartment purchased for $400,000 and generates $36,000 in annual income from nightly rates and cleaning fees.
- Property B is a beachfront condo valued at $600,000, with annual income of $48,000.
Property A Yield = ($36,000 ÷ $400,000) × 100 = 9%
Property B Yield = ($48,000 ÷ $600,000) × 100 = 8%
At first glance, Property A appears to offer a higher return, but the investor digs deeper into the data. The downtown market shows steady demand year-round, whereas the beachfront condo’s income fluctuates heavily with the seasons.
Using yield as a starting point, the investor decides to pursue Property B but implements strategies to address seasonal gaps, such as offering discounts during off-peak months and targeting remote workers for extended stays. This increases annual income for Property B to $54,000, raising its yield to 9% and aligning it more closely with their investment goals.
11. Cap rate (Capitalization rate)
The cap rate measures the return on a real estate investment based on the property’s net operating income (NOI) and its purchase price. It’s calculated as a percentage, offering a snapshot of a property’s profitability.
Here’s how to calculate cap rate
Cap Rate (%) = (Net Operating Income / Purchase Price or Market Value) * 100
The cap rate helps investors evaluate the risk and return of a property. Higher cap rates generally indicate higher returns but may involve greater risk (e.g., properties in less desirable areas). Lower cap rates suggest stable but lower returns, often in established, high-demand markets. Traditionally, a cap rate between 4% to 10% is considered good for rental properties, but this varies widely depending on the location and type of property.
Example: An investor assessed two properties:
- A cabin in a remote mountain town with an NOI of $30,000 and a purchase price of $300,000, yielding a 10% cap rate.
- A beach house in a prime tourist destination with an NOI of $40,000 and a purchase price of $600,000, yielding a 6.7% cap rate.
While the cabin offered a higher return, the investor prioritized the beach house due to its location, consistent demand, and lower risk of vacancy. The decision balanced profitability with long-term stability.

Tools for Tracking Short-Term Rental Metrics
From tracking revenue to managing expenses and planning for growth, these tools help you stay on top of your property’s performance and make choices that boost your success.
Analytics platforms for Airbnb Data
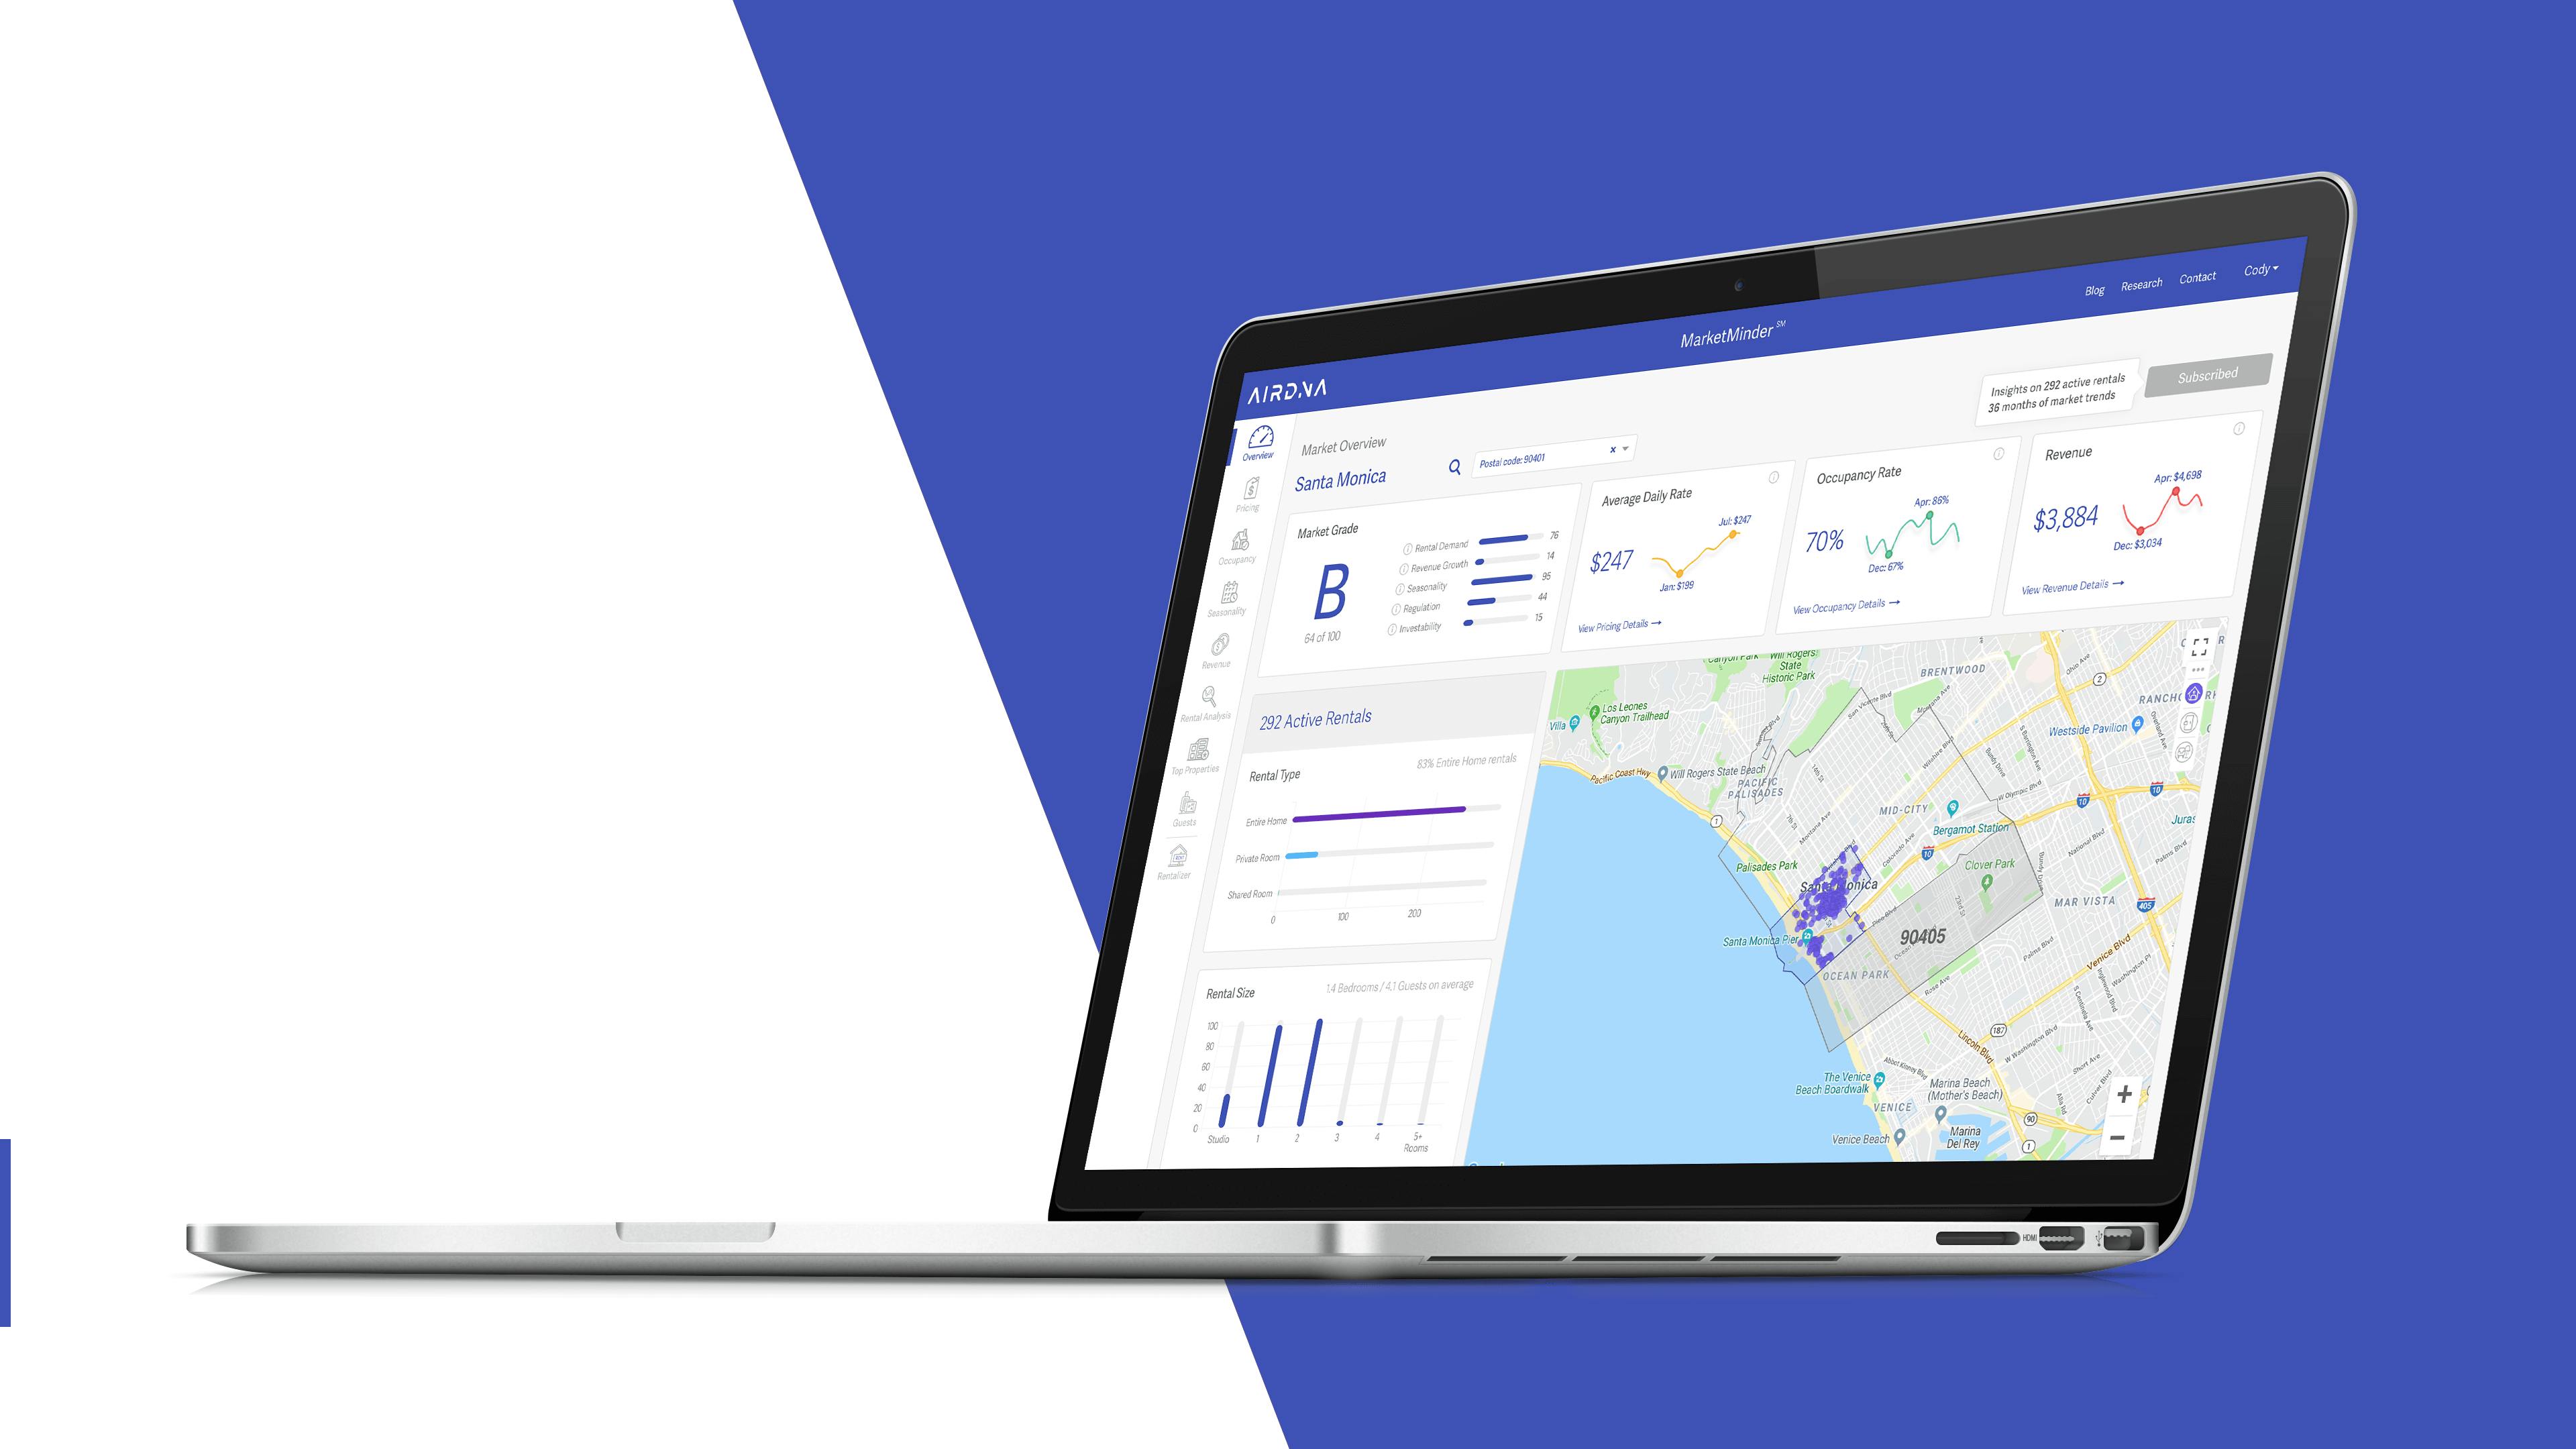
Airbnb analytics platforms like AirDNA make tracking short-term rental metrics simple and effective. With data from over 10 million properties across 120,000 markets, AirDNA provides accurate, up-to-date insights into metrics like occupancy rate, average daily rate (ADR), and revenue per available rental (RevPAR). You can even connect your Airbnb account to sync property data, ensuring your metrics stay current without manual input.
What AirDNA can do:
- Visualizes key metrics with interactive dashboards for performance tracking and market trends.
- Benchmarks properties against competitors, helping refine pricing and strategy.
- Automatically calculates metrics like RevPAR, ADR, and occupancy rate for quick decision-making.
- Assesses investment property potential with tools like our Airbnb Calculator and Rentalizer that help you evaluate properties and forecast revenue.
With its intuitive interface and reliable data, AirDNA helps you make confident decisions about pricing, performance, and expansion.

Property Management Systems (PMS)
Property Management Systems, like Uplisting, simplify short-term rental operations while tracking key metrics that impact efficiency and costs. These tools automate guest communication, turnover management, and expense tracking, giving you a clearer picture of your property’s operational performance.
What PMS tools can do:
- Monitor cleaning schedules and turnover times to improve efficiency and reduce delays.
- Track recurring costs like cleaning and maintenance to identify savings opportunities.
- Automate and log messages to streamline response times and improve guest satisfaction.
- Generate reports on expenses and task completion to understand how efficiency affects profitability.
By reducing manual errors and providing real-time operational data, PMS tools make managing single or multiple properties more efficient and profitable.
Revenue management and financial planning tools
Revenue management and financial planning tools provide the insights needed to maximize income while maintaining control over expenses.
These tools help track critical metrics like net operating income (NOI), cash flow, and debt service coverage ratio (DSCR), making them essential for smart revenue management and long-term profitability.
What these tools can do:
- Monitor income and operating expenses in real time to maintain profitability.
- Analyze pricing strategies to optimize ADR and maximize revenue potential.
- Track debt obligations and calculate DSCR to ensure financial stability.
- Forecast seasonal revenue fluctuations and prepare for unexpected costs.
These tools go beyond simple financial tracking, giving you the ability to analyze trends, adjust strategies, and focus on growth. Whether you’re managing a single rental or a large portfolio, integrating revenue management tools ensures your financial health remains strong and your properties continue to deliver returns.

FAQ
What’s the most important metric for Airbnb?
There isn’t a single “most important” metric, as it depends on your goals. For many hosts, occupancy rate is critical—it shows how often your property is booked and helps you evaluate your pricing and marketing strategies. However, average daily rate (ADR) and revenue per available rental (RevPAR) are equally important for understanding how much you’re earning and identifying areas for improvement. A combination of these metrics gives you a full picture of your property’s performance and profitability.
How does tracking vacation rental KPIs help your business?
Strong short-term rental hosts don't rely on hunches or experiments—they use metrics to guide their decisions. That’s because your property's numbers tell two critical stories: where you might be losing money and where you could be making more.
What is a good ROI for short-term rentals?
Most successful short-term rental properties aim for a cash-on-cash return between 8-12% annually, though this varies significantly by market. Cash-on-cash return—which measures your annual cash flow against your initial investment (covered in detail earlier in this article)—gives you a clear picture of your property's actual performance. Urban markets might see lower cash returns but stronger appreciation potential, while vacation markets often show higher seasonal returns but more variation throughout the year. The key is understanding your specific market's dynamics and setting realistic expectations for your short-term rental investment.
Can you still make money with Airbnb in 2025?
Absolutely—but success today requires a more strategic approach than in years past. The most profitable hosts use market data and analytics platforms like AirDNA to inform their decisions rather than relying on trial and error. Understanding your market's metrics and keeping a close eye on your property's performance numbers helps you identify opportunities even in competitive markets. The key is using reliable data to make smart decisions about pricing, operations, and guest experience.
ARTICLE SUMMARY
Discover the top 11 short-term rental metrics every host needs to track. Learn how to boost profits, optimize operations, and make smarter investment decisions with actionable insights.
Jamie Lane
AirDNA Chief Economist
He is responsible for data analysis, thought leadership, and leveraging advanced analytical techniques to provide new insights into short-term rental market trends. Native to Atlanta and an Airbnb host himself, Jamie enjoys cycling, mountain biking, backpacking, running, and playing in a dart league in his free time.