

 Calculate Revenue
 Research Markets
 Find For Sale Properties
 Compare My Listing
 STR Revenue Calculator
 Custom Comp Sets
 Submarket Insights
 Custom Search Filters
 Rate Recommendations
 Performance Benchmarking
 Competitor Comparison
 Owner Contact Details
 Property-level performance data
 Tourism Insights
 Real Estate Investment Analytics
 About Us
 Sales
Sales Support
 Press
PressEurope Market Review: Hot Summer Bumps Up Occupancy as International Travel is Back
Published: August 18, 2022
Last updated: October 24, 2024

Scott Sage
European travellers have been making up for lost time after two summers of travel restrictions. Heatwaves and inflation haven’t been able to put off European travellers this summer as guests return to short-term rentals (STRs) in their droves. A period of positive demand momentum over 2019 continued in Europe in July with 48.9 million nights stayed, 7.9% more than in the same period in 2019 (+33.5% vs. 2021). Consumer confidence has improved dramatically over the last 12 months, yielding lead times that were 19% longer for stays in the month of July relative to last year: simply put, guests are booking further in advance to secure the best properties.
At a Glance: July STR Performance
- Demand up 33.5% YOY, +7.9% vs. 2019
- ADRs up 2.7% YOY, slowing their growth
- Available listings up 19.2% from 2021 but still -4% from 2019
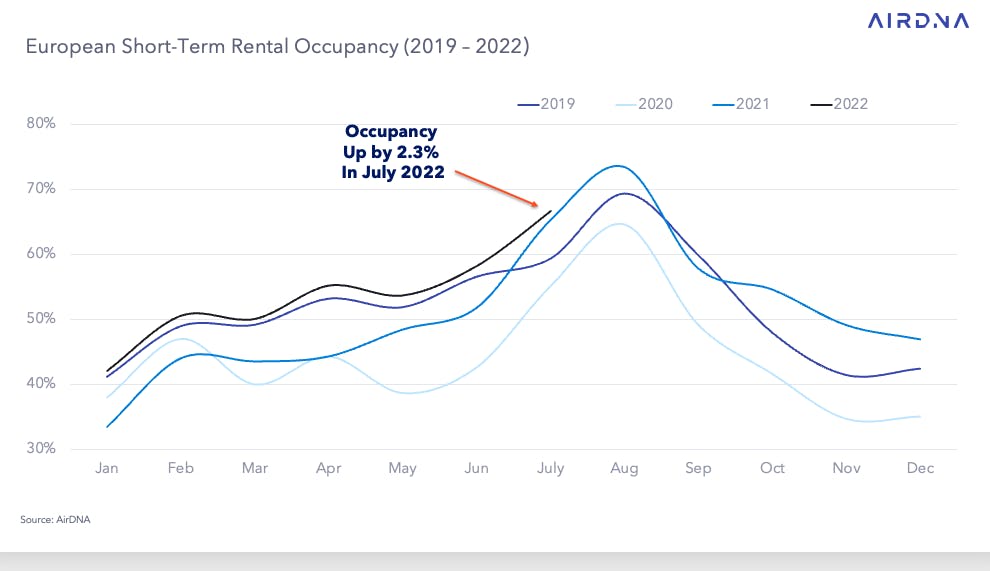
- Occupancy hit 66.6%, up 2.3% YOY and 12.4% from 2019
- Revenue was up 27.1% from 2019, 37.2% vs. 2021, thanks to higher rates and demand
Demand growth has continued to outpace supply growth in Europe, pushing occupancy rates higher. There were 19.2% more available listings year over year, while booming demand has brought occupancy above record levels for the last 10 months. In July, the continent saw occupancy grow 2.3% over 2021 and 12.4% over 2019. However, supply in the region remained 4% below 2019 levels in July.
In Q2 2022, Hungary, Greece, and Croatia respectively saw 342.1%, 116.5%, and 80.4% more Airbnb reservations made by international travellers year over year, while reservations made by domestic travellers in the same comparison period had declined in each of these countries.
The strength of demand and inflated occupancy levels allowed European hosts to charge an average daily rate (ADR) 2.7% higher than in July of last year. The growth rate is beginning to slow as the mix of properties booked moves back toward pre-pandemic patterns. That is, smaller city-centre apartments rather than large villas, which on average charge less.
In July, the euro had fallen by roughly 15% to the US dollar since the start of 2022, and services inflation had increased by 3.7% year over year. But these factors aren’t having a very dramatic effect on ADRs. Rather, price appreciation is being driven by the surge in occupancy levels as a function of an imbalance between demand and supply.
Dig deeper into rates in your market
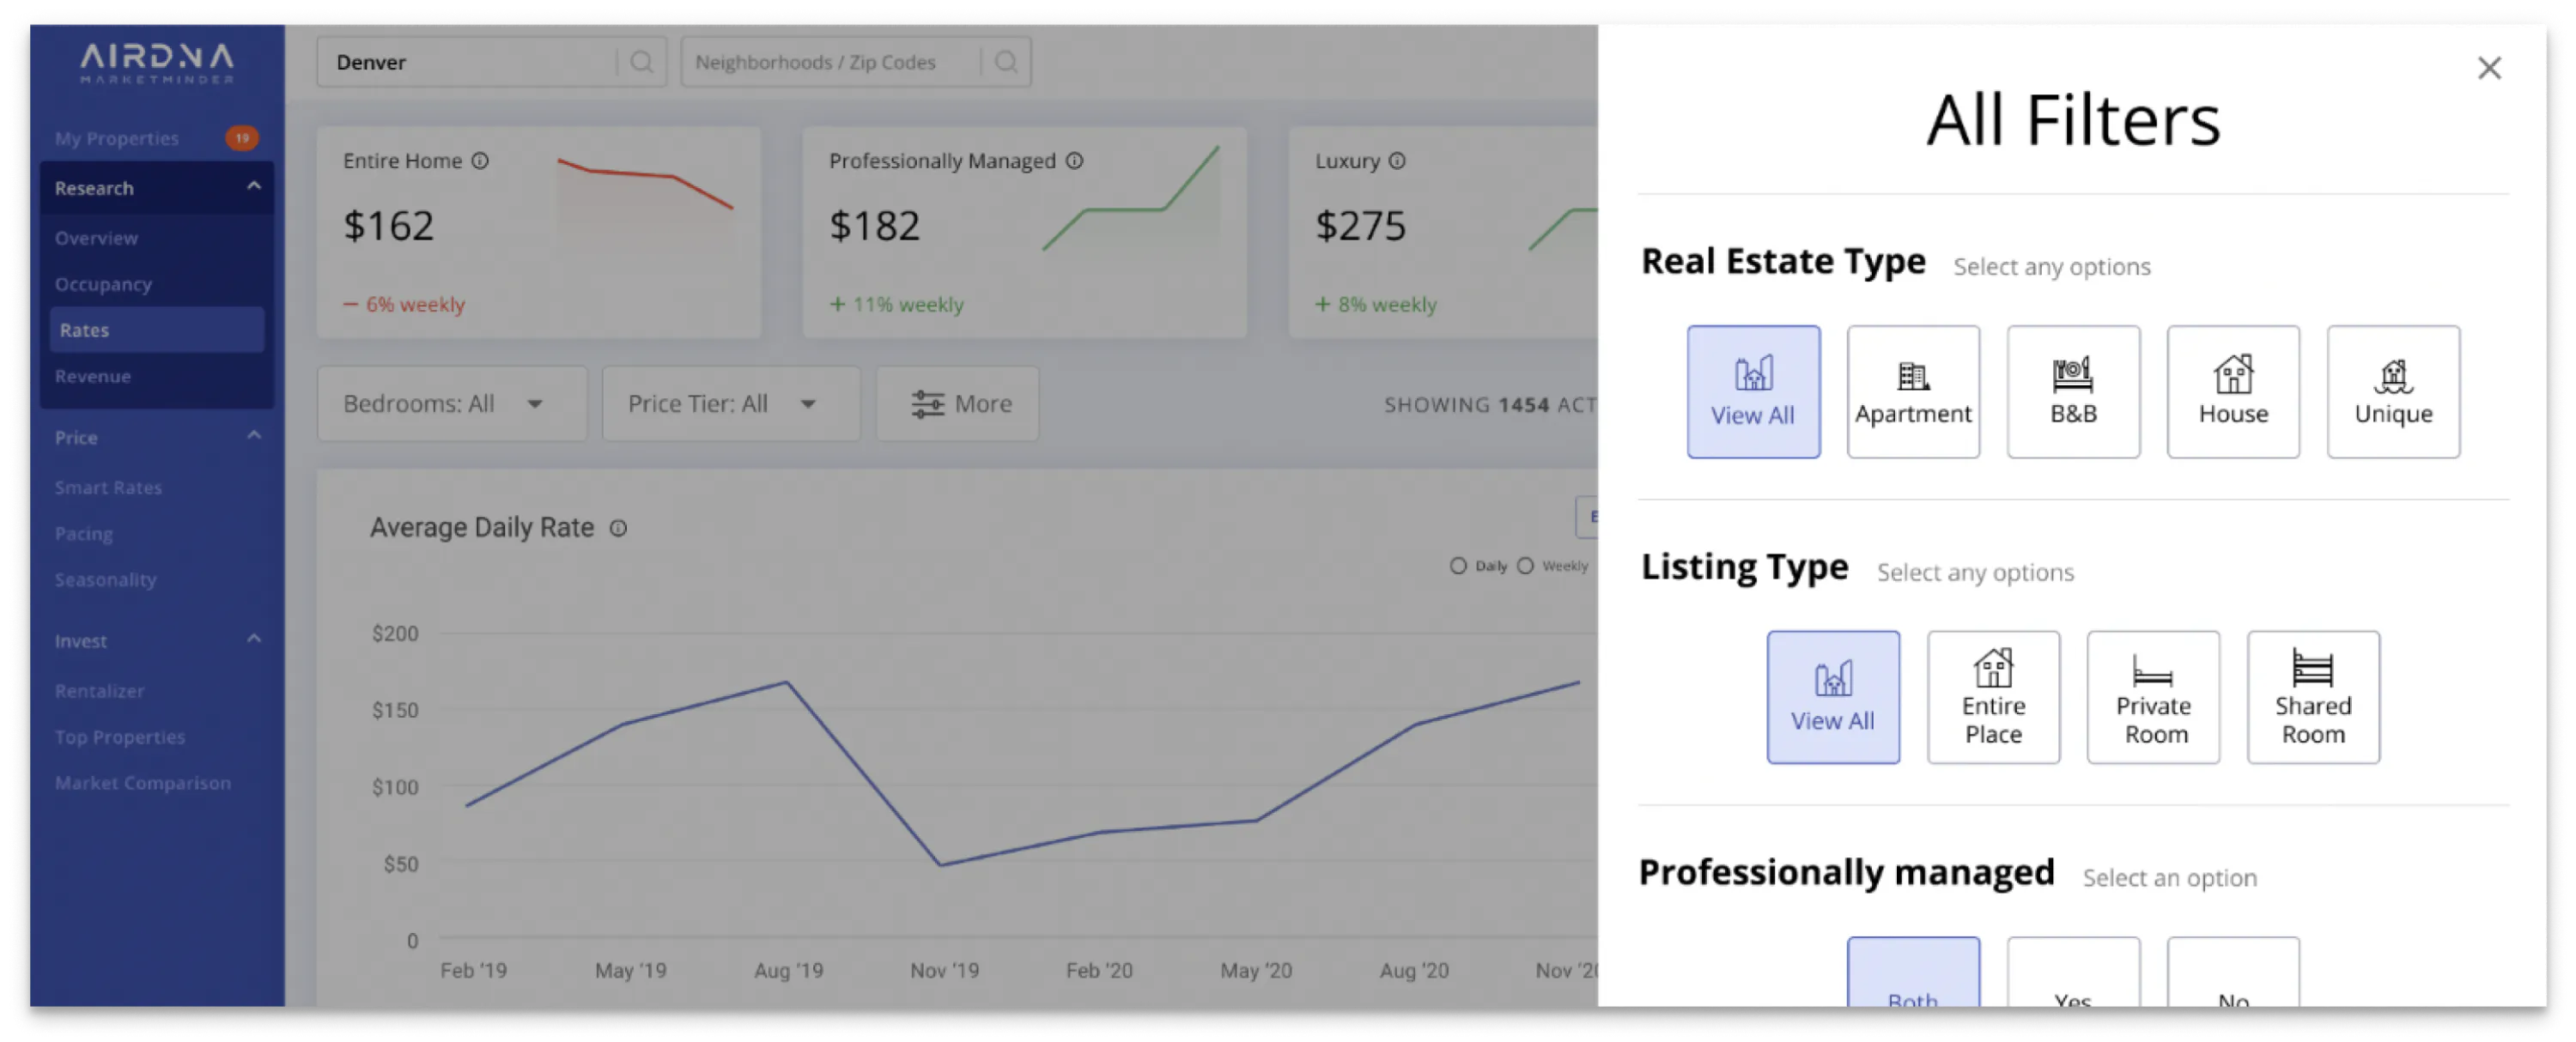
Our new and upgraded Rates page in MarketMinder offers smarter filters for more accurate insights and five years of historical data to help you drill down into the essence of listings and reach professional revenue management at the click of a button.
Occupancy Pressures in Top-50 Markets Cool with Added Supply
After two years of guests staying away from the madding crowd and big cities, the supply levels in the top 50 largest short-term rental markets in Europe (of the over eight million tracked by AirDNA) remained 29.5% below 2019 in July. These top-50 markets made up 12.9% of the total supply in the continent. However, supply is beginning to return to urban areas in an effort to meet the strength of demand returning to popular tourist cities.
On a year-over-year basis, nights stayed in the top 50 European cities were up 61.2% on average in July. Although impressive, this change in demand was overshadowed by the preceding five months; when year-over-year demand gains were greater than 100%. Despite high demand, supply in Europe’s most popular short-term rental destinations has, until recently, been slow to respond. However, monthly available listings in the top-50 markets flipped positive in May (+2.4% year over year) and continued an upward trajectory in June (+10.2%) and July (+16.5%).
With supply of available listings continuing to lag demand, occupancy levels across the top-50 markets in July were on average 17.2% higher than in the same period last year. In total, 45 of the top-50 European markets saw higher occupancy levels than last July. Of course, last year many of these locations remained subject to pandemic-related restrictions and saw very few international travellers, a segment which has made a comeback in recent months.
45 of the top-50 European markets saw higher occupancy levels than last July.
The highest growth in occupancy was in Lisbon, Portugal (+51.7%), Budapest, Hungary (+45.3%), and Porto, Portugal (+43.5%); while occupancies dropped in Budva, Montenegro (-7.2%), Montpellier (-7.1%), and Marseille (-5.5%), both in France, due to the influx of new properties for the summer in these coastal cities.
International Demand Helps Drive Occupancy in Top-50 Markets
A resurgence in international travel is likely driving higher occupancy in the continent’s most popular short-term rental destinations.
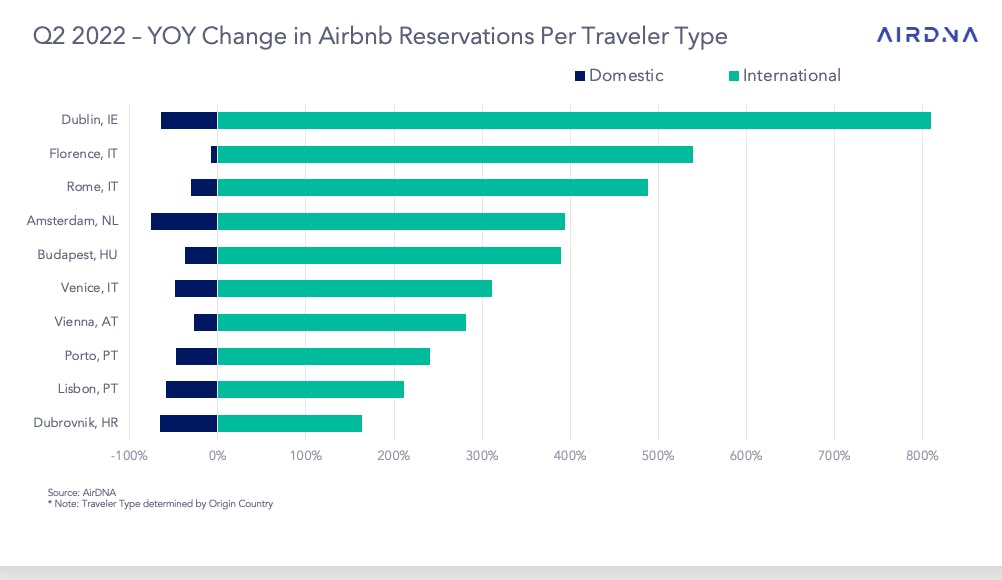
In Q2 2022, Hungary, Greece, and Croatia respectively saw 342.1%, 116.5%, and 80.4% more Airbnb reservations made by international travellers year over year, while reservations made by domestic travellers in the same comparison period had declined in each of these countries.
Using Airbnb review data, we can see that the markets with the greatest change in occupancy over last year (top 10 markets listed in the chart below) are seeing a major recovery in international visitation. A similar trend is being observed throughout Europe’s most popular short-term rental markets. With the easing of pandemic restrictions, travellers are rushing out of their home countries to Europe’s most popular destinations.
For example, in Q2, Dublin, Ireland, saw a year-over-year change in occupancy of +46.8%. In the same comparison period, Airbnb reservations in Dublin made by international travellers had increased by over 800%, while domestic reservations had declined by over 60%. Granted, total demand in Dublin remained 62.7% below 2019 in July 2022. Italian cities Florence and Rome also saw huge increases in international guests, while domestic travellers chose to go elsewhere this year, as we discussed in our last monthly review.
Edinburgh Fringe Festival Makes Strong Comeback in 2022
Held each August in Edinburgh, UK, the Fringe Festival is the world’s leading celebration of arts and culture and ranks with the Olympics and the World Cup in terms of global ticket sales. Overall demand for the event was pacing 61.3% higher as of 8th August year over year, however, some areas within Edinburgh were pacing stronger than others.
As of early August, demand for Craigmillar (including Liberton, Alnwickhill, and Little France) was 162.3% higher than at this time last year, while ADR for the area was posting a slight decline, down 2.9% from the highs in 2021. Wester Hailes/Balerno, as well as West Lothian, were also seeing strong year-over-year demand gains with 111.3% and 96.0%, respectively, as guests and performers look for better deals further from the city centre.
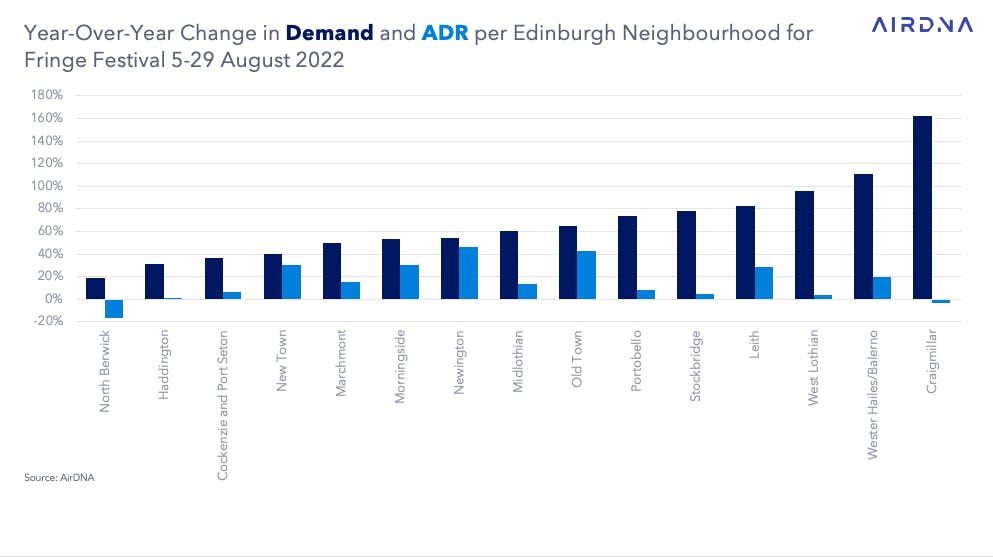
As in previous years, rates are surging in August due to the high demand. As of 8th August, average daily rates were closing in on 46.4% higher than last year in Newington, followed by Old Town (42.5%), New Town (30.0%), and Morningside (30.0%). Despite 18.6% higher demand year over year, the coastal town of North Berwick was seeing the weakest change in nights booked and ADR—16.2% lower than last year.
Is 2022 a good time to invest in a short-term rental?
Well, yes and no... find out more in our latest blog post
European Outlook
The big question now is, will demand remain strong after the summer? Or will inflation pressures finally catch up with STR demand?
As of 7th August, European nights booked were pacing 35.9% over 2021 and 2.2% over 2019 on average to close out 2022. While August was just -0.3% behind August 2019, September was pacing toward strong demand growth over 2019, with 10.1% more nights booked in the comparison period, as guests use new flexibility to travel outside of high season and avoid the crowds.
Of the top-20 countries, Germany was pacing toward the most nights booked in August with 24.8% more nights booked vs. 2019, followed by Belgium (19.3%), Greece (18.7%), and Austria (17%). On the other hand, a trend of lower demand continues in the Czech Republic, Hungary, and Ireland, which were pacing -33.4%, -29.4%, and -24.9% below 2019, respectively.

Regulations and your STR business
Understand how legislation and restrictions can benefit and hinder your STR business and community
Supercharge your market knowledge
MarketMinder's new, updated rates page makes it easier for you to drill down into the essence of listings and reach professional revenue management at the click of a button.
Europe Review: June 2022
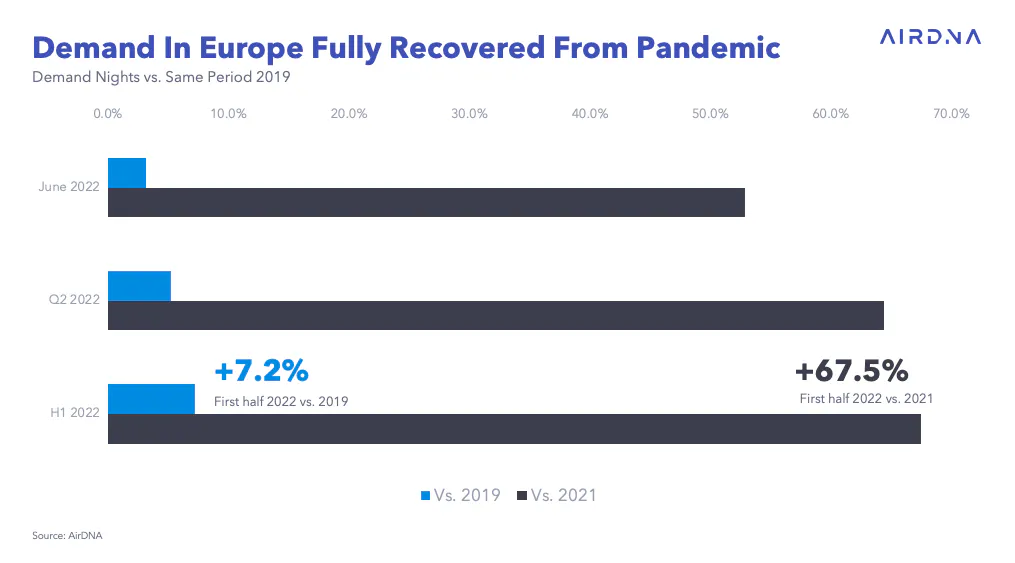
In the first half of 2022, 7.2% more nights were stayed in a European holiday rental than in the same period in 2019.
ARTICLE SUMMARY
Heatwaves and inflation haven’t been able to put off travellers around Europe this summer as guests return to short-term rentals in their droves. In July, Europe reached 48.9 million nights stayed, 7.9% higher than July 2019, with record occupancy but still reduced supply.
Scott Sage
Senior Vice President, Marketing & Customer Experience
Scott is an Airbnb Superhost and industry pro, having founded Home Base BnBs—a short term rental management company that scaled to 200+ units. Scott combines his experience and passion for hosting to empower AirDNA customers' success. When he's not thinking about STRs, he is hiking, playing basketball, or playing pickleball.
