Why Dynamic Pricing Matters Most During Events
Published: September 15, 2026
Last updated: October 22, 2026

Camilo Schmid Rivas
Every event rewards the same basic logic, but never in the same way. Opportunities vary with duration, booking lead times, and guest behavior, so each one calls for a tailored response. The consistent factor is that success comes not from knowing the date, which everyone knows, but from adapting as real demand materializes.
Louisville shows this clearly. Within the market, the share of inventory requiring a 3-night minimum stay surges from roughly 8% to nearly 20% specifically for Derby weekend, then retracts to its baseline level just one week later. During that annual peak, the revenue potential of an extended minimum stay outweighs the risk of turned-away bookings, and the operators who spot that value are frequently the same ones actively managing their rates. Derby listings that adjusted both pricing and stay requirements secured the highest RevPAR across the entire market.
This analysis explores two contrasting case studies: the Kentucky Derby, where demand concentrates on a single weekend, and the Masters, where revenue is largely locked in months before the first tee-off and spread across a full week.
Key Takeaways
- Getting the rate right is the biggest single driver of event performance, and hosts who paired it with a minimum stay adjustment earned the highest RevPAR of any group.
- The two events reward opposite tempos: the Derby compresses every decision into a handful of nights, while the Masters settles most of its money months before anyone arrives.
- Dynamic pricing matters most when the date is certain but the demand is not. Hosts whose prices kept moving ran fuller and charged more than those who set a rate early.
- Over Derby weekend, Louisville listings that moved both rates and minimum stay reached $398 RevPAR, nearly $130 more than listings that changed neither.
- Through Masters week in Augusta, actively priced listings ran 88.8% occupancy at $313 a night against 84.2% at $211 for everyone else.
Events Offer Hosts the Biggest Upside and the Biggest Risk
With continuous supply growth and the ongoing professionalization of short-term rentals (STRs), STRs have become a mainstream accommodation option for travelers around the world. That is particularly true during events, when STRs either absorb inelastic hotel supply in smaller markets or offer a more tailored experience to travelers choosing an STR over a hotel.
As STRs have normalized, competition has intensified. Hosts and operators now need dynamic pricing software that is not only built for short-term rentals but consistently able to maximize performance on event dates, when the opportunity is largest and so is the risk of getting the strategy wrong. Event weekends are where revenue management stops being theoretical.
In this analysis we look at the Kentucky Derby, a fast-paced event where demand booms and prices skyrocket across an intense weekend, and the Masters at Augusta, where limited supply is stretched across a weeklong tournament. The analysis highlights the importance of adapting not only prices but also minimum stay requirements, and the difference between hosts who use every tool at their disposal and more passive ones.
Methodology
We categorize listings by their actual actions during the event, such as raising minimum stays or repricing, and compare each group against its own performance in a baseline period. Since the same properties appear in both periods and each group is measured against its own baseline, consistent differences in location, condition, and management tend to cancel out, isolating the change related to the event.
Only listings that are genuine short-term rentals are included; properties designated as monthly rentals, which naturally carry long minimum stays, are excluded to prevent skewing the measurement buckets. A listing must be available in both periods to be counted. Baselines are taken from the same year as the event and matched by day of the week, since year-over-year comparisons could reflect market growth, new supply, or inflation rather than host behavior. Each baseline is checked against the local calendar and set aside where it overlaps the event’s surrounding festival, movable holidays like Easter, or fixed holiday weekends.
We concentrate on the two factors hosts can control in advance: the rate and the minimum stay. Cohorts are built from listings whose prices have historically moved most, which we take as a sign of dynamic pricing, and from listings that adapted their minimum stay in response to the event.
Kentucky Derby: Rate and Minimum Stay Together Beat Either Alone
It’s billed as the most exciting two minutes in sports. But for short-term rental hosts in Louisville, the 152nd Kentucky Derby is the anchor of a multi-day surge, and it leaves hosts with a series of difficult decisions across a fast-paced weekend. A sudden renovation or an extra bedroom is not feasible on that timeline, so the two levers that matter are the rate a host charges and the minimum stay they set.
At AirDNA we can segment hosts by the variation in the prices they have historically set, into high, medium, and low price variability. Hosts with high price variability are also very likely to be using some form of dynamic pricing tool that adapts rates continually. But as the following example shows, simply changing the rate is not the best way to maximize performance.
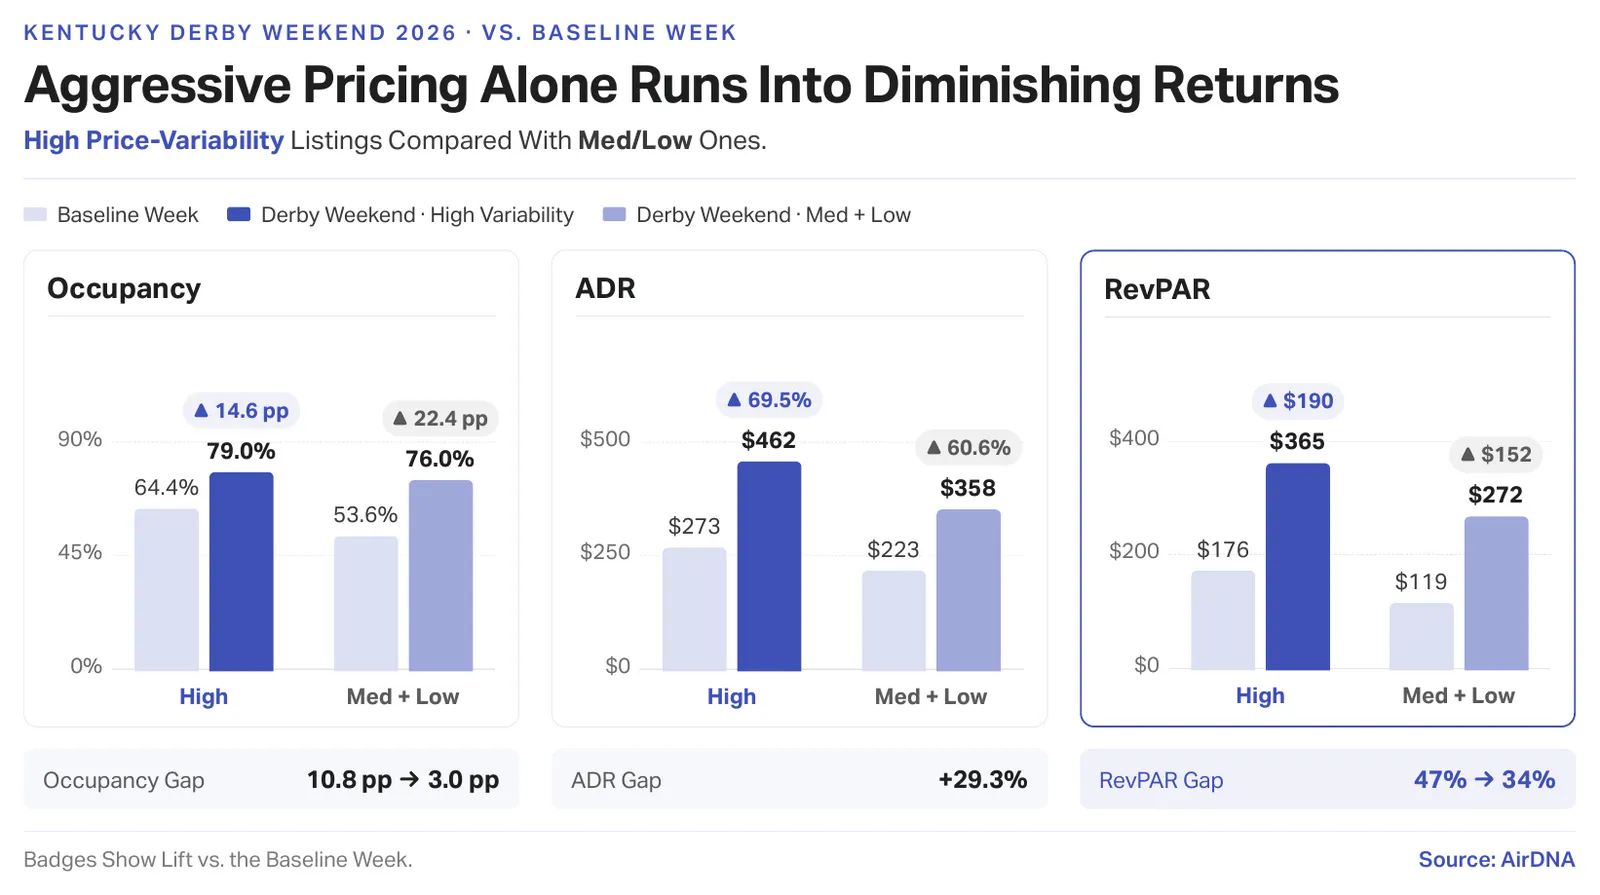
Comparing high price-variability listings over Derby weekend against a baseline weekend reveals a clear shift. The occupancy rate gap between the two groups narrows sharply, from 10.8 percentage points at baseline to 3.0 over the event, settling between 76% and 79% for both. As the occupancy gap closes, the rate gap widens: rates run 29% higher over the event against the usual 23% difference at baseline. High-variability listings raise rates by nearly 70% for the event, against 60% for everyone else. That produces a nominal revenue per available rental (RevPAR) increase of $190 over Derby weekend for high-variability listings against $152 for the rest. The RevPAR advantage remains, but the gap narrows from 47% at baseline to 34% during the Derby.
The second lever is the minimum stay. Over Derby weekend, the share of listings requiring a 3-night minimum grew from about 7-8% in the weeks either side of the event to nearly 20%, as hosts adjusted their policies to maximize earnings and streamline operations. To examine the effect, we took hosts with 1-2 night minimums in the weeks leading up to the Derby and checked whether they raised those minimums to 3 nights or more.
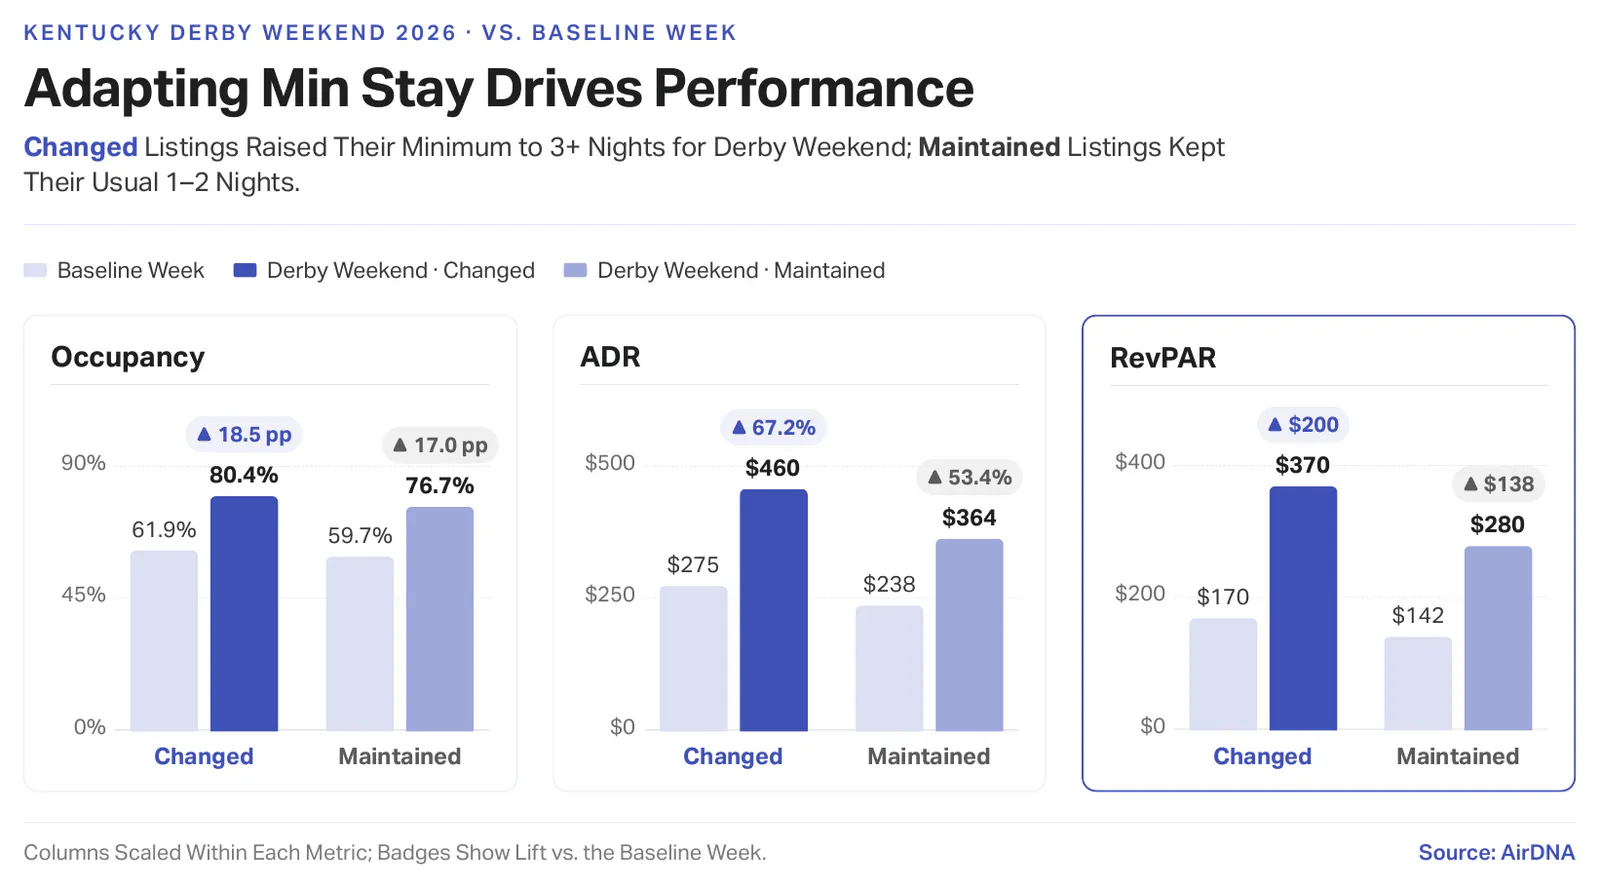
Occupancy followed a similar pattern to the price-variability analysis, converging in the mid-70s to 80%, though both cohorts were already closely aligned at baseline with only a 2.2pp difference. The average daily rate (ADR) gap is where the two groups separate: it widened from the usual 16% to 26%. That lifted the RevPAR difference from 20% at baseline to 32% over the event, with listings that adjusted their minimum stay earning $91 more RevPAR than listings that made no adjustment.
| Metric | Changed: baseline | Changed: Derby | Changed: lift | Maintained: baseline | Maintained: Derby | Maintained: lift |
|---|---|---|---|---|---|---|
| RevPAR | $170.32 | $370.19 | +117.3% | $141.83 | $279.50 | +97.1% |
| ADR | $275.15 | $460.15 | +67.2% | $237.54 | $364.44 | +53.4% |
| Occupancy | 61.9% | 80.4% | +18.5 pp | 59.7% | 76.7% | +17.0 pp |
Taking both levers together shows the real value of adjusting rates and minimum stay requirements at the same time. Over Derby weekend, high price-variability listings that also changed their minimum stay achieved the highest RevPAR at $398, a 117% increase and 15 percentage points more than high-variability listings that held their minimum stay fixed. Medium and low price-variability listings that changed their minimum stay reached $277 RevPAR, with an occupancy jump of 21-22pp doing most of the work.
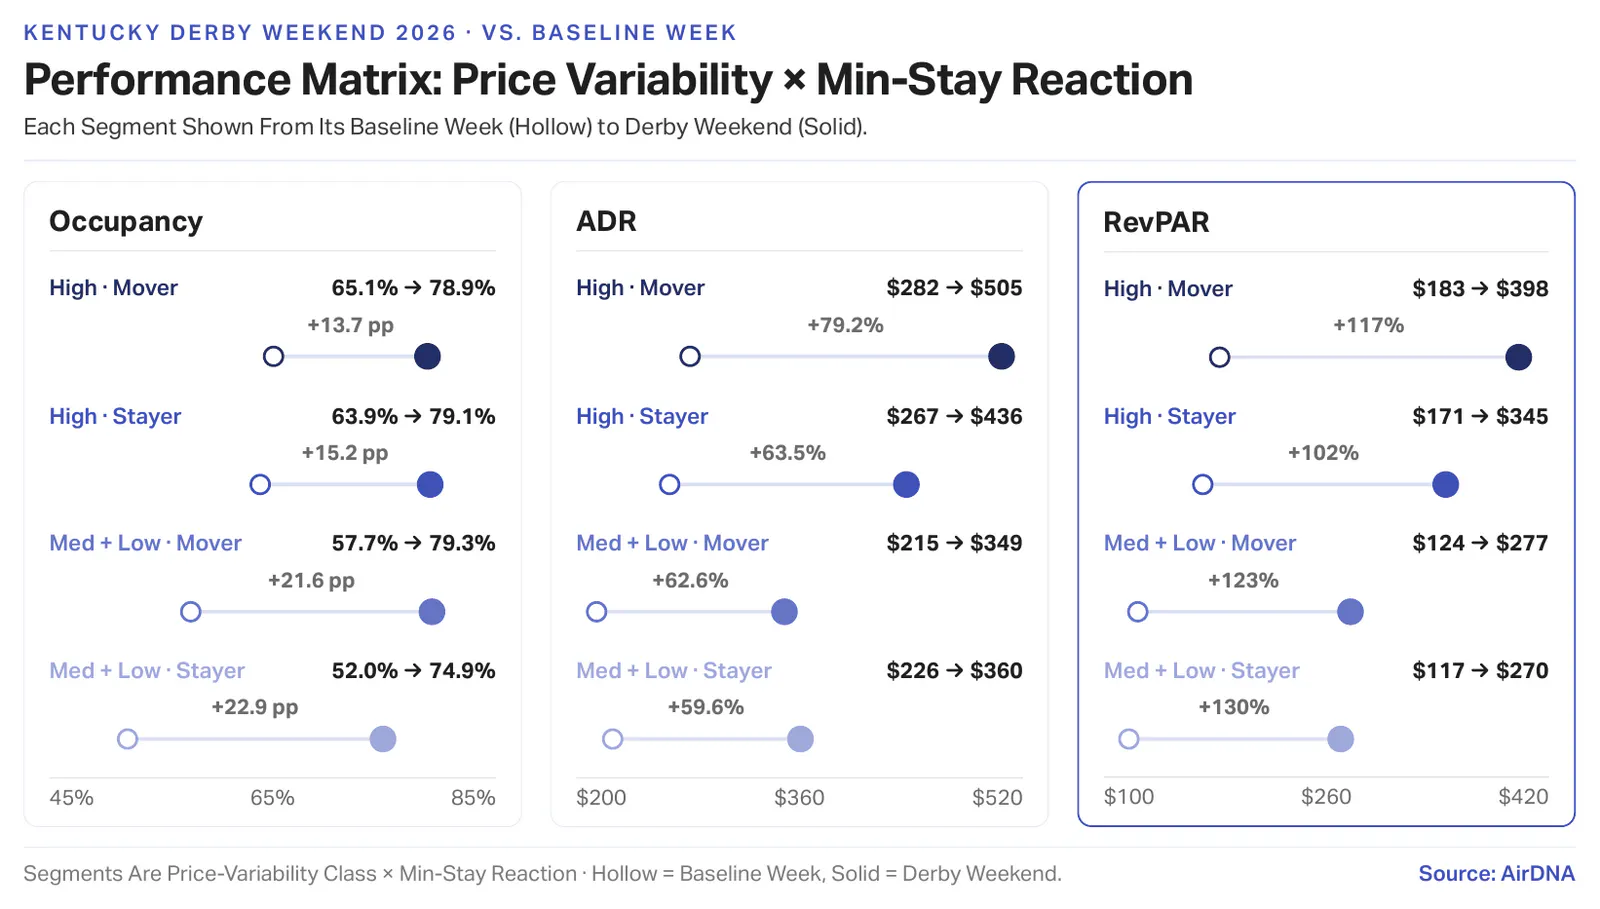
The most passive group posted the largest percentage RevPAR increase, at 130%, carried by the event’s sheer pull. But percentage gains from a low base are not the same as money in the bank. Failing to optimize the minimum stay drives up costs, mainly cleaning, while leaving RevPAR short of its ceiling: a gap of nearly $130 against their most active counterparts. A host on a 3-night minimum incurs turnover costs once, whereas a host taking multiple shorter bookings across the same nights sees that low-effort revenue eroded by cleaning and consumables, and the effect repeats across every festive weekend and high-demand date. It is the same trap that caught Philadelphia hosts during the 2026 PGA Championship, where the event alone was not enough.
The Masters: Half the Money Is Booked Before Anyone Arrives
The Masters is the most predictable event in sport: the same course, the same week, every April. That predictability is exactly what makes it risky. Knowing a year in advance encourages a host to set a fixed price and never revisit it, which is how a tournament week in Augusta gets sold at ordinary spring rates.
Augusta also requires careful screening. In April 2026 the market had 5,443 available listings, well above its twelve-month average of 3,817, a 43% increase in supply specifically for the tournament. Fewer than a third of those, 1,734, were available for at least 120 nights over the previous year. The rest are typically open only during tournament week, taking a few nights at high rates before disappearing again. Including them skews the averages, so this analysis covers only listings that meet the 120-night availability threshold, the properties genuinely dedicated to regular renting. For those properties, the tournament transforms the market: occupancy rises from 57.4% in a typical spring week to 85.1%, and average daily rates climb from $146 to $232, a 59% increase.
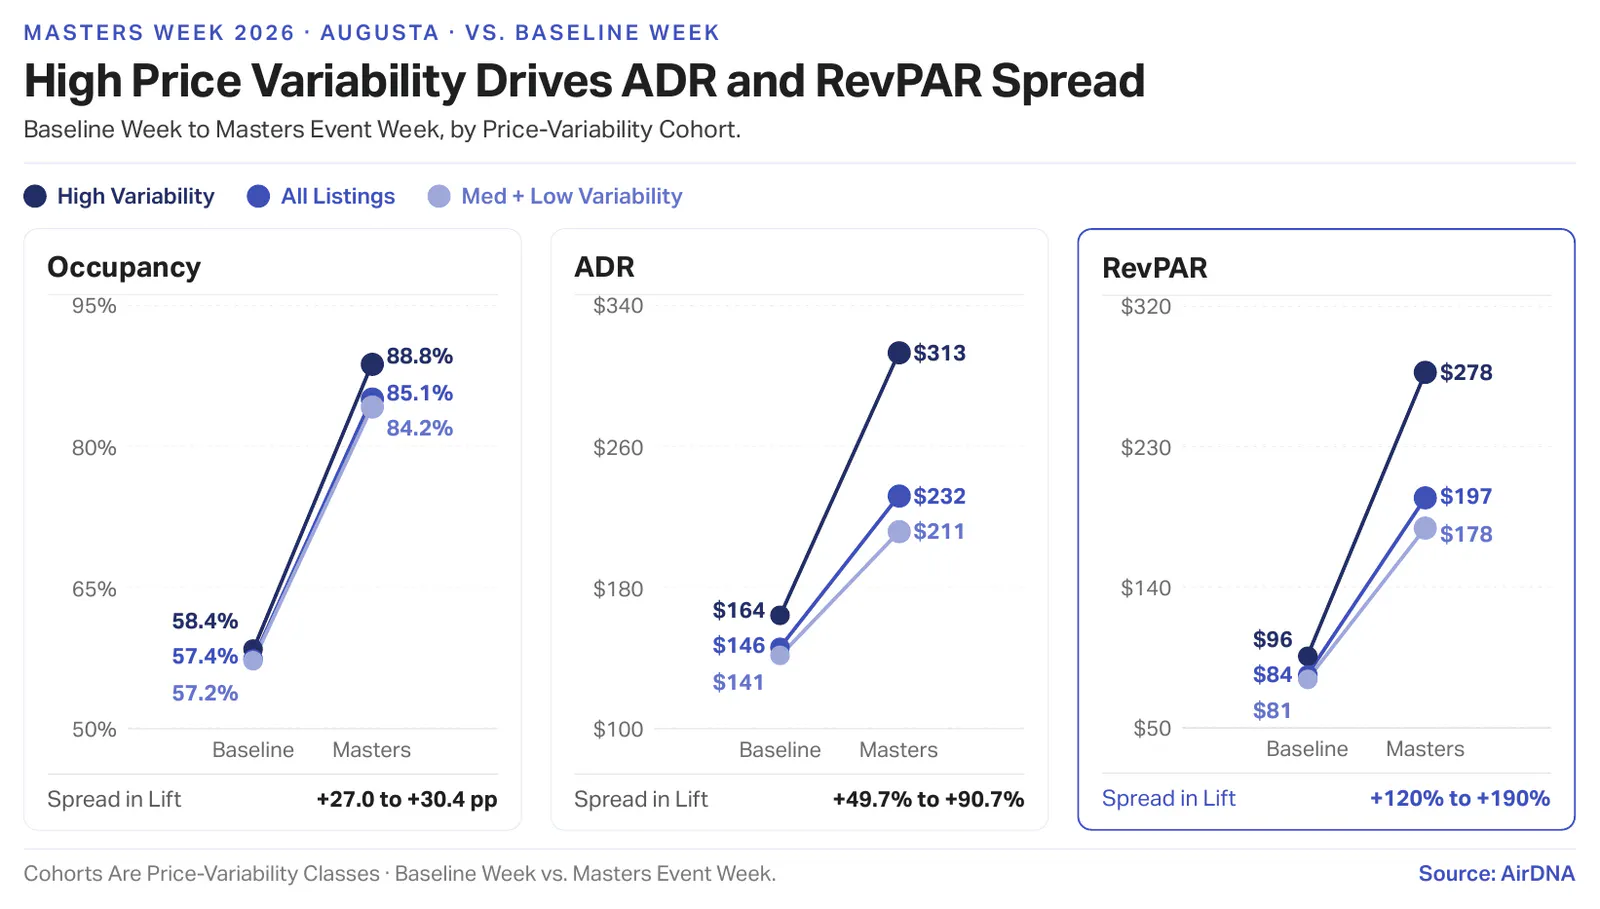
The difference between hosts is where it gets interesting. We can identify listings whose prices move frequently across the year, the signature of someone actively managing rates rather than setting them and walking away. Through Masters week those hosts ran 88.8% occupancy against 84.2% for everyone else, charged $313 a night against $211, and improved RevPAR by $182 against $97, very nearly double the gain. They were fuller and more expensive at the same time.
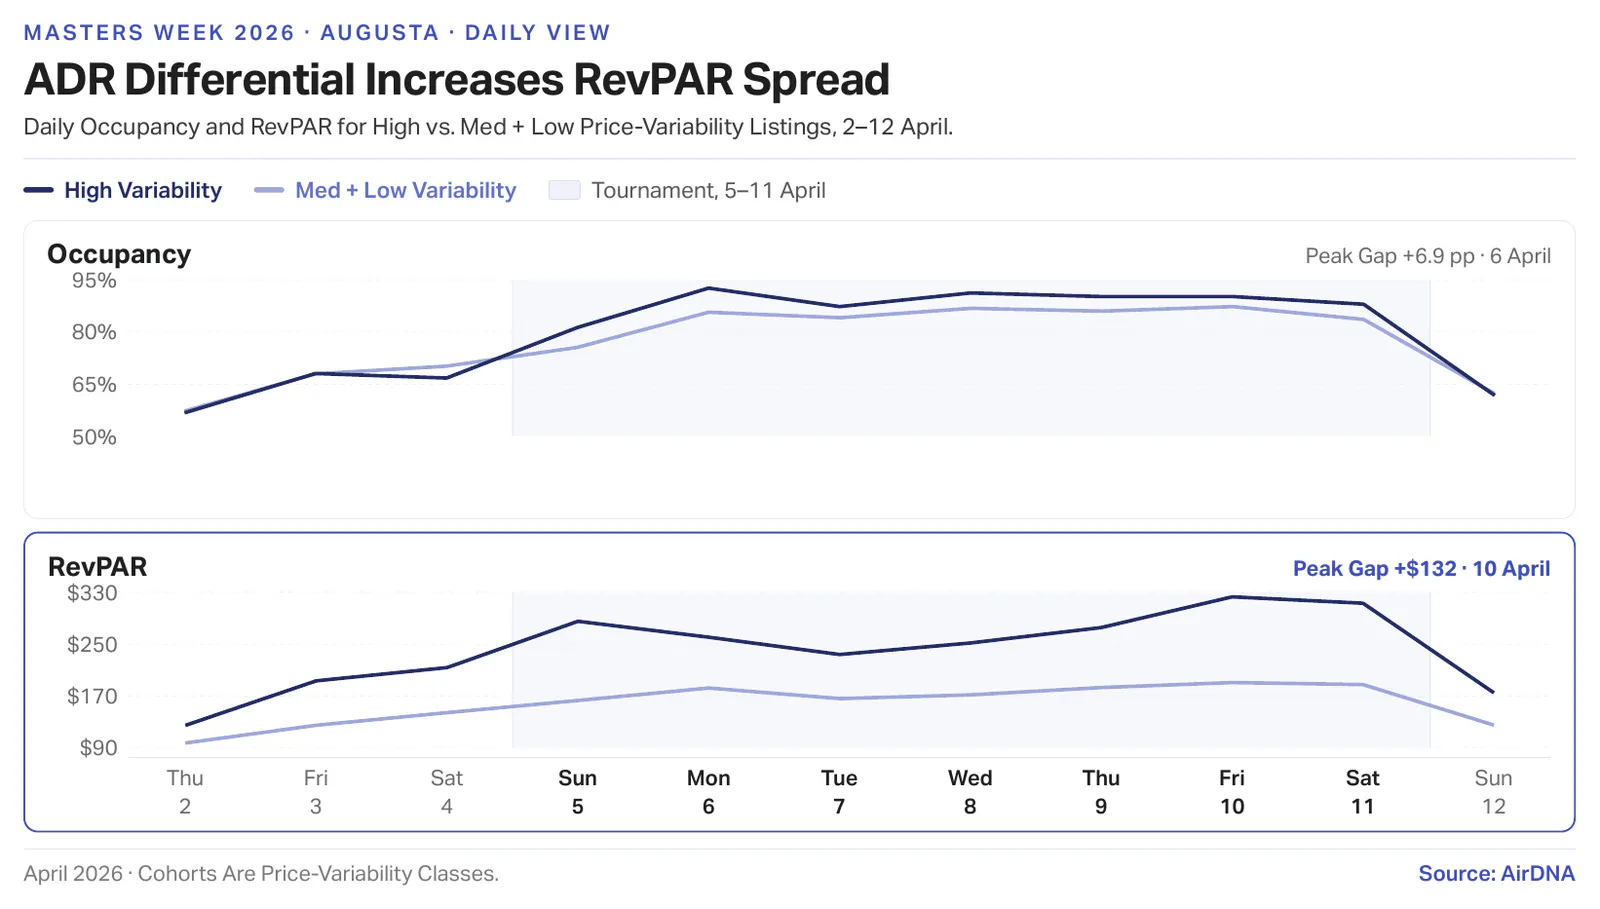
Their advantage was uneven across the week, which reveals how it was earned. On tournament Friday and Saturday everyone filled up. The largest occupancy gap came on arrival Sunday and practice Monday, the days hosts typically find hardest to sell. Once the tournament ended the gap closed, and by the Sunday after, the two groups were indistinguishable.
Minimum stay was the lever left on the table. Only 13.1% of Augusta hosts raised their minimum for tournament week, moving the share requiring four nights or more from 12.9% to 16.8%. Guests consistently stayed longer than the minimum anyway: hosts requiring one night averaged 2.9 nights, and those requiring five averaged 7.4. Choosing a minimum stay policy on event dates is a revenue decision, not an operations one.
Timing makes the same point from another direction. Masters inventory sells early, with half of all tournament nights booked ninety days out and eighty percent reserved a month ahead. What separated the two groups was whether the price moved with the calendar. Hosts with static pricing sold at much the same rate regardless of when the booking arrived, between $193 and $218 a night whether it was booked eight months ahead or in the final week. Hosts who priced actively saw their best booking window come in 35% above their worst, and took $362 a night from bookings placed three to six months out against $193 for the same window from everyone else. Over half of the passive group’s inventory was committed more than three months before the tournament, at a price set long before anyone knew how full Augusta would be.
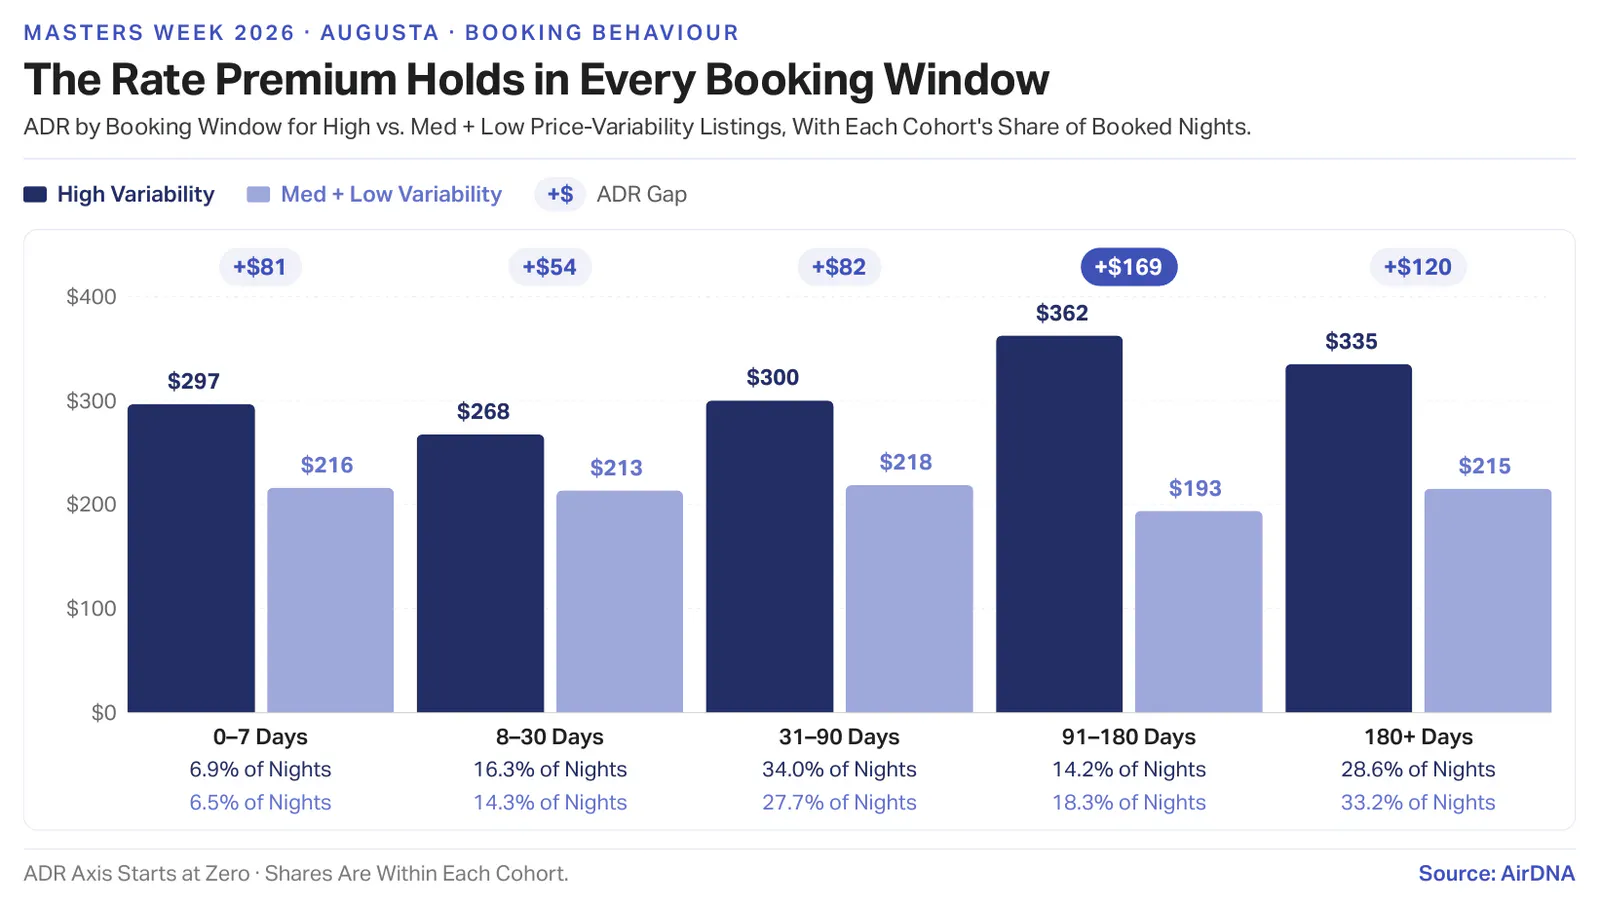
Augusta illustrates the same issue from a different angle. Where the Derby compresses decisions into a few days, the Masters spreads them over six months, which changes the definition of effective pricing without changing its importance. Everyone knew the tournament was coming; no forecast was needed to predict a full April. The key was not knowing but adapting. The active hosts filled arrival and practice nights that others could not sell, and held rates as the calendar advanced instead of settling early. They charged about a hundred dollars more per night and saw a RevPAR gain of nearly double their neighbors’. Those who did not adjust sold their remaining nights in an 85%-full week at the same prices they would have accepted six months earlier. The same pattern shows up on college football home game weekends, where the calendar matters more than the opponent.
How AirDNA Adapt Prices Event Dates for You
AirDNA Adapt is our dynamic pricing tool, powered by the same market data behind this analysis. It starts with a base price built on what comparable short-term rentals in your market are earning, then adjusts rates automatically for seasonal demand, booking pace, holidays, local events, and other market signals. It knows which events are coming, and it draws on years of data on how your market has performed around them before.
That means it captures the same patterns we’ve traced in both markets. Around a compressed event like the Derby, it concentrates the premium on the few nights that carry the weekend rather than spreading it thinly across a whole week. In Augusta, where over half of tournament inventory is booked more than three months out, it keeps repricing through that long window instead of holding a rate set before anyone knew how full April would be.
It also adjusts as demand changes. If bookings for an event date are arriving faster than that market’s usual pace, rates rise to match. If demand softens, rates adjust before occupancy starts to fall, rather than afterwards, when the only lever left is discounting whatever is still unsold.
Whether your market lives on one intense weekend a year or a season that builds over months, Adapt keeps your pricing aligned with what your market is actually doing, not what it was doing last month or last year.
FAQs
Does dynamic pricing actually work for events when the date is known a year ahead?
Knowing the date is not the advantage; everyone in the market knows it. Our Augusta data shows that hosts with static pricing sold at nearly the same rate no matter when the booking arrived, between $193 and $218 a night whether it was booked eight months out or in the final week. Hosts who kept repricing took $362 a night from bookings placed three to six months out against $193 for the same window from everyone else. The date is certain; the demand is not, and that is what dynamic pricing responds to.
Should I raise my minimum stay for a big local event?
Over Kentucky Derby weekend, Louisville listings that raised their minimum from 1-2 nights to 3 or more earned $370 RevPAR against $280 for listings that held their usual minimum, a $91 difference. The share of Louisville listings on a 3-night minimum rose from roughly 8% to nearly 20% for Derby weekend, then fell straight back. On a genuine demand peak, the revenue from a longer stay outweighs the bookings you turn away, and you pay for one turnover instead of several.
Is it better to change my rates or my minimum stay?
Both, together. Over Derby weekend, high price-variability listings that also raised their minimum stay reached $398 RevPAR, the highest of any group and 15 percentage points more growth than high-variability listings that left the minimum alone. Listings that changed neither finished at $270, nearly $130 behind. Rate is the bigger single lever, but the two compound.
Who offers the best dynamic pricing using event data?
AirDNA Adapt prices from the same market dataset behind this analysis, so it knows which events are coming and how your specific market has performed around them in previous years. It adjusts for booking pace as well as the calendar, so if demand for an event date is arriving faster than your market’s normal pace, rates move up to meet it, and if demand softens, rates adjust before occupancy starts to slip.
How far in advance do event dates get booked?
It depends entirely on the event, which is why one strategy does not transfer. Masters week in Augusta sells early: half of all tournament nights are booked ninety days out and eighty percent a month ahead. Kentucky Derby weekend compresses the same decisions into a handful of nights. The practical implication is that a long booking window is a long repricing window, not a reason to set a rate once and stop.
ARTICLE SUMMARY
AirDNA compared two of the most predictable events on the American calendar to see what dynamic pricing is actually worth when the date is certain but the demand is not. Over Kentucky Derby weekend, Louisville listings that moved both their rates and their minimum stay hit $398 RevPAR, nearly $130 more than the listings that changed neither. During Masters week in Augusta, hosts who kept repricing ran 88.8% occupancy at $313 a night against 84.2% at $211 for everyone else, and nearly doubled the RevPAR gain. The two events reward opposite tempos, and the levers that win are the same ones every host already controls.
Camilo Schmid Rivas
Senior Research Analyst
Camilo Schmid Rivas is a Senior Research Analyst at AirDNA who brings a uniquely well-rounded perspective to short-term rental analytics. With a background that spans investment, real estate, and business analysis—including roles at Stayery and Sollers Consulting—Camilo has worn many analyst hats, each sharpening his ability to turn complex data into clear, actionable insights. A graduate of École hôtelière de Lausanne, he now channels his multidisciplinary expertise into uncovering trends that drive smarter STR decisions. In his free time, he enjoys playing tennis or scuba diving in or around Barcelona.