


U.S. Review June 2025: STR Supply Surges as Nightly Rates Climb
Published: July 15, 2025

Bram Gallagher
Key Takeaways:
- Available listings rose 6.1% year-over-year as tax incentives and stabilizing occupancy improve the outlook for short-term rental investors.
- Despite a slight dip in occupancy, ADR rose 6.8% and RevPAR increased 5.5%. Lower-priced listings lead the way in rate growth.
- Demand pacing is increasingly unreliable as booking behavior shifts, with last-minute reservations now making up a larger share of total bookings.
In June, the U.S. short-term rental (STR) market hit a new record: available listings grew 6.1% year-over-year to 1.76 million. This marked the second consecutive month of supply growth exceeding 5%, signaling renewed momentum after a prolonged slowdown. Since the Federal Reserve began raising interest rates in March 2022, STR supply growth had cooled sharply due to higher mortgage costs. With occupancy stabilizing and average daily rates (ADR) rising 6.8% year-over-year (YOY), STR investments are starting to look more attractive today than at any point in the past year.
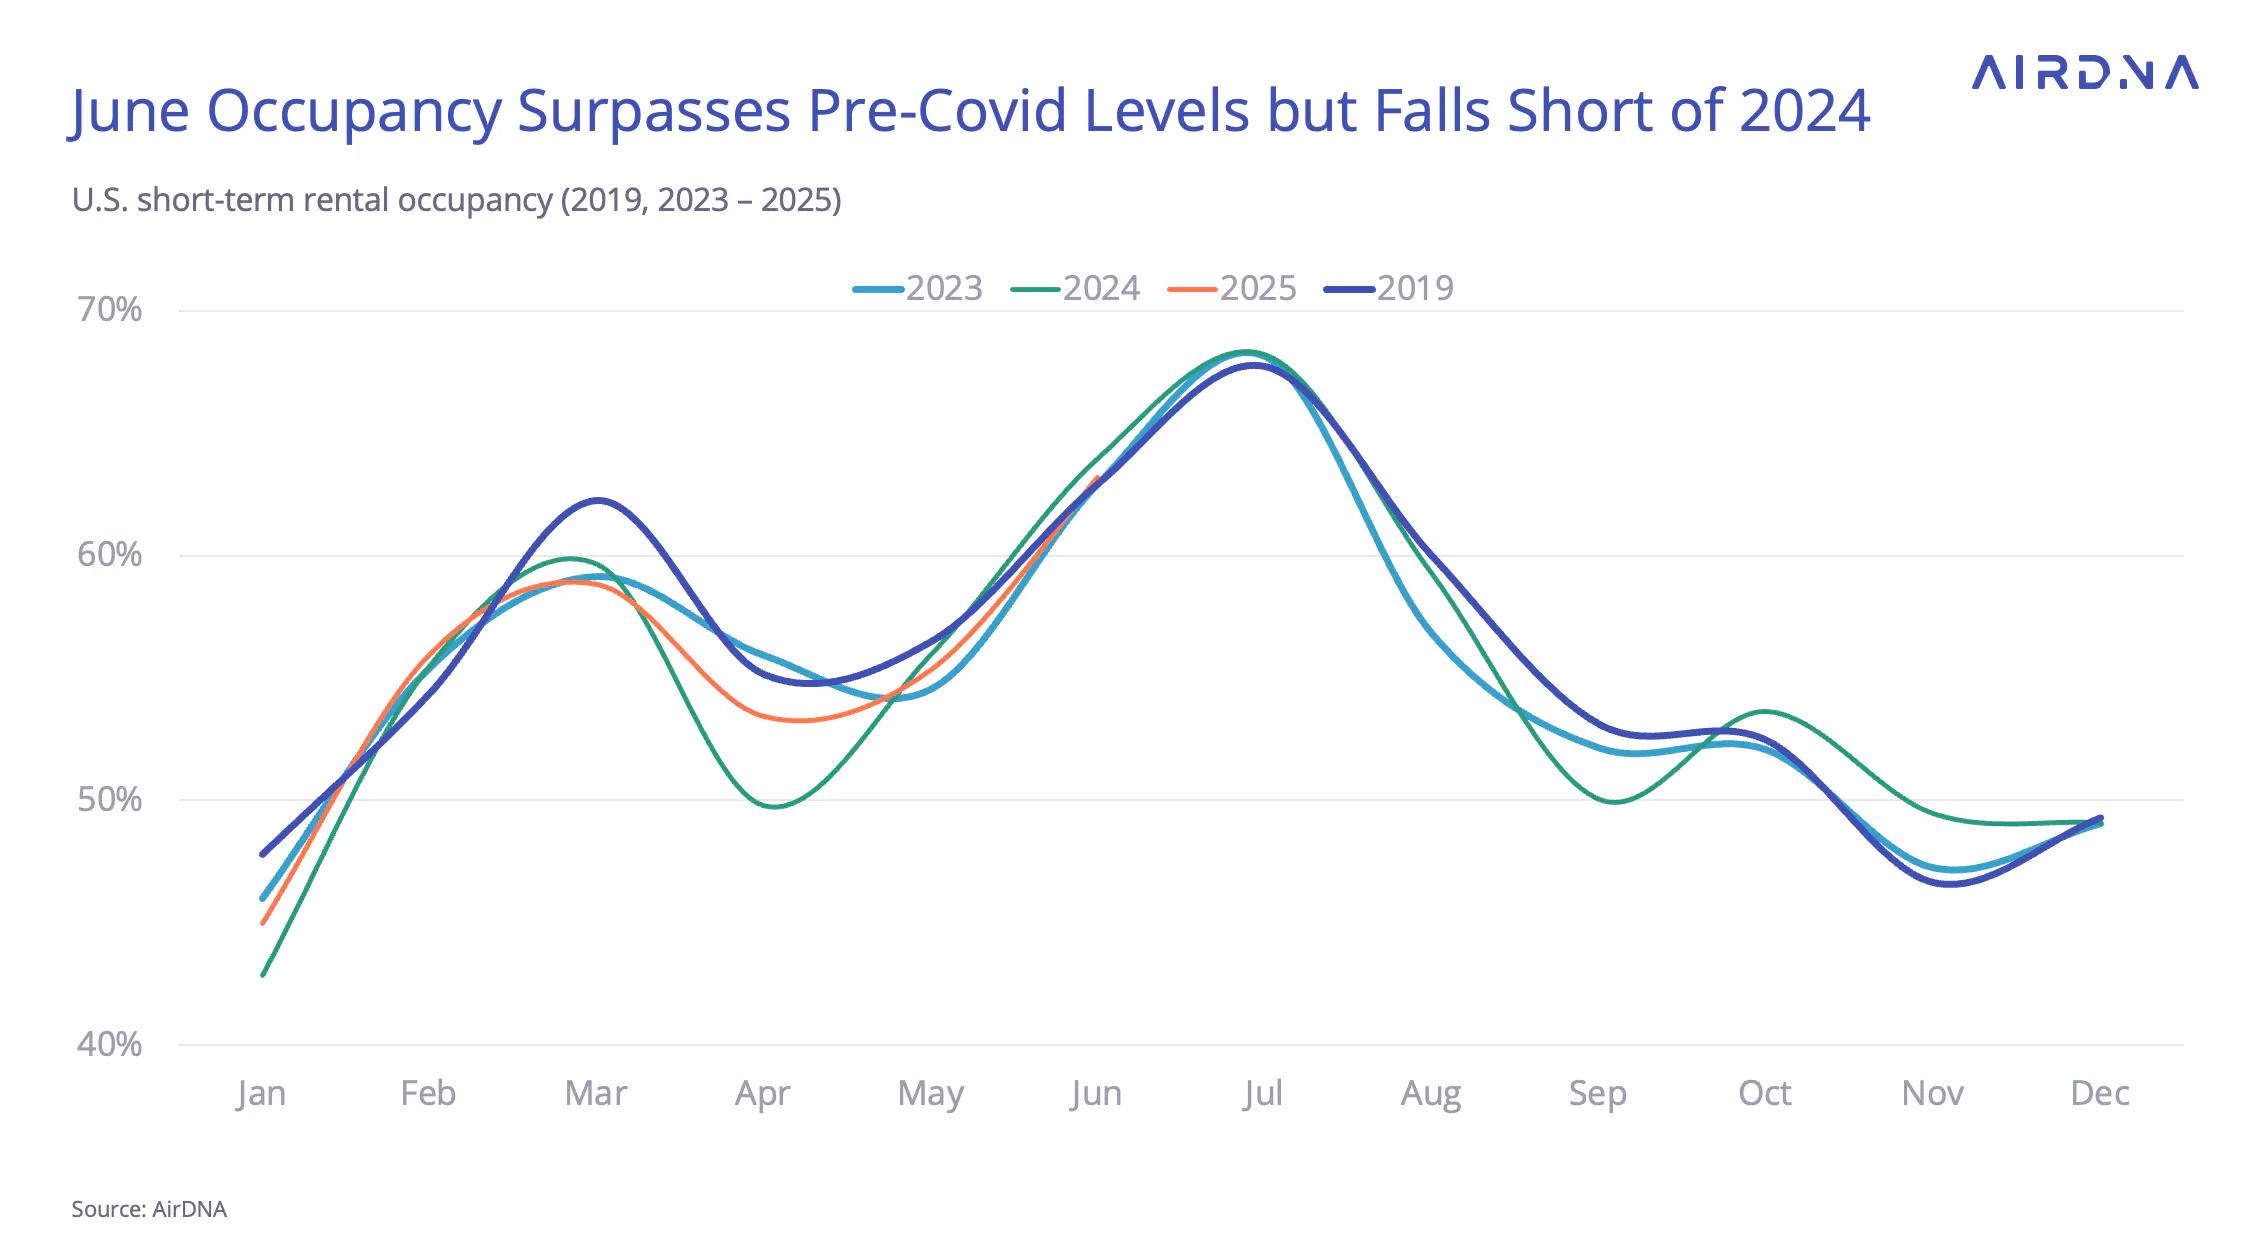
More travelers are staying in short-term rentals in the U.S., with demand increasing +3.1% YOY in June. Although occupancy dipped slightly to 63.2%, down from 64.0% in June 2024, it remained above the pre-pandemic benchmark of 62.8%.
Economic Outlook
There remains considerable uncertainty surrounding tariff policy even three months after the dramatic April announcement. That being said, delays and negotiations have eased the concerns of many market watchers over what initially seemed like a drastic and perhaps ruinously high slate of new taxes.
The Trump administration has publicly criticized Federal Reserve Chair Jerome Powell for holding off on rate cuts. However, inflation risks tied to new tariffs and recent fiscal stimulus have made the Fed wary of loosening monetary policy, which many economists see as potentially inflationary. Complicating the case for cuts further is the relatively strong jobs data: The U.S. economy added 147,000 jobs in June, slightly more than in May, and the unemployment rate edged down to 4.1%.
This unemployment rate is consistent with what economists call “full employment.” In other words, this is the lowest level of unemployment that the economy can support in the long run. There is little room for further labor market improvement and growing inflation risks from tariffs and rising price expectations. As a result, the Fed likely sees rate cuts as inconsistent with its dual mandate of maintaining low inflation and full employment. Still, tariff-driven inflation is expected to be short-lived. Most forecasts anticipate the Fed will resume rate cuts later this year, with at least one reduction by December and potentially more if the labor market weakens.
We expect these cuts to eventually transmit to the mortgage lending market, reducing the borrowing cost for new buyers and enabling homeowners to refinance at lower rates. This should help loosen up the housing market and support additional STR supply over the medium term. Another potential boost could come from a provision in the recently passed budget bill that allows for expedited depreciation on investment properties. While neither of these factors directly impacted June’s supply growth, both are likely to support further supply acceleration in the second half of 2025 and into 2026.

At a Glance: Key U.S. STR Performance Metrics for June 2025
- Revenue per Available Rental (RevPAR) increased 5.5% year-over-year (YOY) to $214.09
- Available listings reached 1.76 million, a 6.1% increase year-over-year
- Demand nights rose 3.1% compared to June 2024
- Occupancy averaged 63.2%, down 1.2 percentage points year-over-year
- Average Daily Rates (ADR) climbed to $338.83, up 6.8% from last year
- The Repeat Rent Index (RRI) rose 6.9% year-over-year
- Total nights booked resumed growth, up 2.7% from June 2024.
Supply Growth Speeds Up Again
Potential short-term rental (STR) investors have faced a tough landscape over the past year. Mortgage rates have remained stubbornly high, hovering around 6.8% since at least November 2024. Home prices have also continued to rise, albeit at a slower rate. In May, Redfin reported a modest +0.6% increase in home prices, a far cry from the rapid post-pandemic surge but still enough to dampen investment enthusiasm.
Operators, on the other hand, may welcome the respite from relentless new competition. The latest acceleration in supply growth from +5.5% in May to +6.1% in June is notable, but it’s too soon to say definitively that listing growth has passed its low point. After all, the market experienced a similar spike in July and August 2024 before growth dipped back below 5%. Nevertheless, AirDNA is closely watching supply trends. Several factors suggest that supply growth could continue to accelerate or at least remain above the 5% year-over-year mark.
One of the biggest tailwinds for future supply growth is a new tax provision that is similar to a budget provision from Trump’s first term. It allows for full and immediate depreciation of new commercial real estate, essentially front-loading tax benefits to stimulate new business investment. If it works as intended, this provision could encourage new hosts to enter the market and prompt existing owners to expand their portfolios.
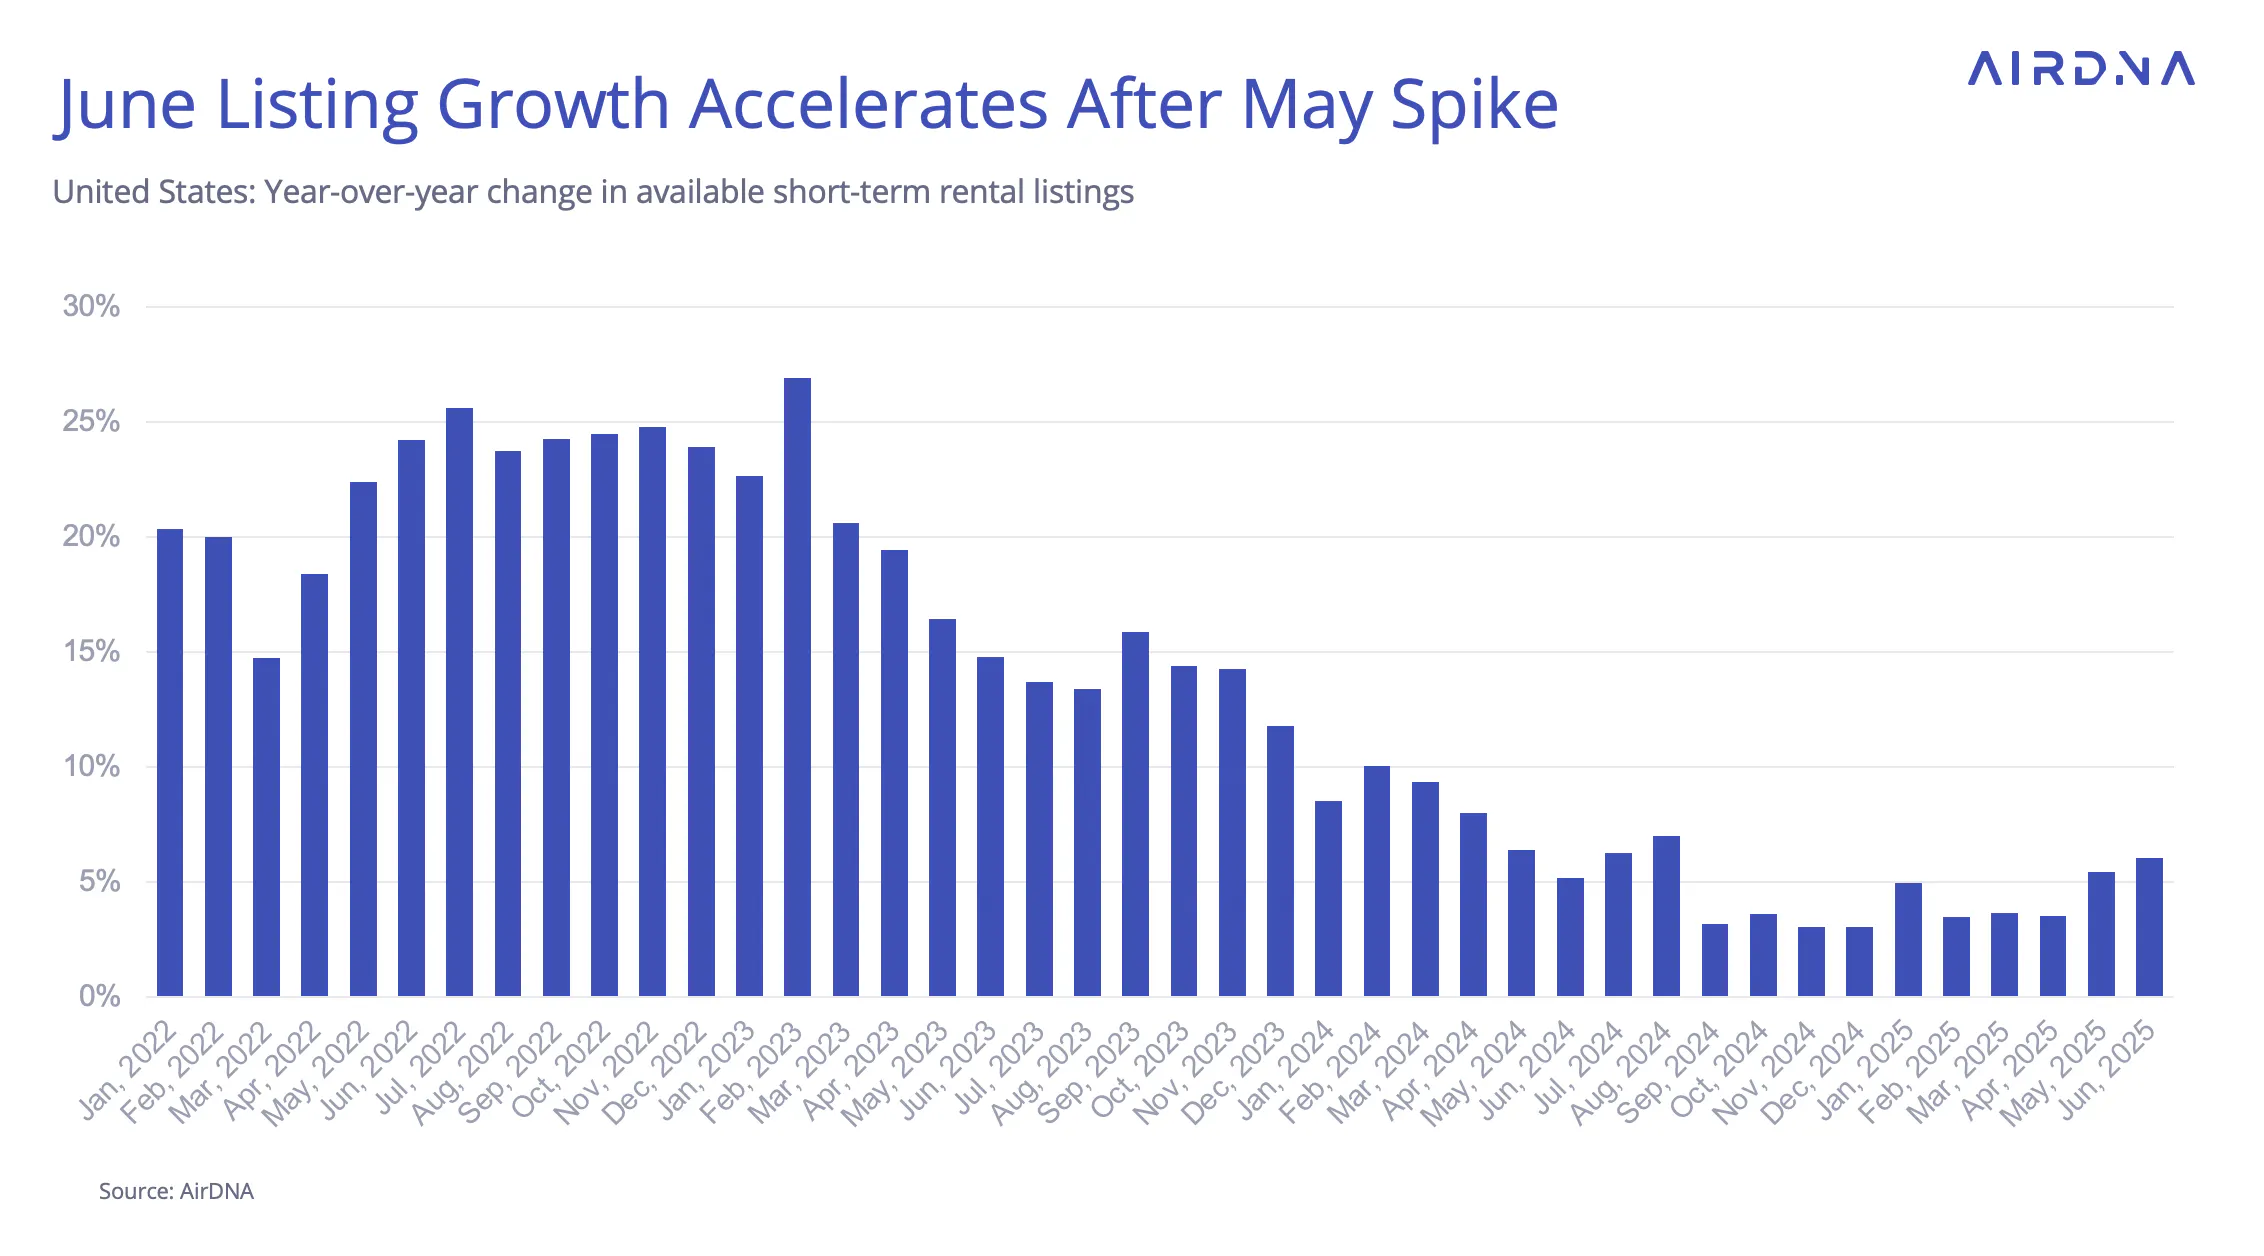
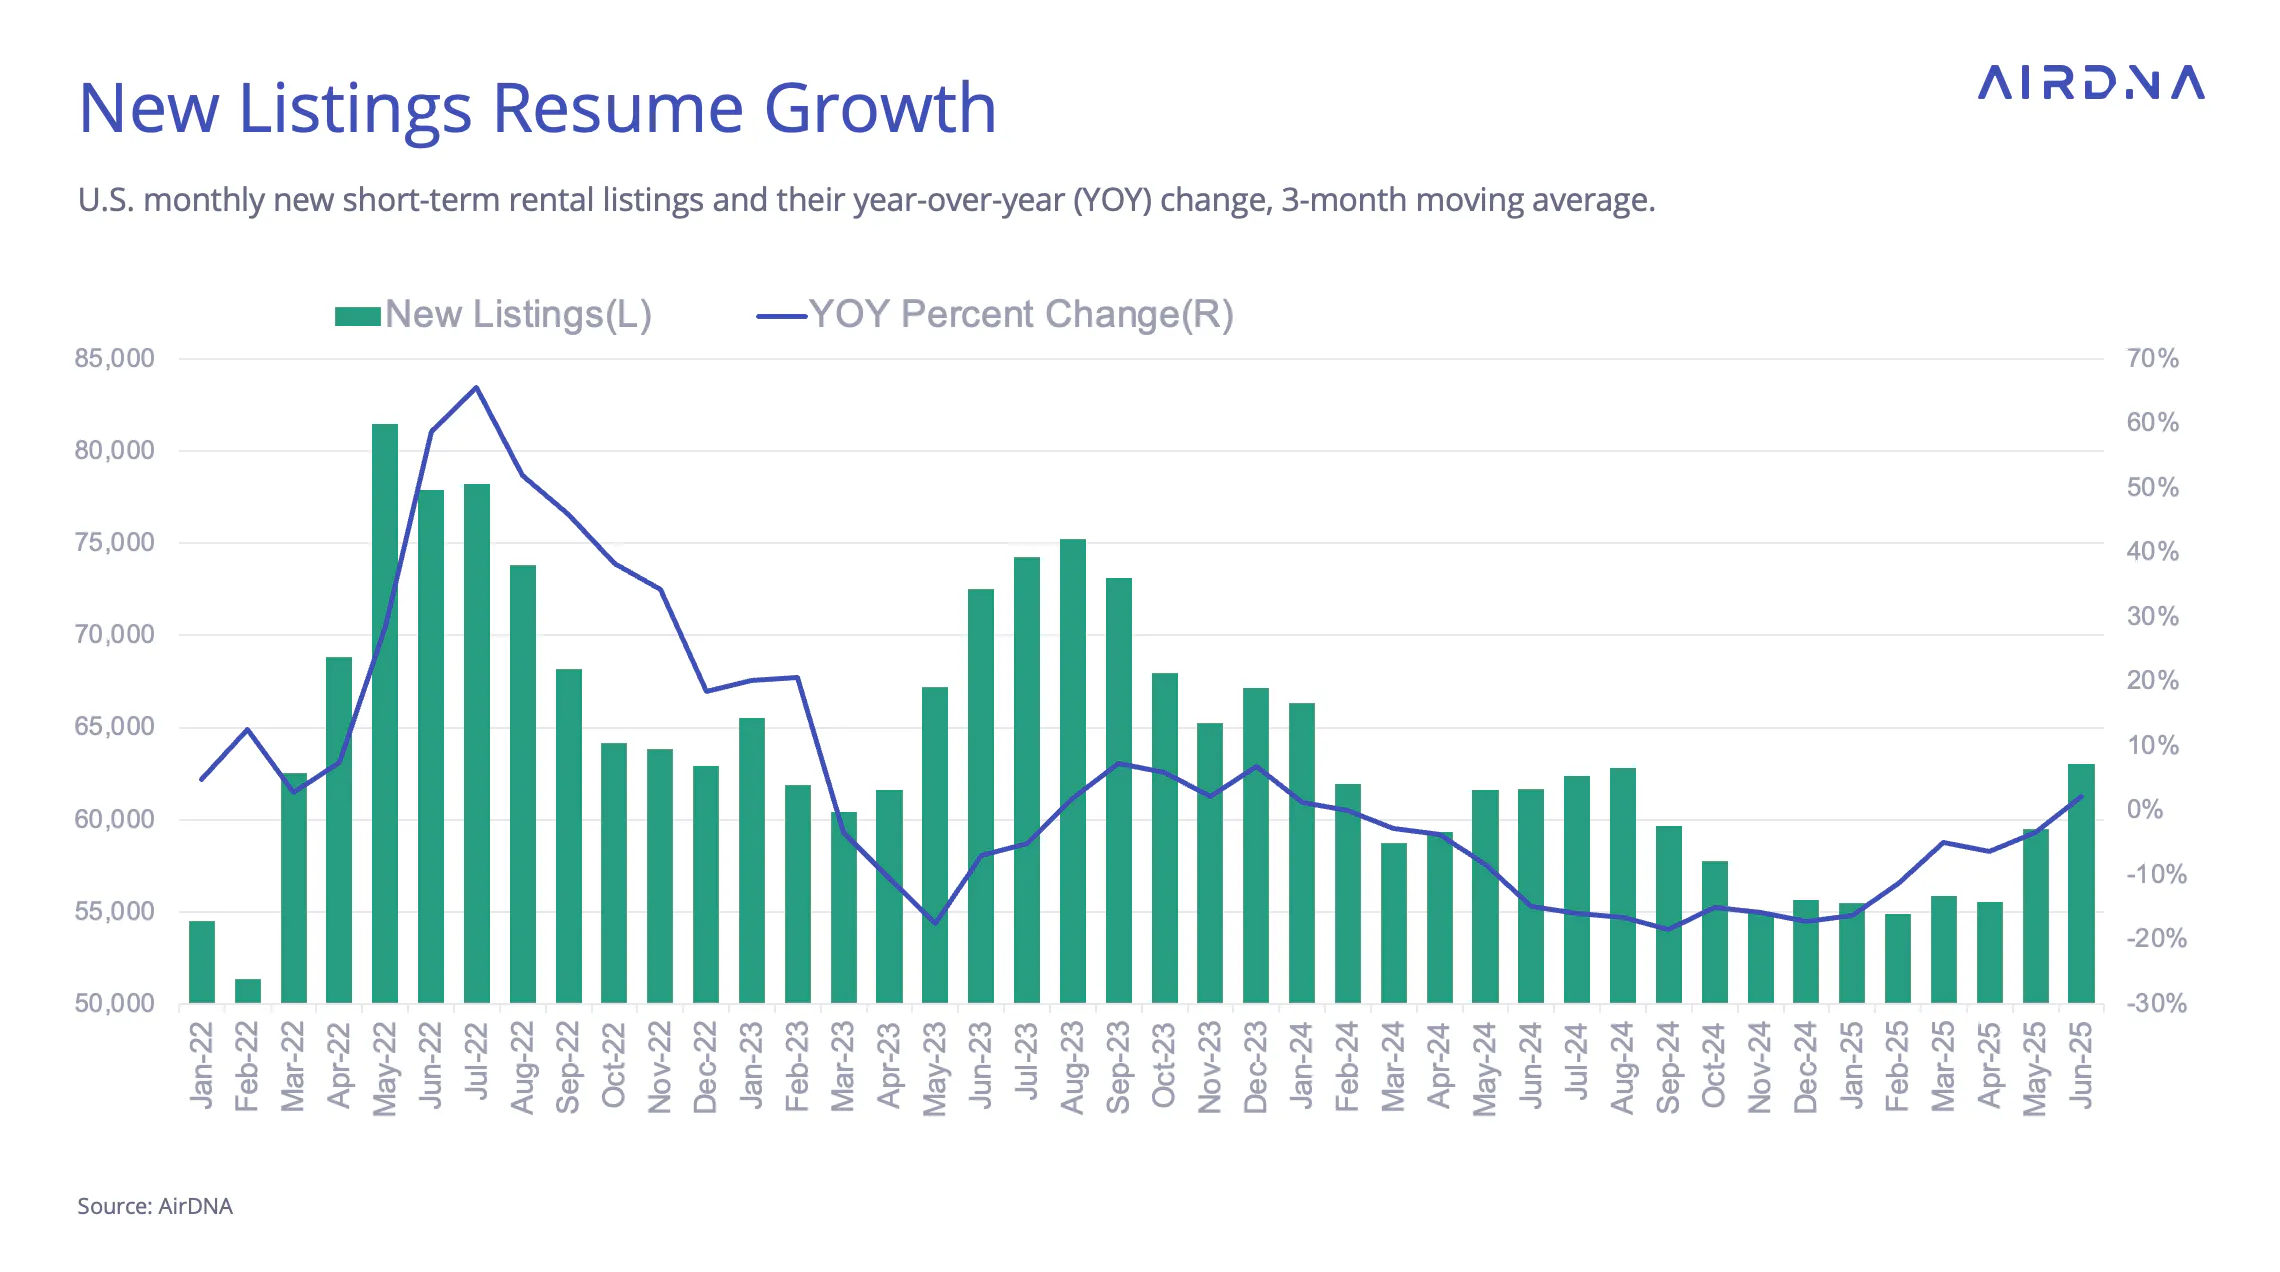
This policy shift may add fuel to the recent rebound in new listings. New listings are one of three key drivers of overall supply growth, along with returning listings and expanded availability of existing listings. New listings began growing in June on a year-over-year basis for the first time since February 2024, based on a three-month moving average. That’s a sharp reversal for new listings from the beginning of the year, when they were down more than 16% year-over-year.
Demand Growth and Occupancy
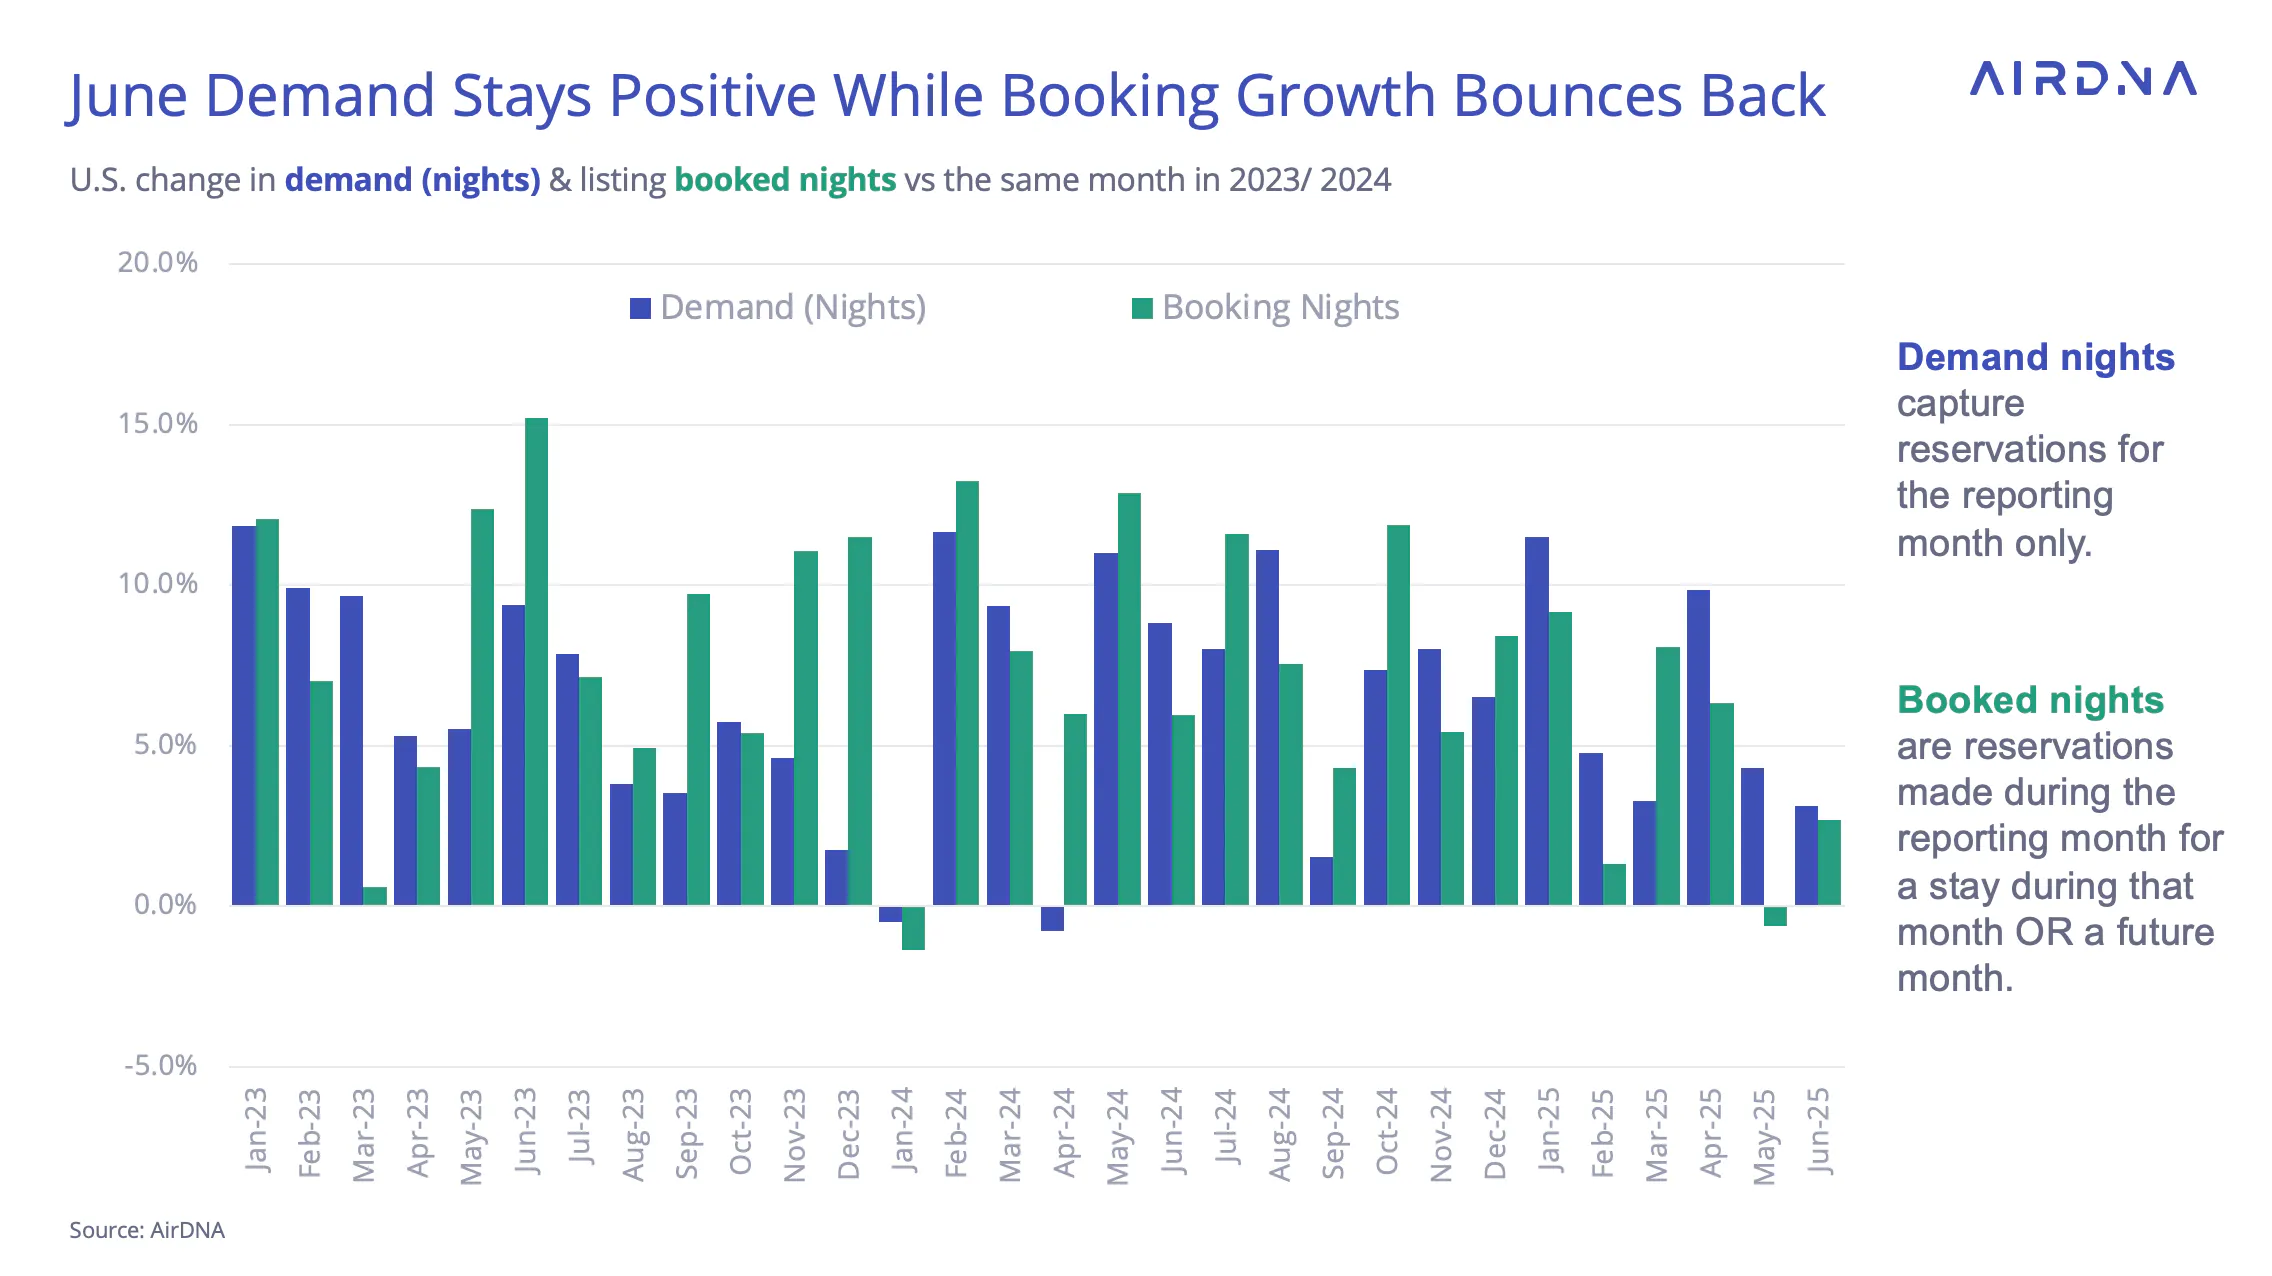
June, the first full month of summer in 2025, saw year-over-year demand growth slow again to 3.1%, down from 4.3% in May. Booking growth, which is a forward-looking indicator for demand, declined slightly in May but rebounded to +2.7% YOY in June. This pickup in booking activity could signal strong performance for July, especially with July 4th falling on a Friday this year.
June continued the trend of slightly softening demand paired with accelerating supply, which reduced occupancy by 1.2% YOY to 63.2%. Excluding the outlier year of 2021, June occupancy has maintained a tight range of occupancies between 64.2% in 2022 to as low as 62.9% in 2019. This puts June 2025 in the middle of the pack.
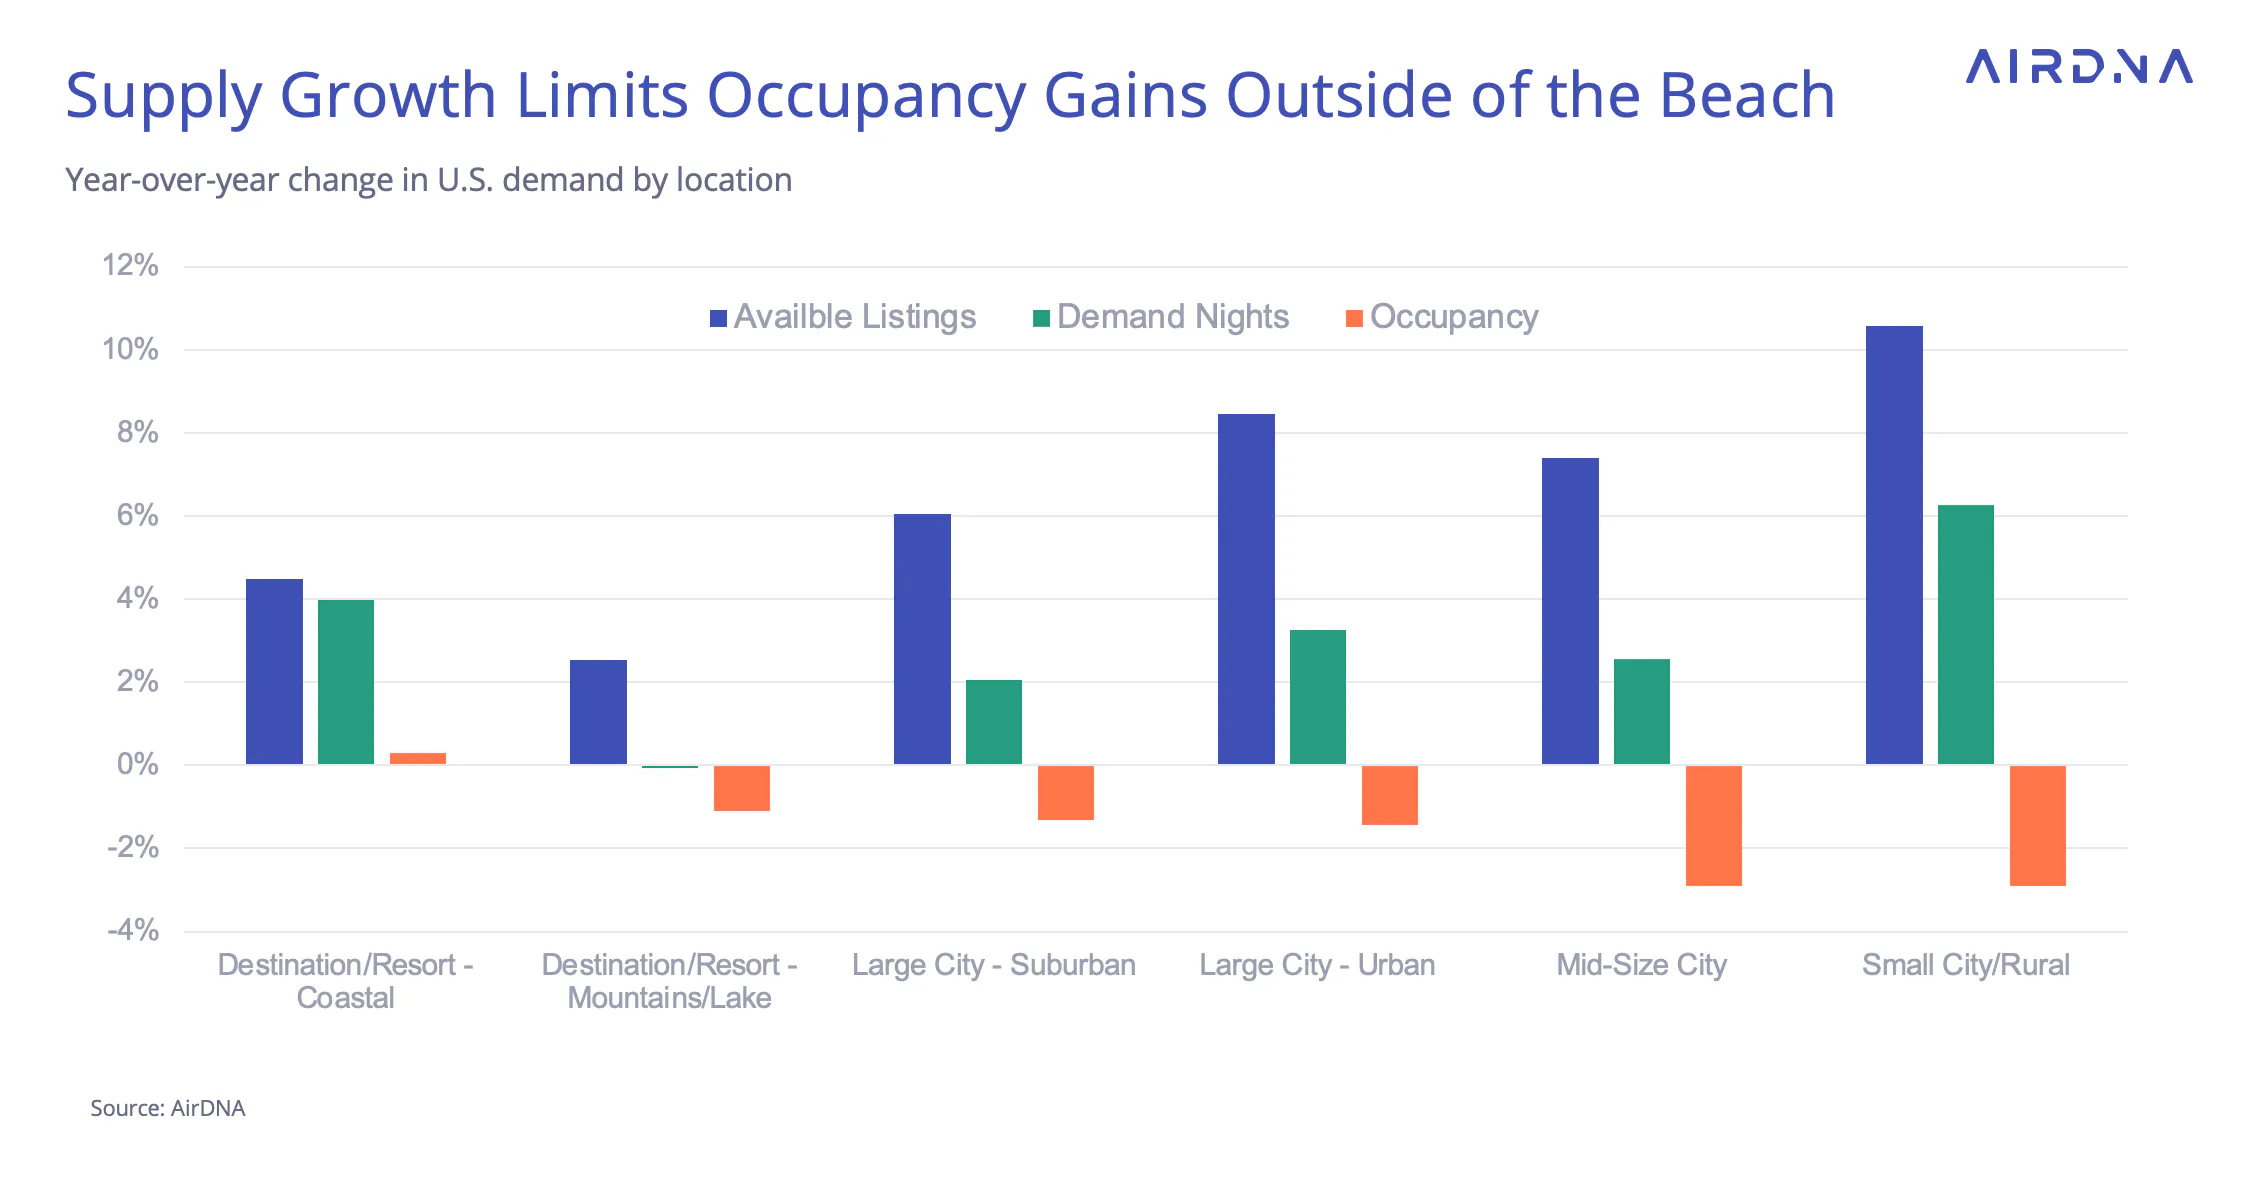
Occupancy changes weren’t uniformly spread across locations. Markets with higher available listing growth tended to see larger occupancy losses. Coastal resorts were the only market type to post an occupancy gain (+0.3% YOY), benefiting from the second-lowest growth in available listings and the second-highest demand growth. In contrast, Small City/Rural locations experienced the largest year-over-year decline in occupancy (-2.9%) despite leading in both new listings and demand growth.
Urban Markets Take the Lead for Listing Growth
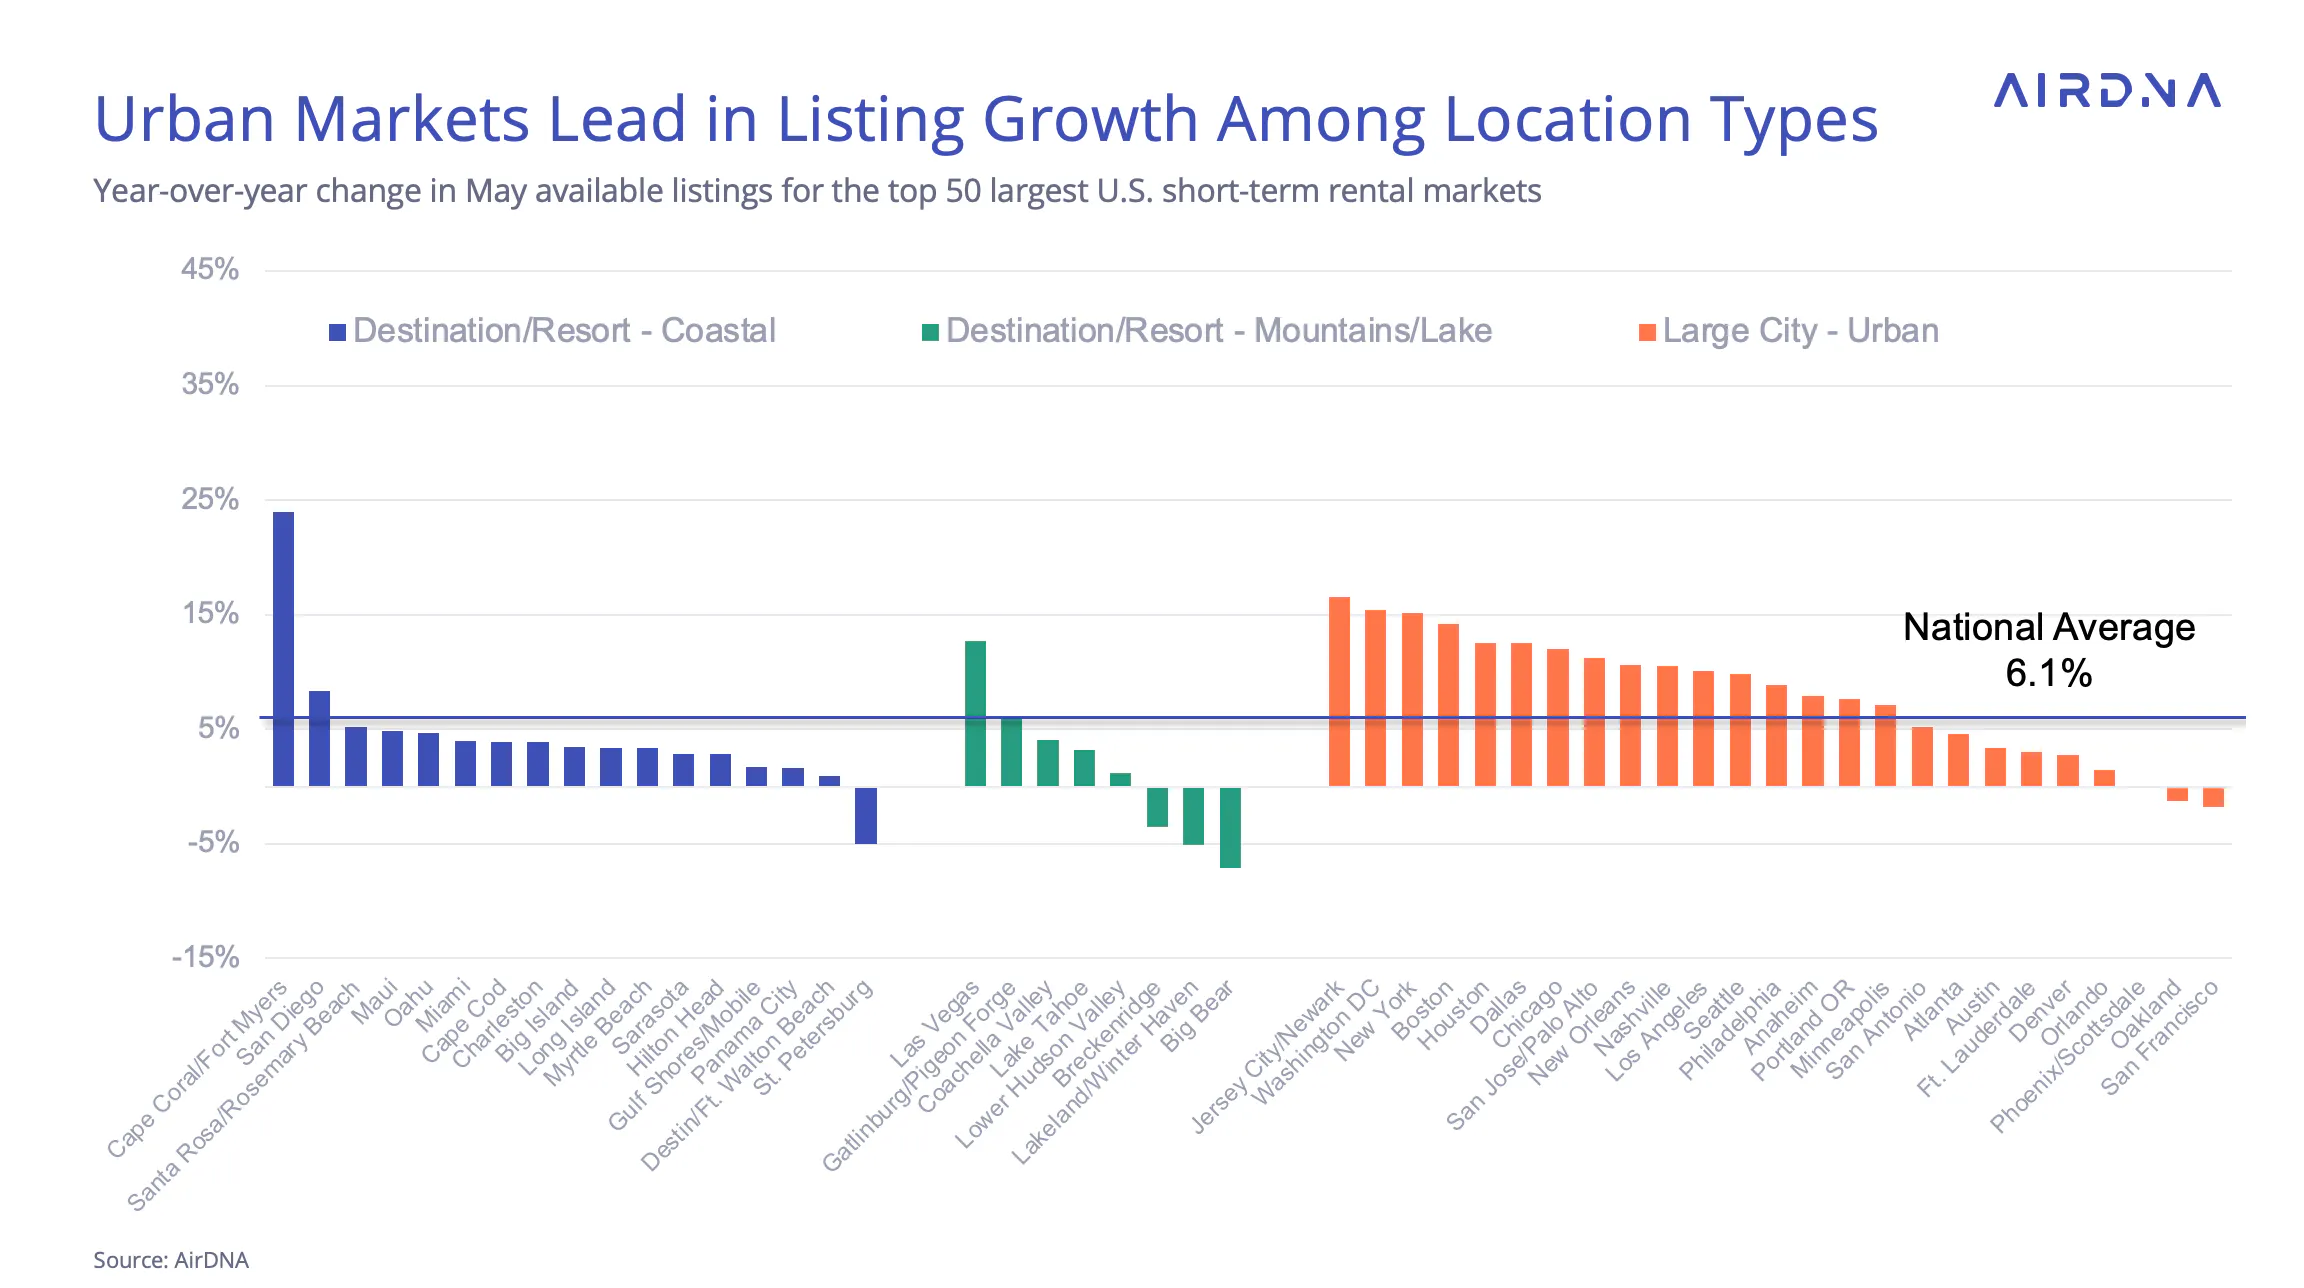
The U.S. top 50 markets include Large City Urban, Large City Suburban, Coastal, and Mountain/Lake markets. In June, Large City Urban locations clearly led the pack for listing growth. Of the 19 markets that outperformed the national average, 16 were Large City Urban. Cape Coral/Fort Myers, Florida stood out with the highest growth in available listings (+24.0%), continuing an aggressive recovery from the damage caused by Hurricane Ian in late 2022.
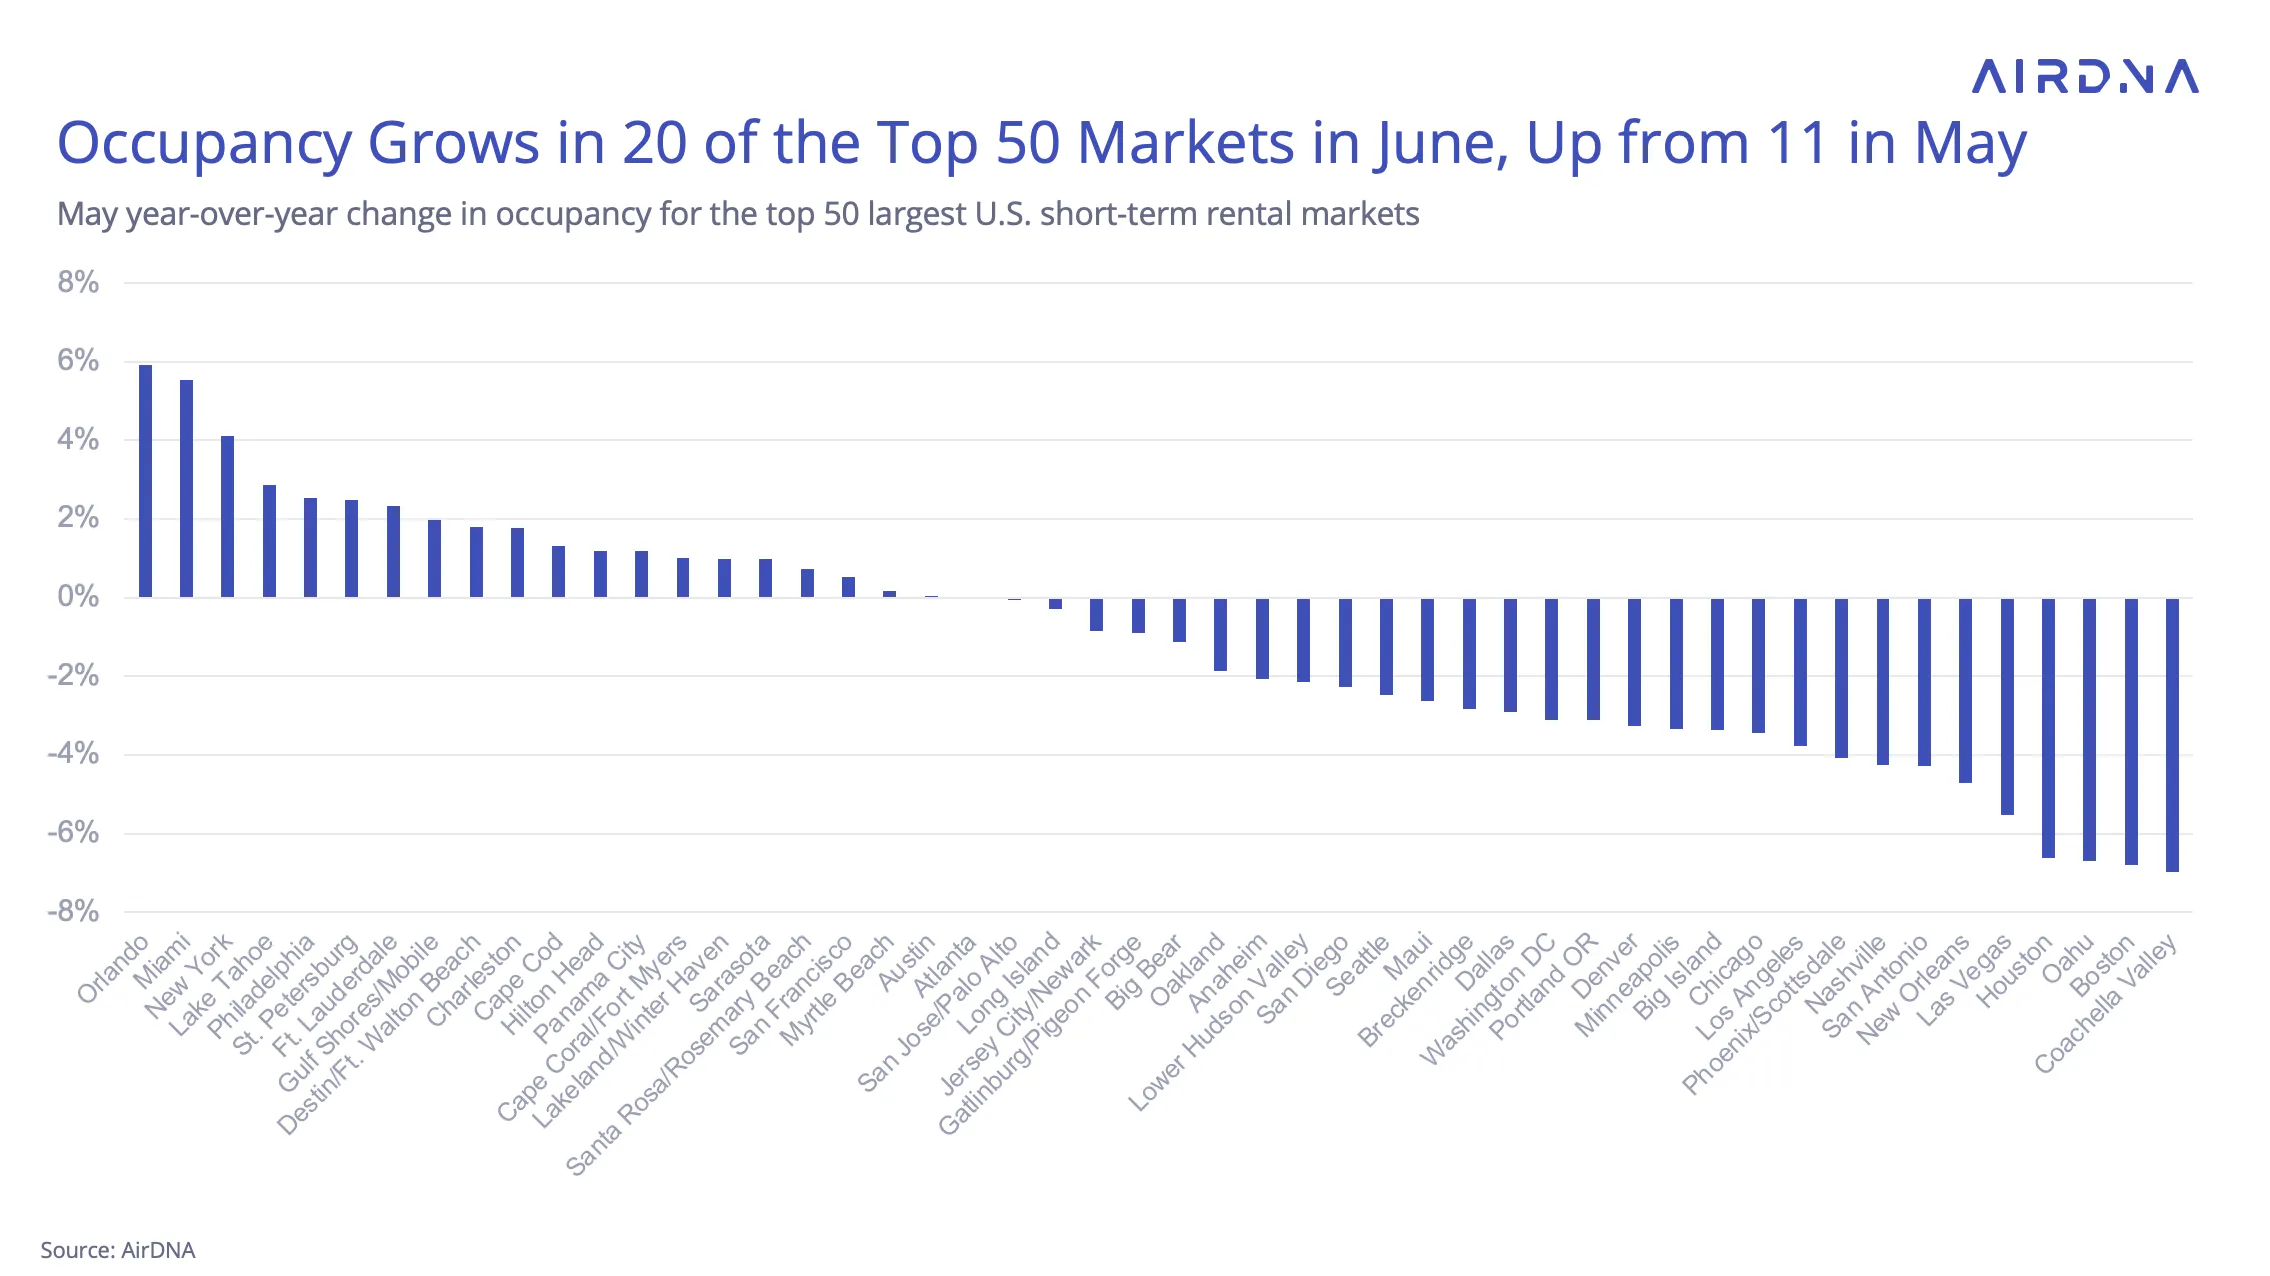
Examining June occupancy changes in the top 50 markets reveals that many Coastal resorts posted year-over-year gains. Twenty markets increased occupancy, including:
- Miami, Florida (+5.5%)
- St. Petersburg, Florida (+2.5%)
- Ft. Lauderdale, Florida (+2.3%)
At the same time, several Large City Urban markets without beaches also saw occupancy improvements:
- Orlando (+5.9%)
- New York City (+4.1%)
- Philadelphia (+2.5%)
Although New York now has very few true short-term rentals due to strong regulation enforcement, it still houses the largest collection of medium-term stays of any U.S. rental market.
Nightly Rates Accelerate for the Third Consecutive Month
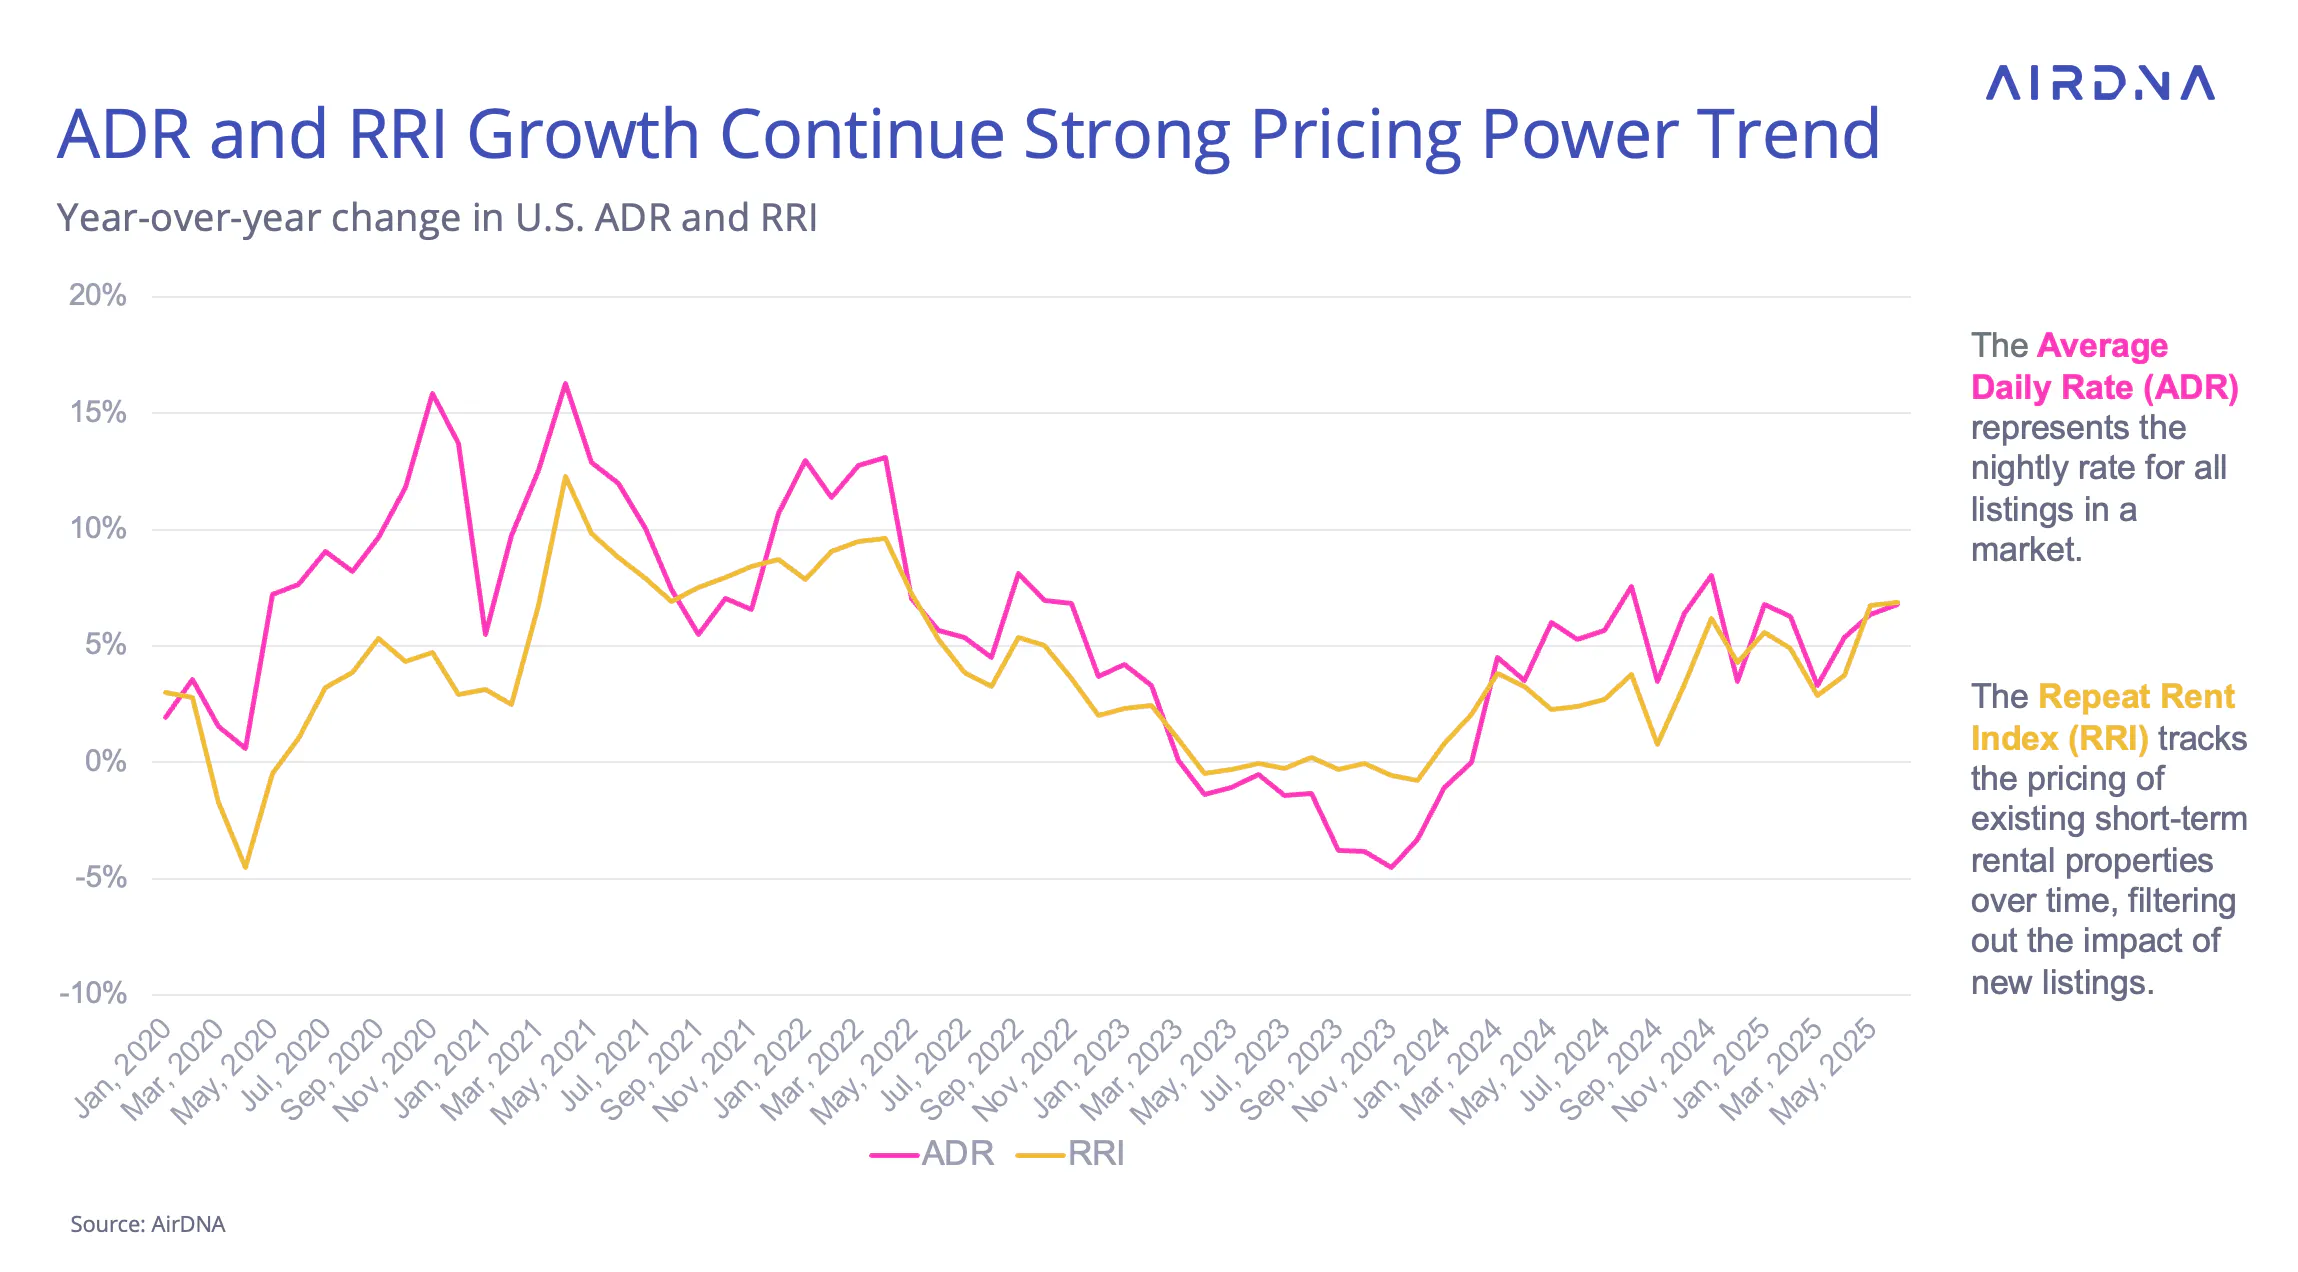
Average daily rate (ADR) growth continued its streak in June with a hefty +6.8% year-over-year increase, well in excess of the inflation rate. The AirDNA Repeat Rent Index (RRI), which tracks rate changes for existing listings only, increased by a nearly identical 6.9%. This suggests that new listings were priced in line with existing inventory, on average.
June marked the third consecutive month of month-over-month ADR acceleration and the 16th straight month of positive ADR growth. Despite a slight dip in June occupancy, strong pricing power helped maintain a healthy RevPAR growth rate (+5.5%).
Lower-priced listings drive rate growth
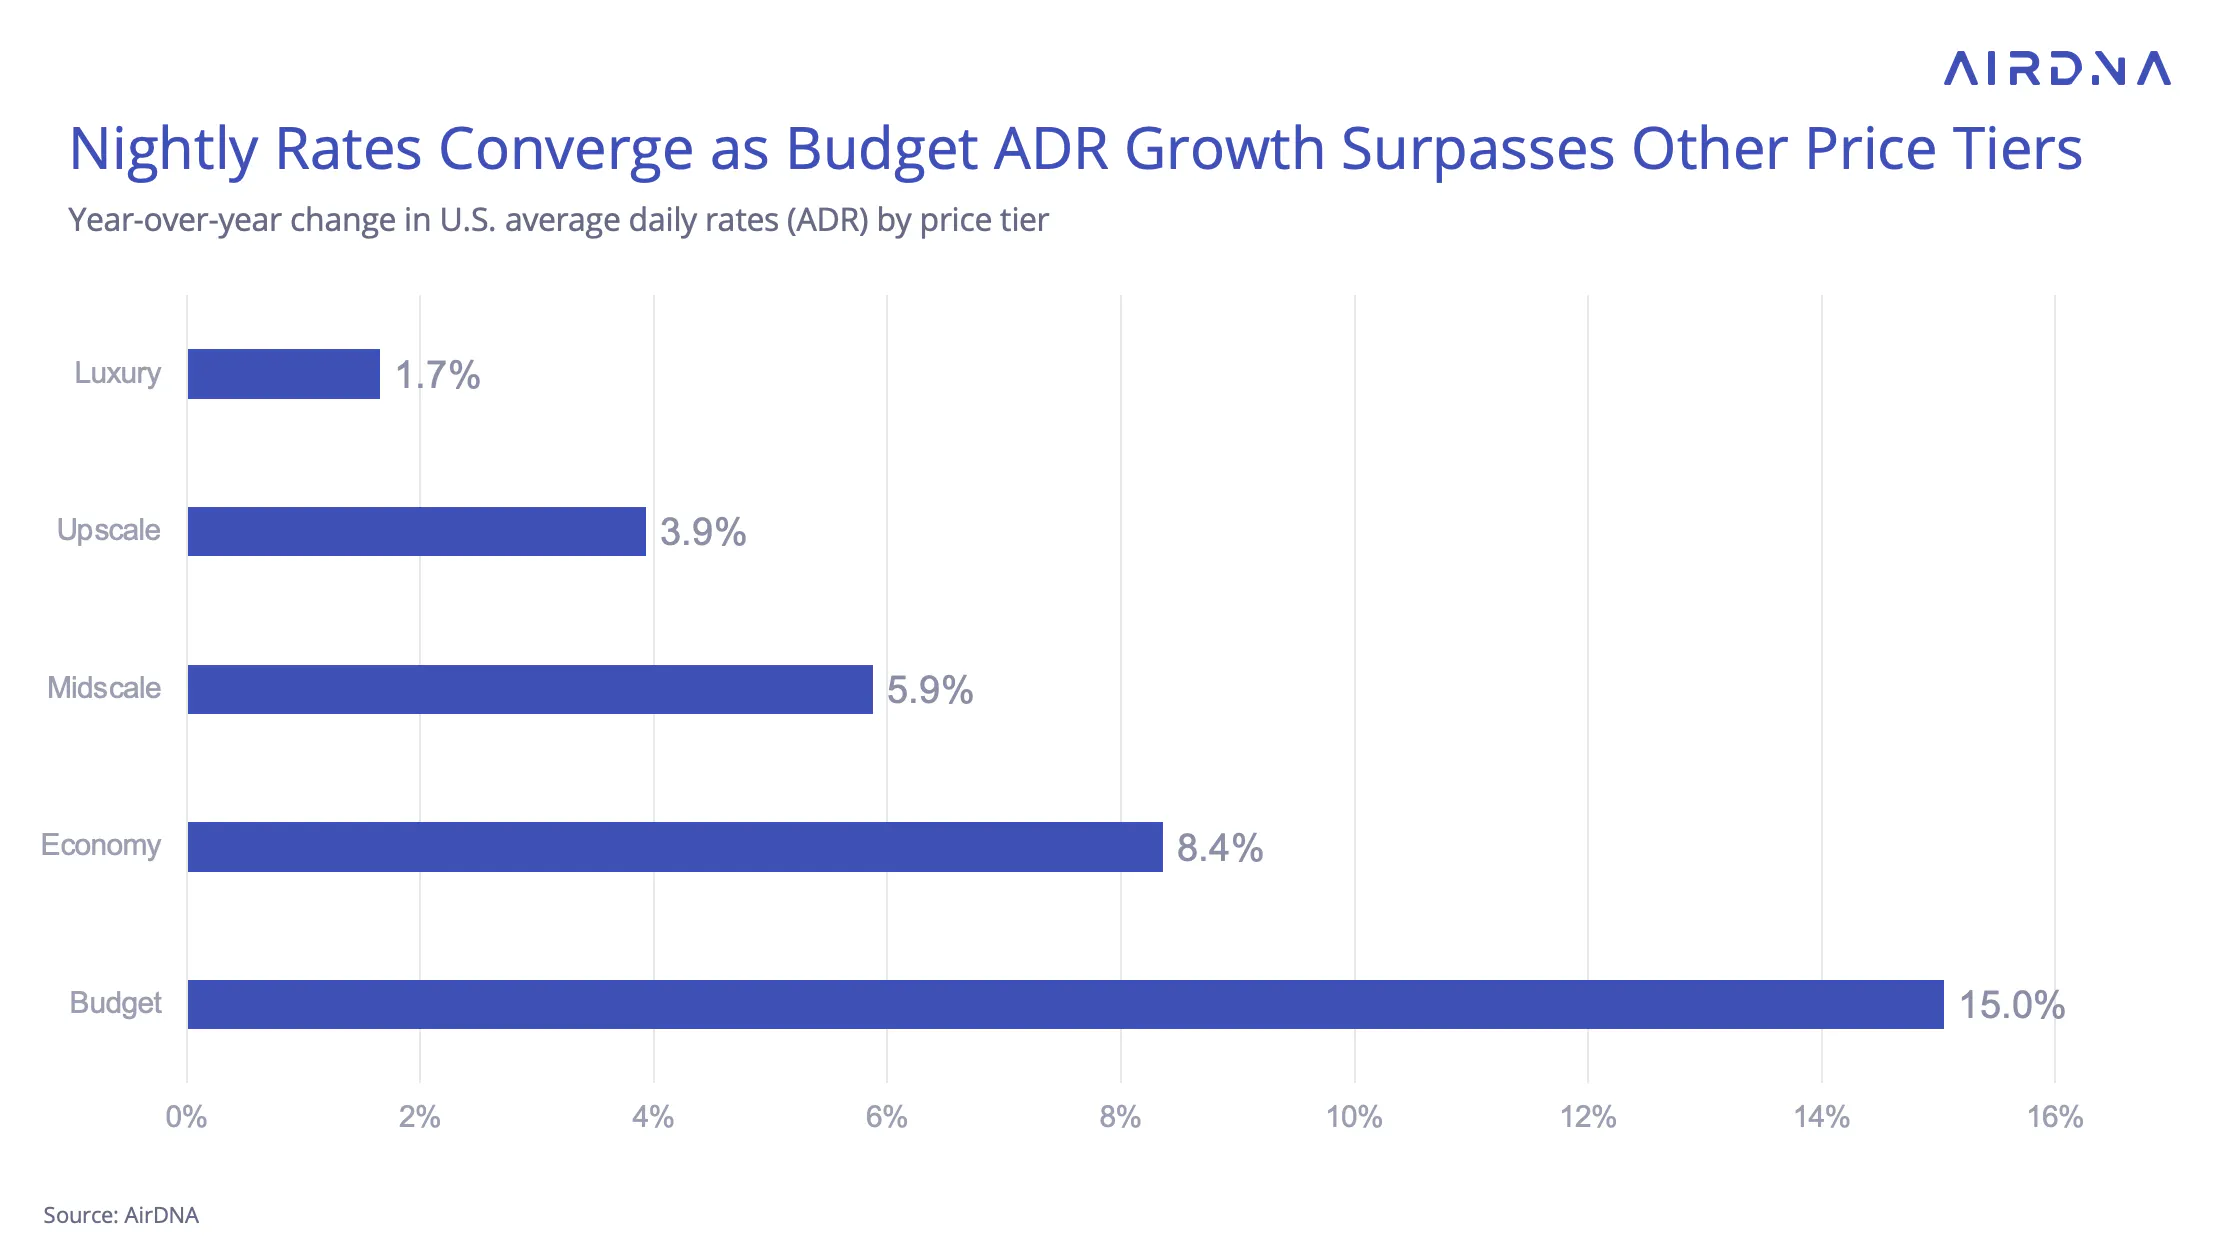
June rate growth narrowed the pricing gap between price tiers. Price convergence, when nightly rates approach each other, is when lower price tiers experience higher ADR growth on a percentage basis than higher tiers. June was a textbook example. Luxury listings increased their ADR by 1.7% YOY, while budget listings increased prices by nearly ten times as much at 15.0% YOY.
This convergence may reflect rising interest in more affordable travel amid economic uncertainty. AirDNA has also been closely watching the rise in last-minute bookings, which is most pronounced among budget listings. While luxury properties have also seen more last-minute bookings, they’ve simultaneously experienced growth in early bookings. It may be that operators are adapting their pricing strategies to meet evolving guest preferences, particularly at the lower end of the market.
How Pacing Data Can Mislead in a Last-Minute Booking World
Pacing data tracks the number of short-term rental reservations on the books for a future date, compared to the same point in time the previous year. Changing consumer behavior, particularly the surge in last-minute bookings, has clouded what demand and occupancy pacing data can tell us about actual future performance.
Take June as an example. If traveler behavior were consistent year to year, pacing data would reliably indicate what final demand would look like. In reality, three shifts in booking lead time behavior have disrupted that consistency:
- A small increase in very early bookings (5+ months out)
- A decline in mid-range bookings (1–4 months out)
- A surge in last-minute bookings (within a few weeks of check-in)
Back in December 2024, pacing data for June 2025 looked strong due to more early bookings. A lack of mid-range bookings made by spring 2025, however, caused June pacing to look weaker. Our pacing prediction began to take on a pessimistic view and operators worried that their rentals would remain empty. As June approached, a wave of last-minute bookings came through and pushed our prediction towards the true demand value.
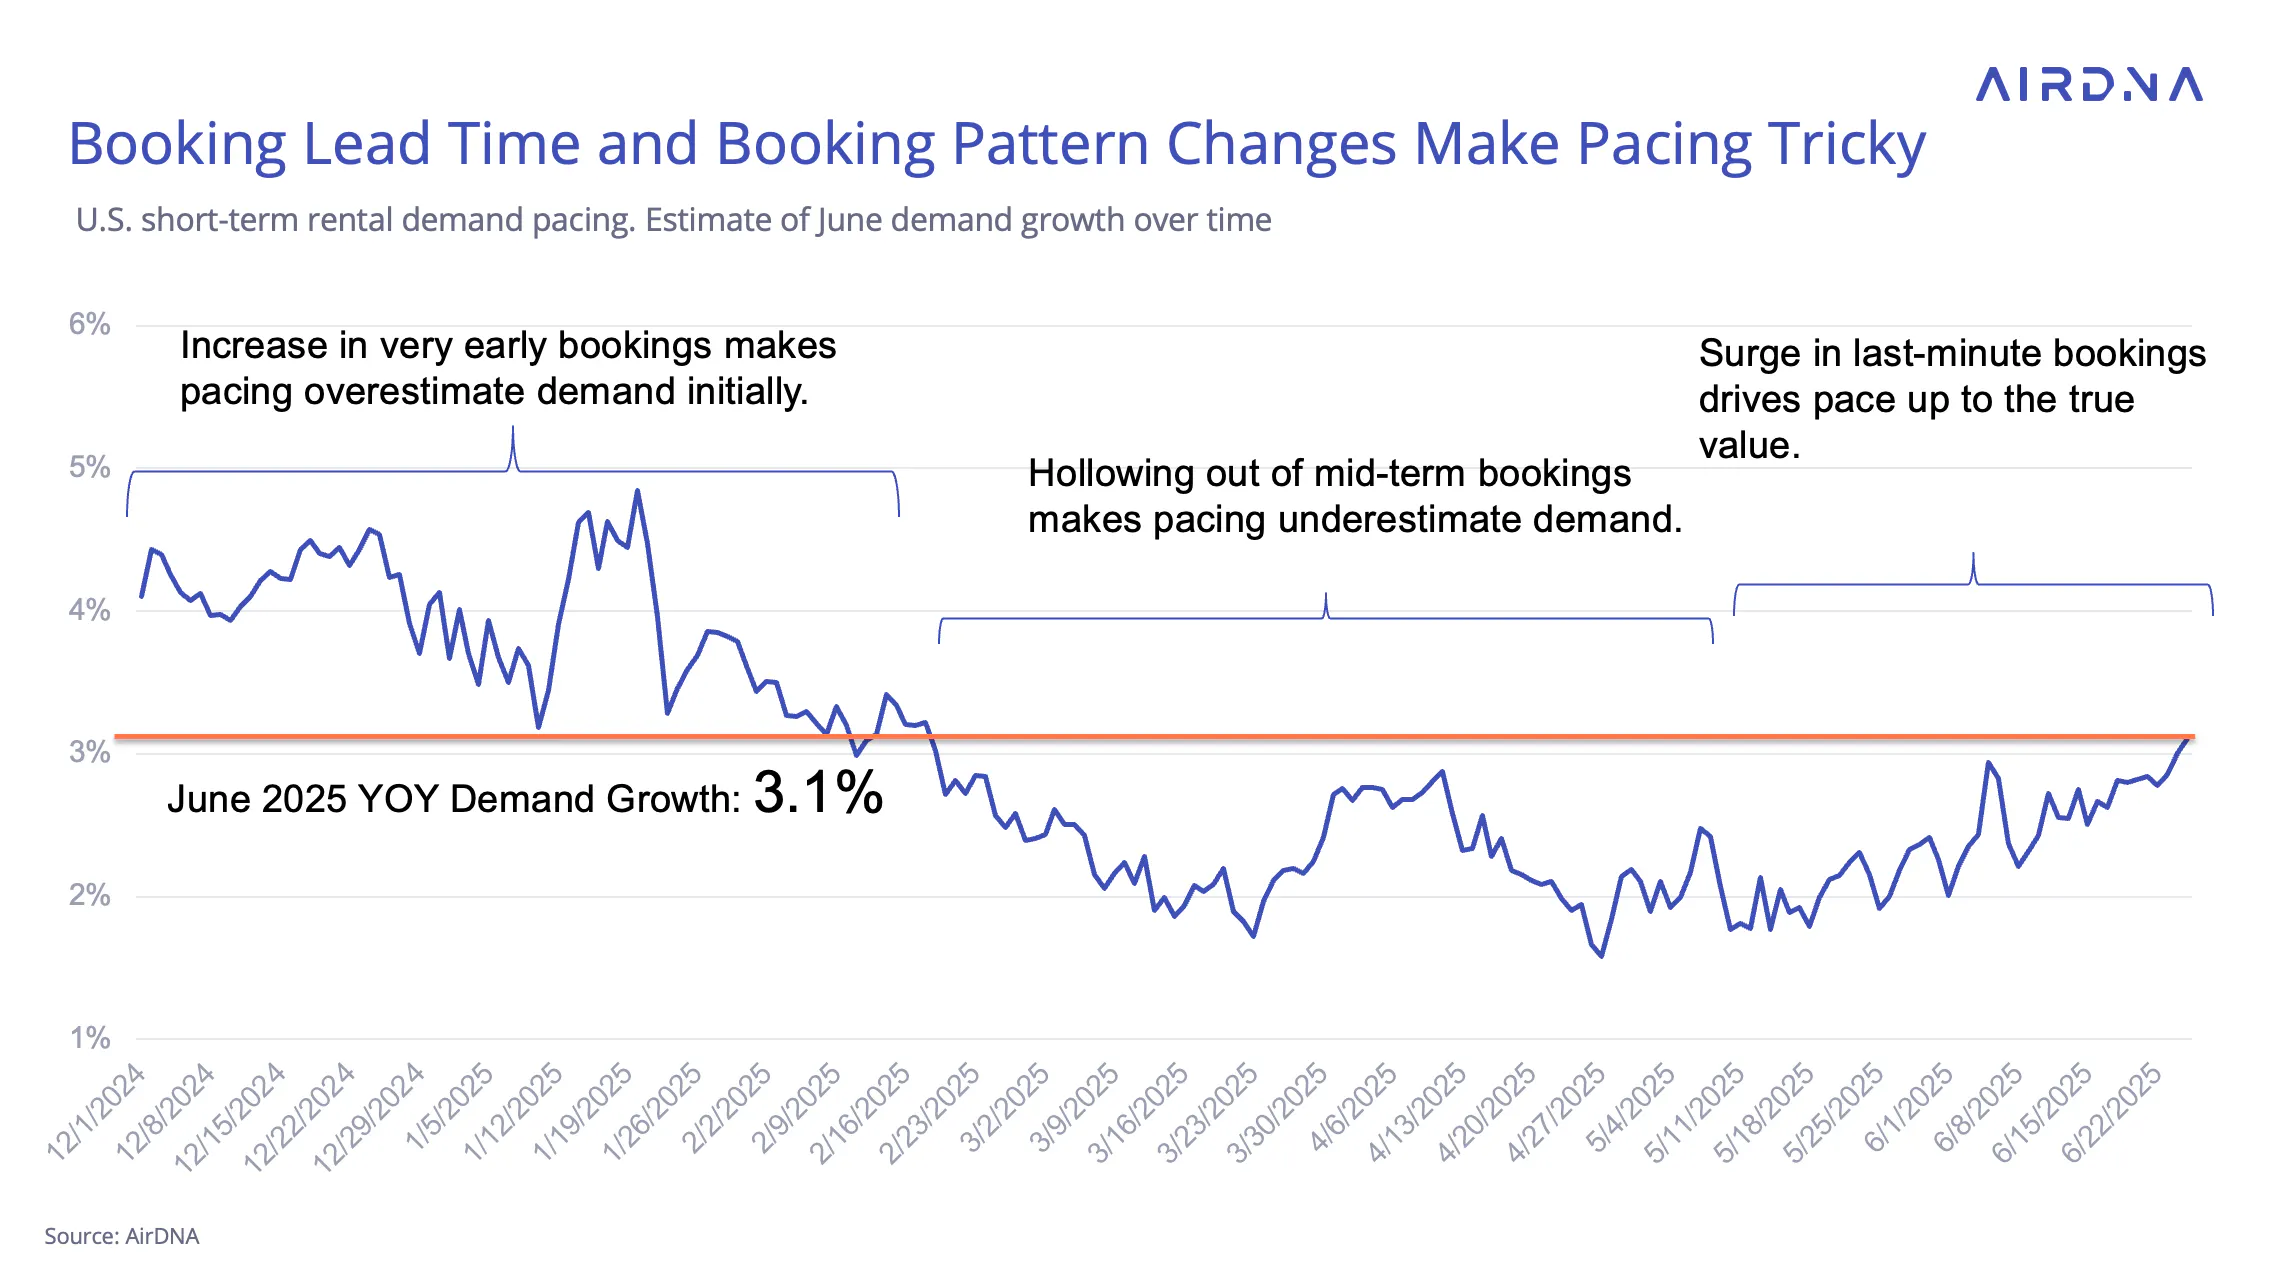
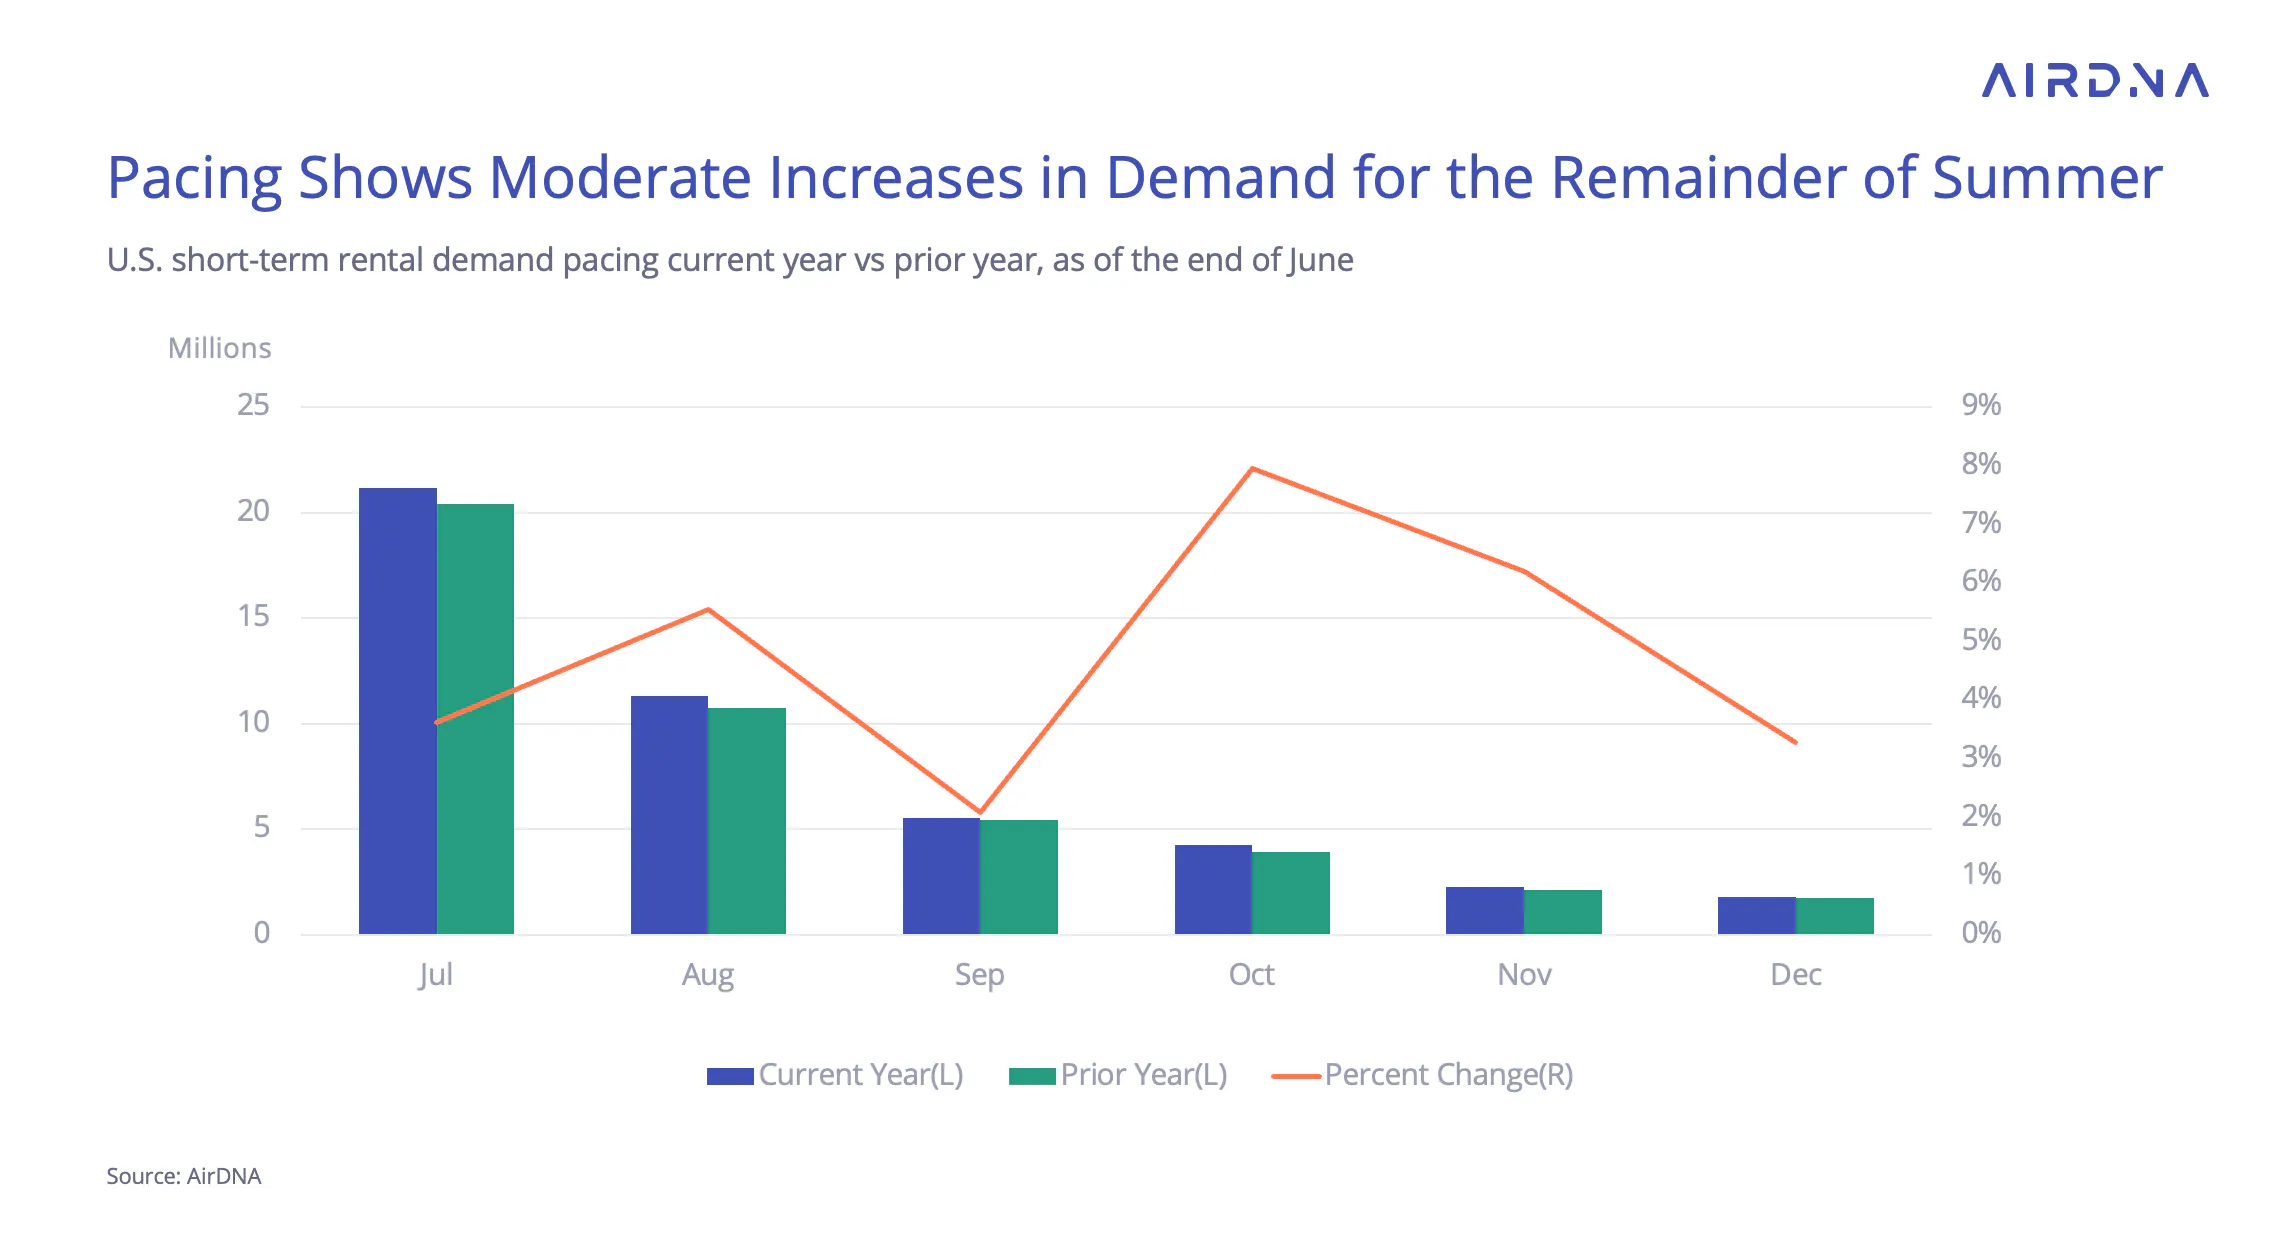
We usually assume that our demand predictions will become more accurate as we get closer to the dates in question. In this case, our ability to predict June’s performance actually got worse as we moved closer to the month until about 30 days out, when last-minute bookings started filling in the gaps. This pattern suggests that the current moderate pacing data for the rest of summer and early fall may be understating true demand. In a world where booking windows are shrinking, relying too heavily on pacing without accounting for booking trends can lead to premature conclusions and missed opportunities.
ARTICLE SUMMARY
June 2025 saw a record number of available short-term rental listings in the U.S., signaling renewed investor interest as pricing power remains strong. While demand growth softened slightly and occupancy dipped, rising ADR and a rebound in new listings point to a market regaining momentum. Shifting consumer behavior—especially a rise in last-minute bookings—is reshaping how we interpret pacing data and forecast future demand.
Bram Gallagher
AirDNA Director of Economics and Forecasting
Bram Gallagher is an Economist at AirDNA, specializing in uncovering insights that drive smarter short-term rental decisions. He put his Ph.D. in Economics from the University of Georgia to work researching and forecasting hotel data with CBRE prior to joining AirDNA, as well as teaching economics at a number of universities. In his spare time, Bram enjoys making wooden furniture with hand tools.


