

 Calculate Revenue
 Research Markets
 Find For Sale Properties
 Compare My Listing
 STR Revenue Calculator
 Custom Comp Sets
 Submarket Insights
 Custom Search Filters
 Rate Recommendations
 Performance Benchmarking
 Competitor Comparison
 Owner Contact Details
 Property-level performance data
 Tourism Insights
 Real Estate Investment Analytics
 About Us
 Sales
Sales Support
 Press
PressU.S. Review September 2024: Demand Gains and Pricing Power Persist Amid Occupancy Challenges
Published: October 21, 2024
Last updated: February 26, 2025

Bram Gallagher
Key Takeaways
- September saw slower demand growth, partly due to a Labor Day calendar shift, but consistent summer performance balanced out occupancy declines.
- Small City/Rural markets continued to perform well, while Urban and Mountain/Lake markets faced demand drops due to regulatory and economic challenges.
- Demand pacing for the upcoming fall and holiday season remains strong, with November and December showing strong demand growth nationwide.
Employment and Inflation’s Impact
The elusive “economic unicorn” seems to have finally been spotted, with both the inflation rate (as measured by the Consumer Price Index, or CPI) and the unemployment rate falling for the past two months.
In September, inflation was at 2.4%, down from 2.6% in August, while the unemployment rate dropped to 4.1% from 4.2%, according to the Bureau of Labor Statistics (BLS). This brings inflation close to the Fed’s 2.0% target, while employment remains essentially “full”—the outcome the Fed had hoped for when it began lowering rates in August after the fastest interest rate hike in U.S. history.

The strong labor market, which added 254,000 new jobs in September, supports the prediction that interest rates will be lowered more gradually than they were raised. These rates not only impact mortgage rates and residential construction, but also influence business investment and spending in general. A gradual tapering of rates is expected to prevent the economy from over-expanding and generating further inflation.
The gradual lowering of interest rates allows markets to anticipate positive developments over a longer period. With real incomes stabilizing after the high inflation of 2022 and 2023, consumers are feeling more optimistic about their financial future. These factors contribute to the ability and willingness of American consumers to travel.
At a Glance: Key U.S. STR Performance Metrics for September 2024
- Revenue per Available Rental (RevPAR) declined 1.6% year-over-year (YOY) to $146.09.
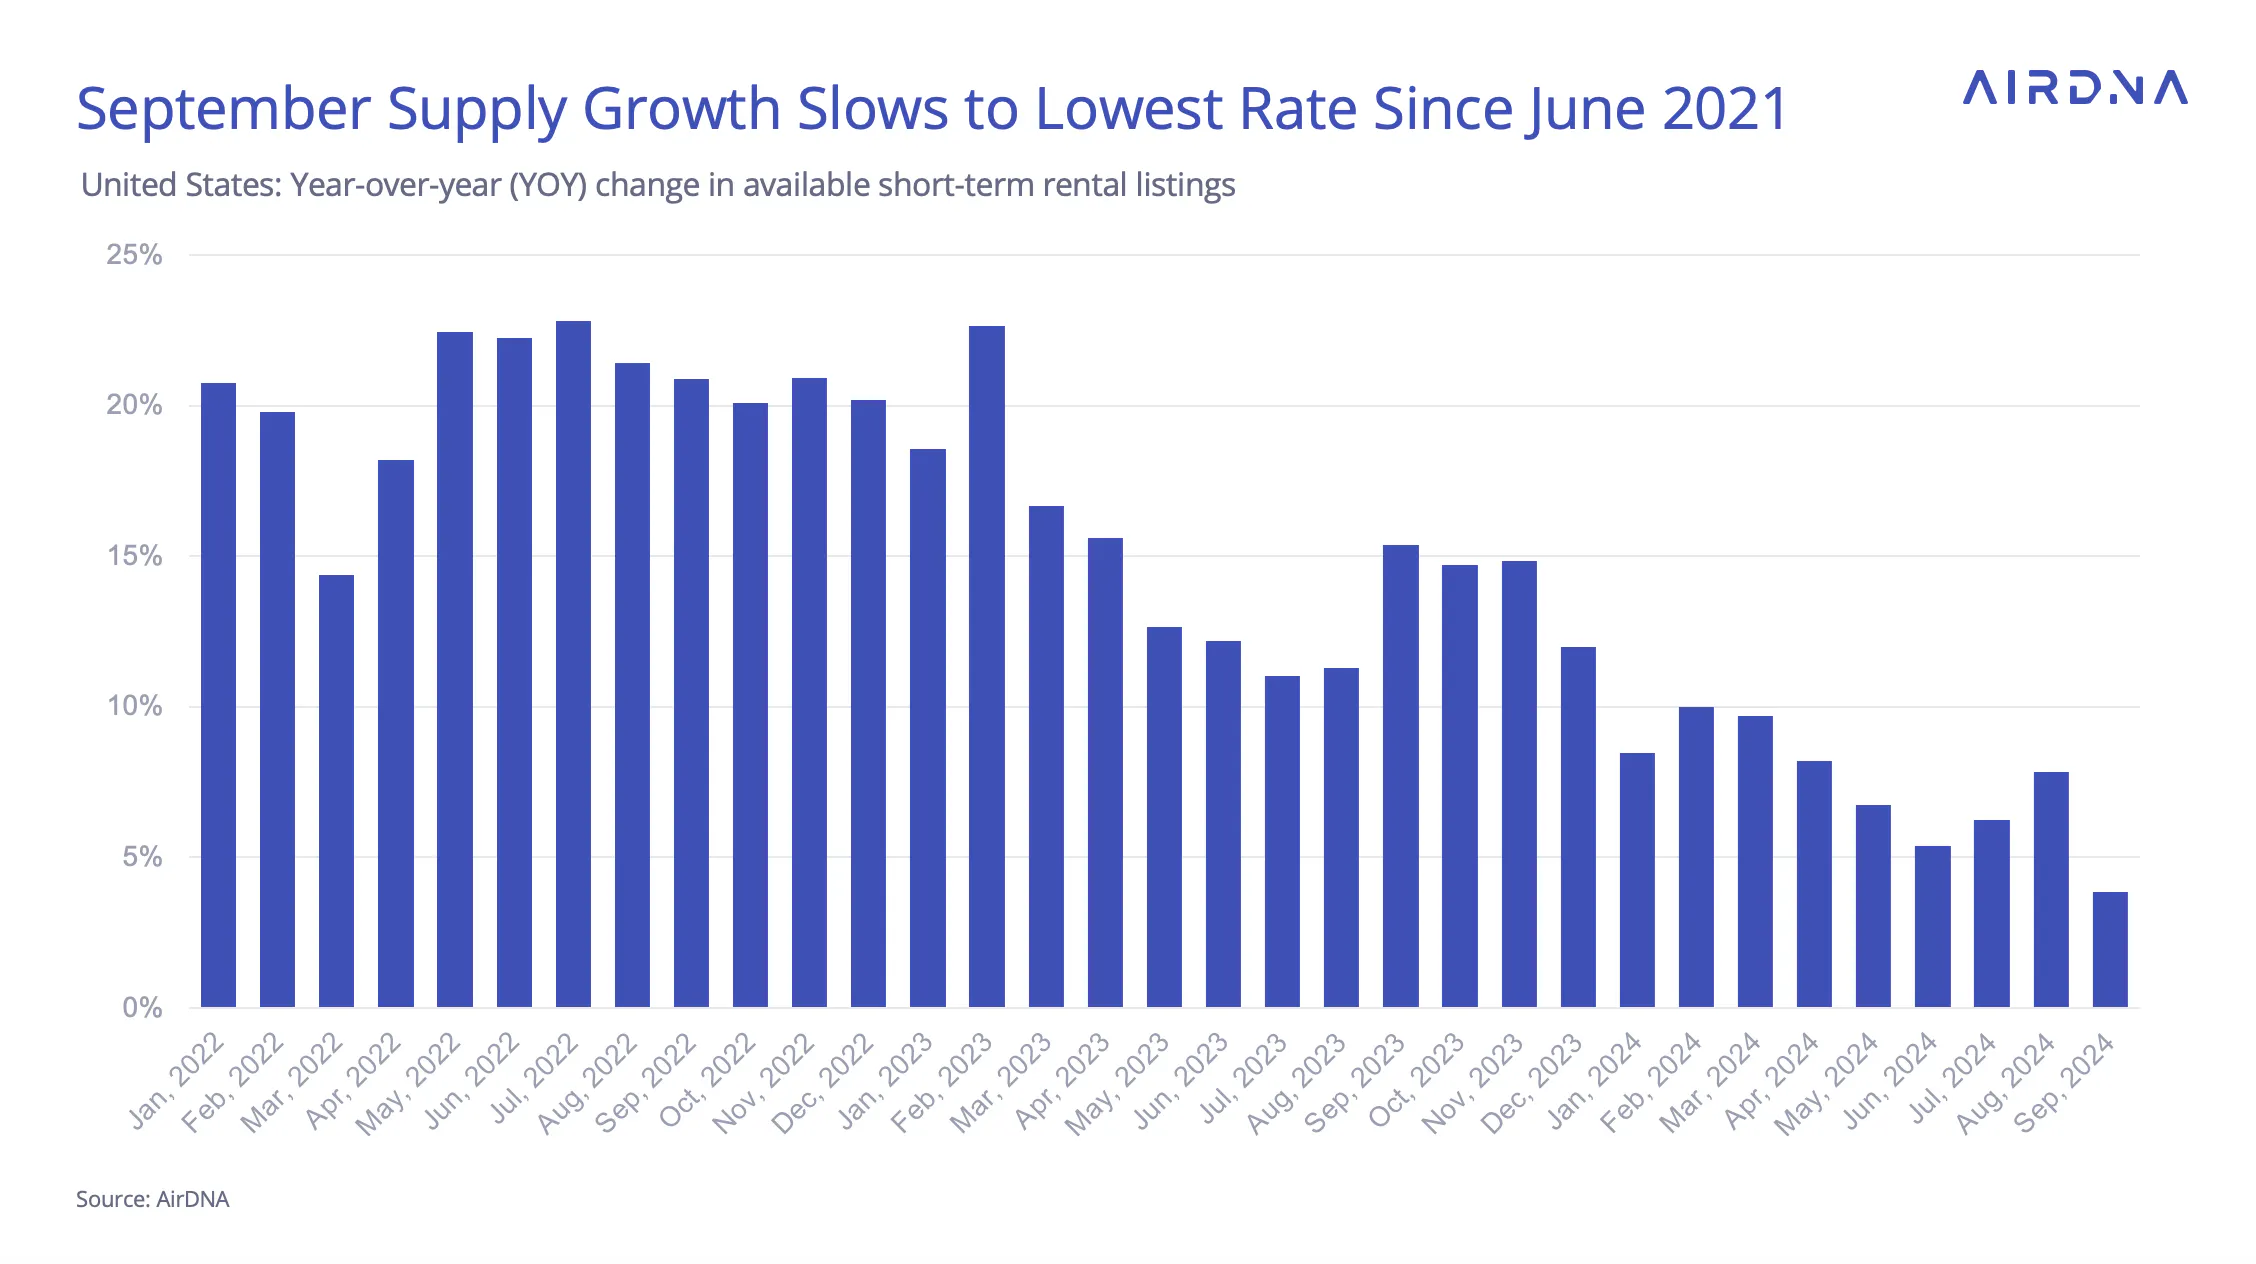
- Available listings were 1.73 million, up 3.9% YOY
- Total demand (nights) rose 2.3% YOY
- Occupancy was -4.0% lower YOY at 49.8%
- Average Daily Rates (ADR) increased 2.7% YOY to $293.60
- Repeat Rent Index (RRI) increased by 0.6% YOY
- Nights booked increased by 2.9% YOY
Listing Growth Accelerates Slightly Even as New Listings Tank
The summer surge in supply came to an end in September, which recorded the lowest growth rate for available listings since the early days of the pandemic recovery. While listing growth picked up in July and August, the overall trend has been a clear decline since the highs of 2022. High interest rates, stubbornly high housing prices, and weaker unit-level performance have all contributed to the slowdown in supply growth.
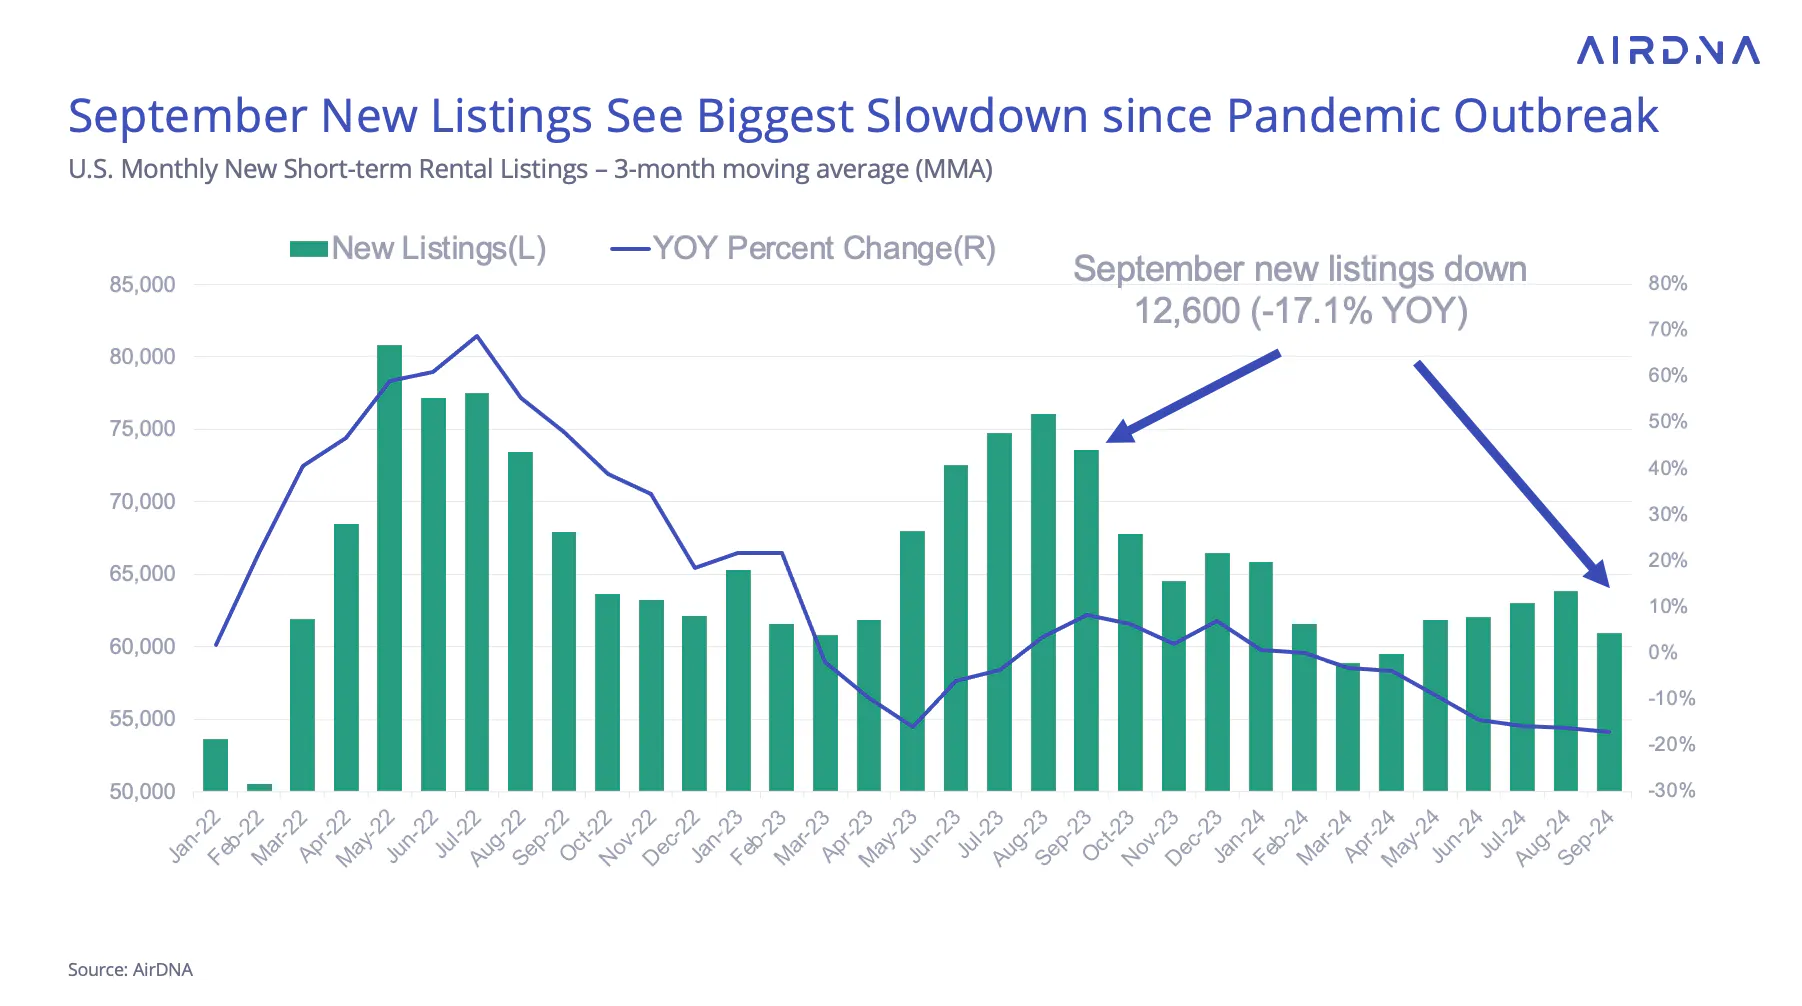
The challenge of securing new rental homes is evident in the decline of new listings, defined as those never appearing in our data before September. These listings dropped by 17.1% compared to September 2023, marking the seventh consecutive month of year-over-year (YOY) declines and the largest single-month percentage drop since October 2020.
Calendar Shift Paints a Worse Picture than Reality
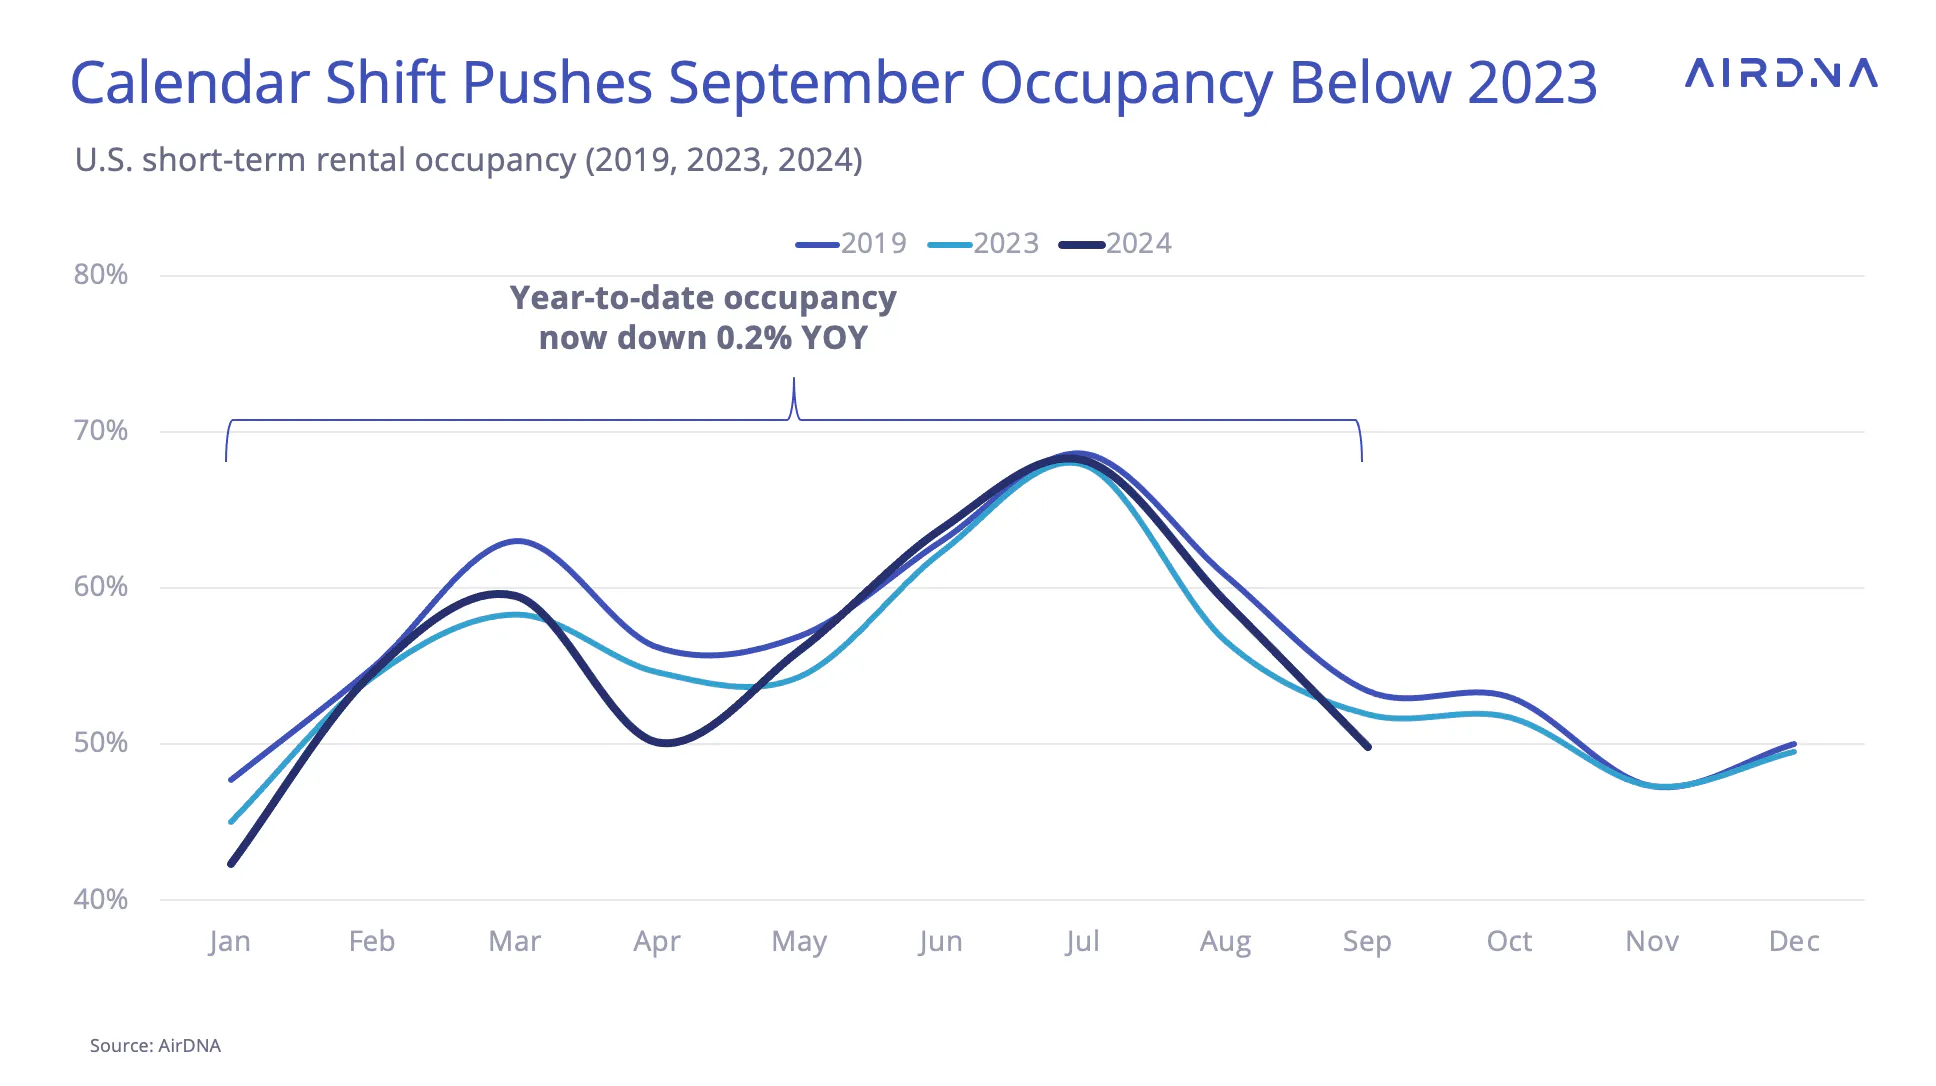
Labor Day shifted from September 4th in 2023 to September 2nd in 2024. This seemingly small change moved two days of the Labor Day weekend from September to August, resulting in substantial impacts on monthly demand growth. August was very strong, with 12.0% year-over-year (YOY) demand growth, while September experienced weak 2.3% YOY demand growth.
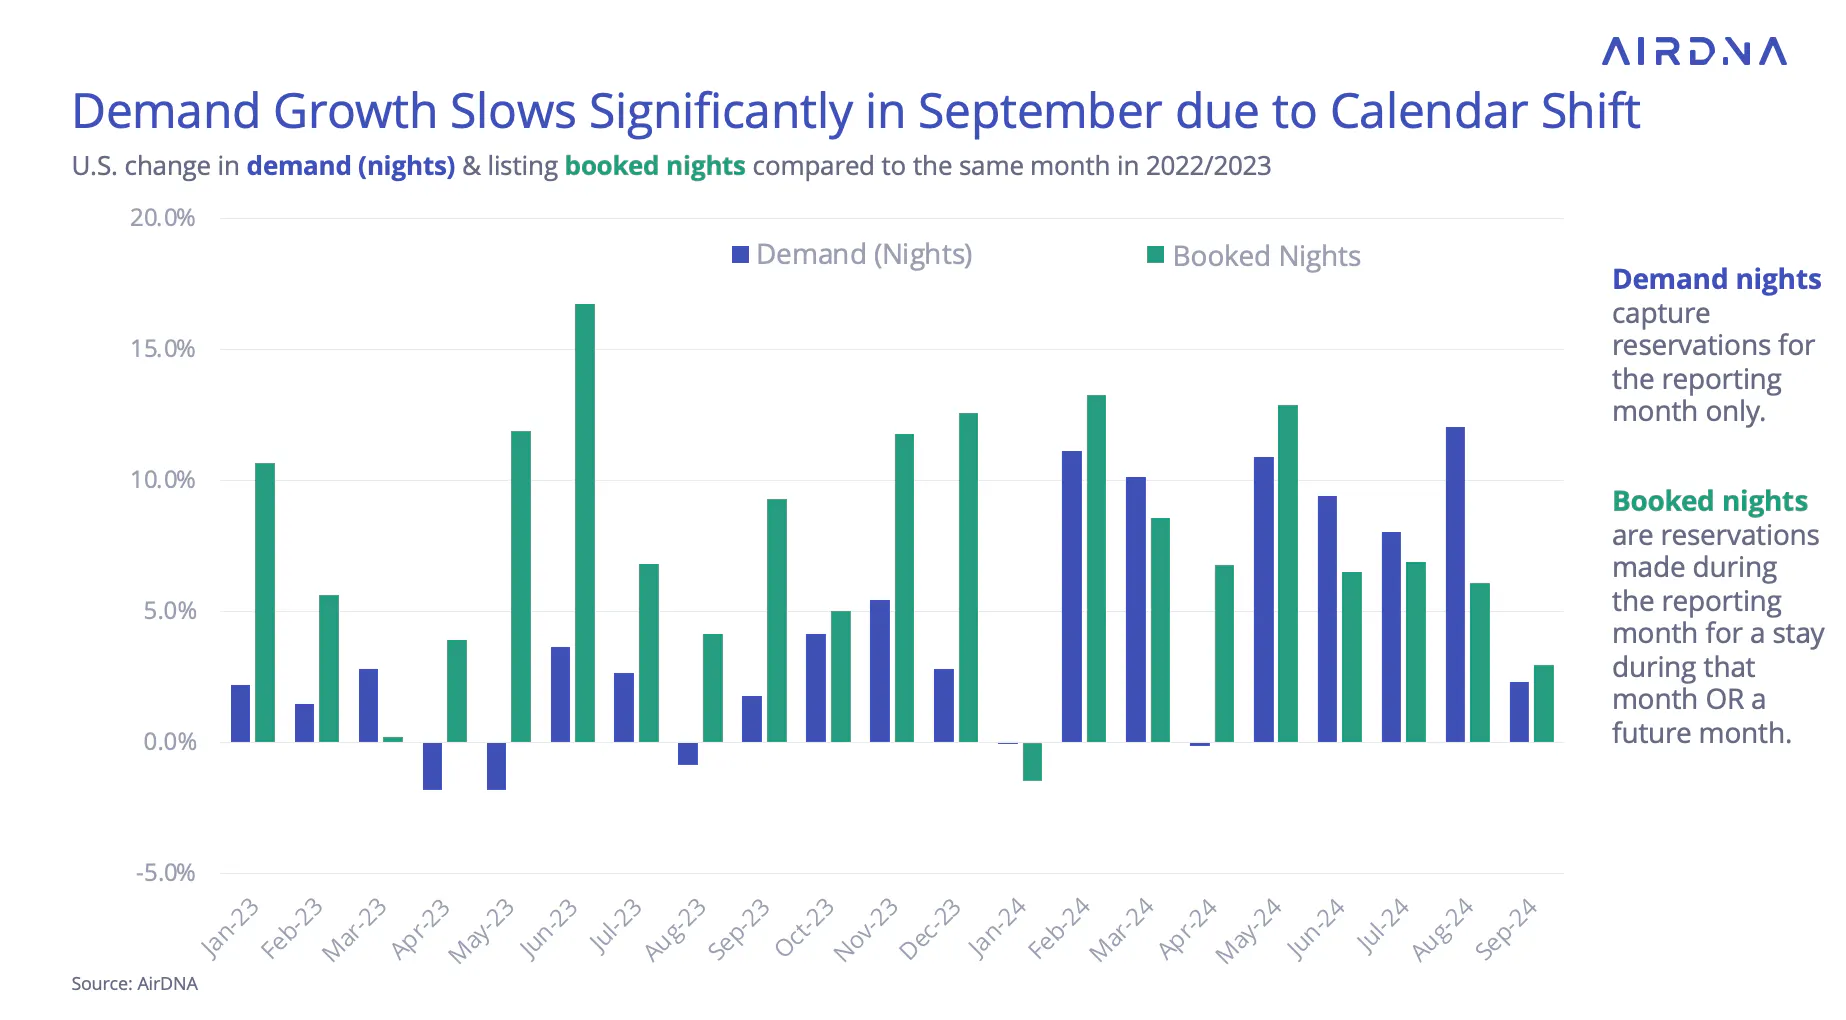
While the monthly data shows a dramatic difference, the weekly data presents a more consistent growth trend throughout the summer, including September. Excluding the Labor Day weekend, the four weeks leading up to it (primarily August) saw demand grow by 10.1%. The four weeks following Labor Day (primarily September) grew at a slower but still comparable rate of 7.1%.
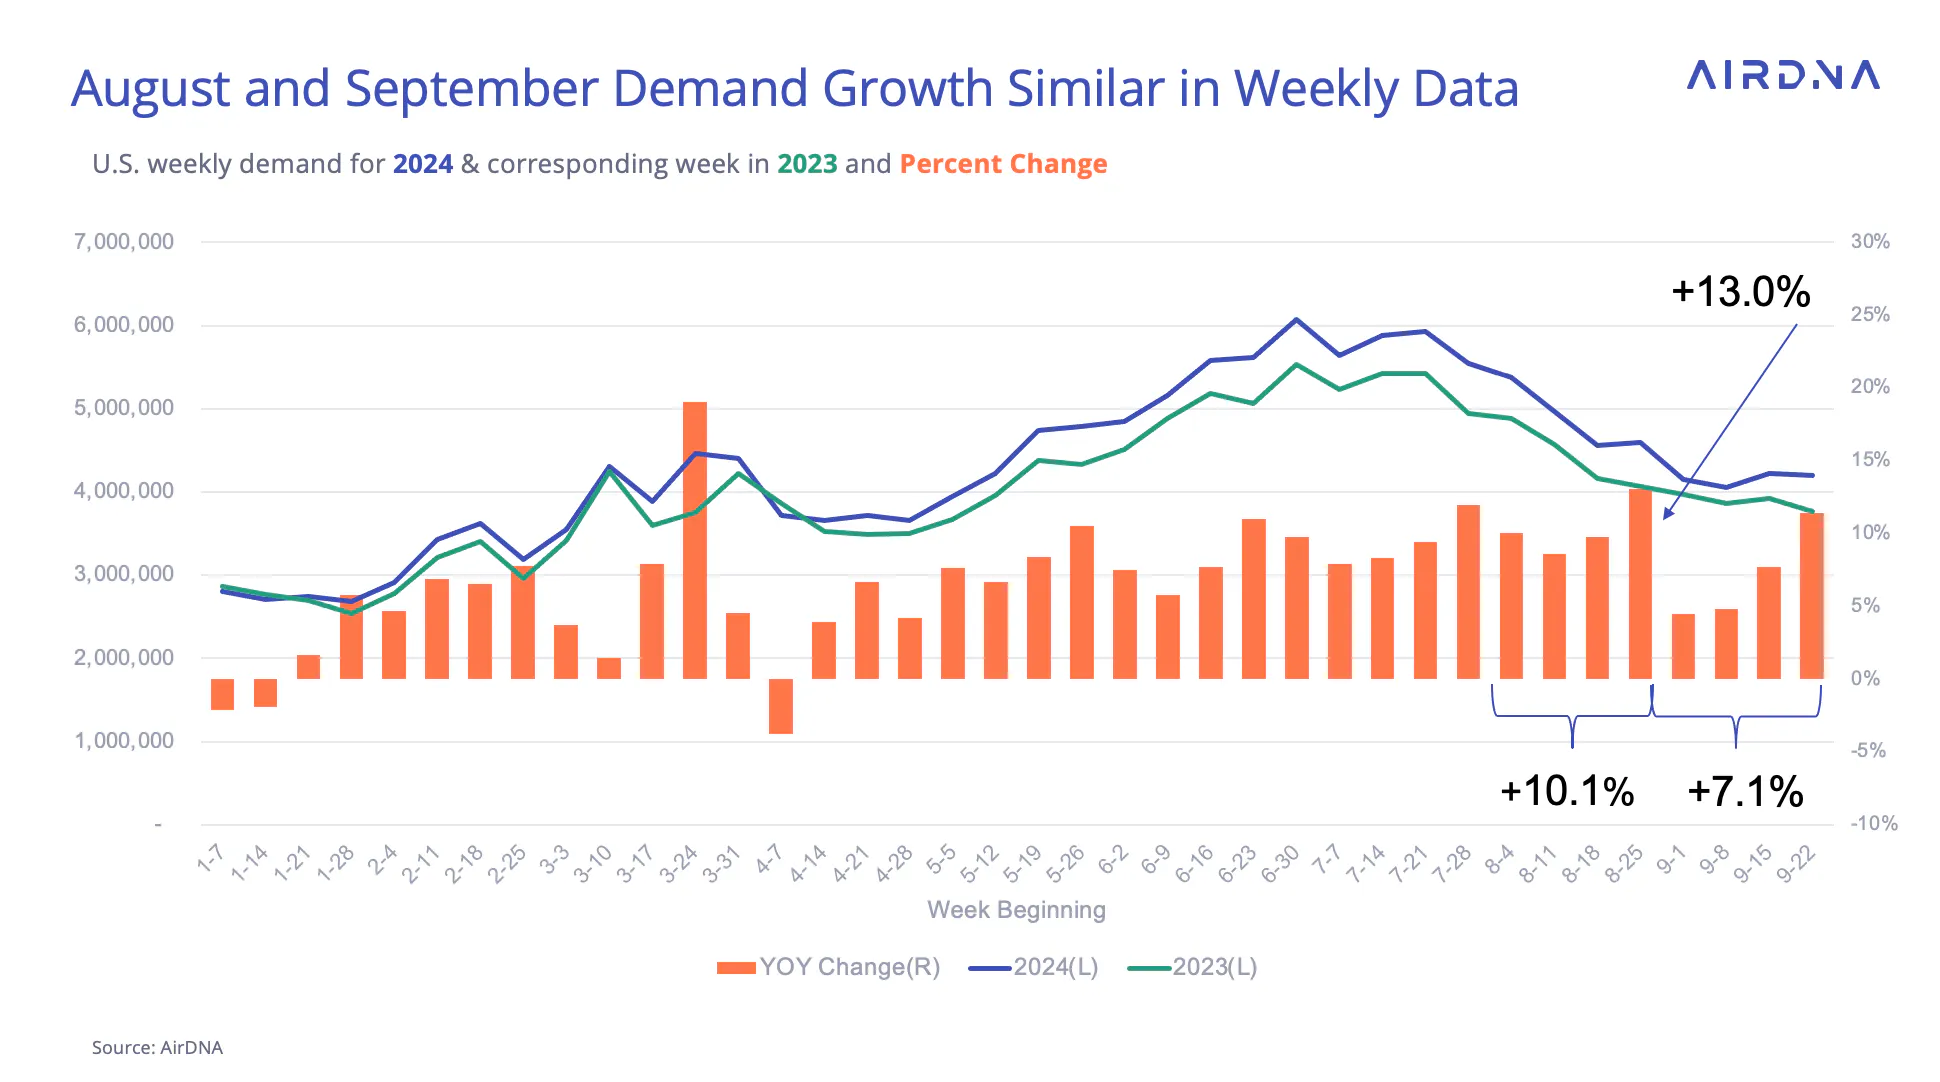
Regardless of how the data is aggregated, September’s demand growth couldn’t quite keep up with supply growth. This caused a drop in occupancy for both September and the year-to-date, in comparison to 2023 levels. September occupancy was down 4.0% YOY. While year-to-date occupancy had managed a slight +0.2% growth by August, it’s now slightly below 2023 levels at -0.2% YOY through September.
For operators looking to fill their rentals, this small fluctuation around 2023’s occupancy level is still better than the steep declines seen in 2022 and 2023, when a flood of new supply entered the market after the strong post-COVID rental boom.
Hosts Retain Pricing Power Despite Slight Occupancy Dip
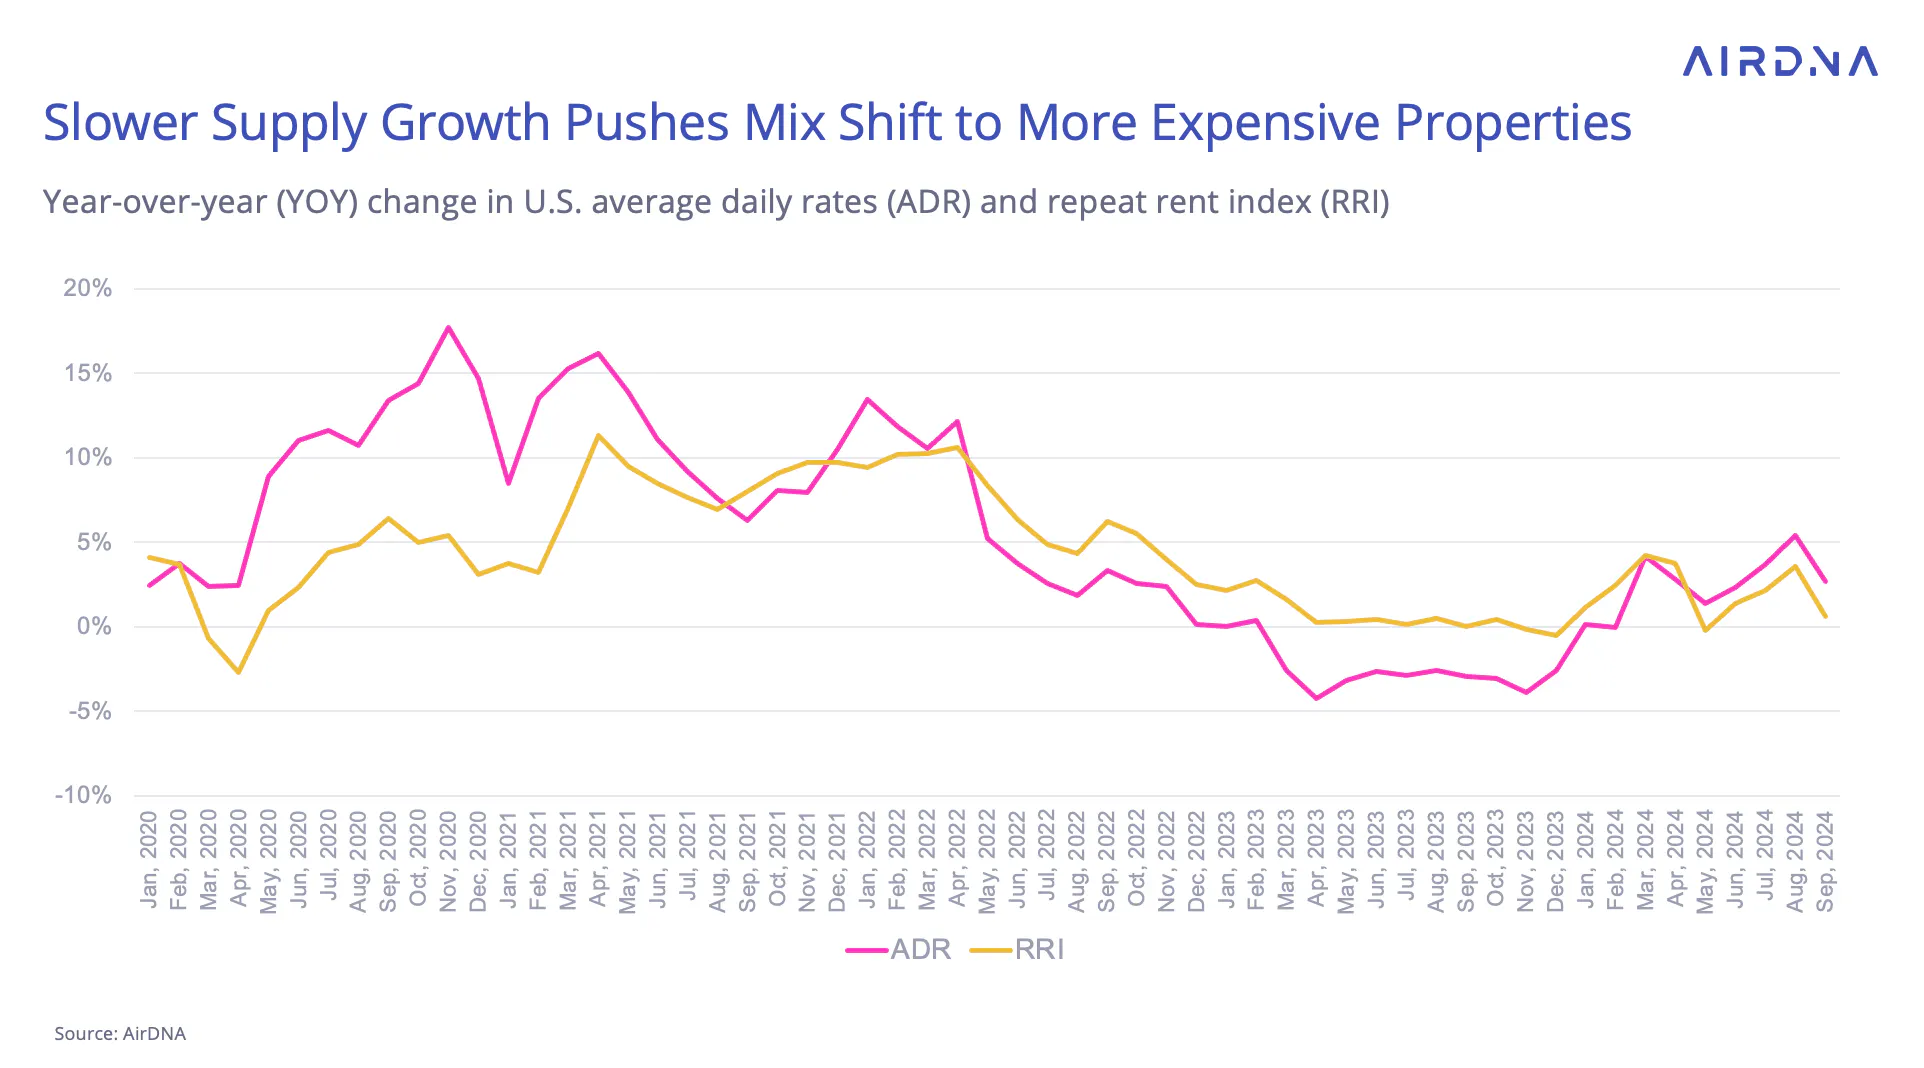
The 0.2% decline in occupancy was small enough to allow hosts to maintain significant pricing power throughout the summer. The U.S. STR market saw its seventh consecutive month of ADR growth. Compared to 2023, when almost every month recorded notable rate declines, this year’s ADR increases appear large. However, the AirDNA Repeat Rent Index (RRI) reveals that 2023 wasn’t as bad for existing hosts as it seemed. Rather than lowering rates, many hosts simply maintained their prices.
This year’s ADR gains are partly due to a "mix shift" effect. As supply growth slowed and the economic outlook improved, the RRI, which tracks pricing for existing listings, initially grew faster than ADR. In simpler terms, new listings in 2023 were priced lower than existing ones, likely to compete or offer affordability. Now, RRI growth has slowed compared to ADR growth, indicating that new entrants are pricing their properties higher than the current market average.
Small City/Rural Areas Thrive as Urban and Mountain/Lake Markets Struggle
Throughout most of the year, Small City/Rural locations have consistently been the fastest-growing market type. Several ongoing trends have provided strong tailwinds for these areas: over-tourism in crowded destinations, high home prices and interest rates, and continued interest in outdoor recreation and experiential travel.
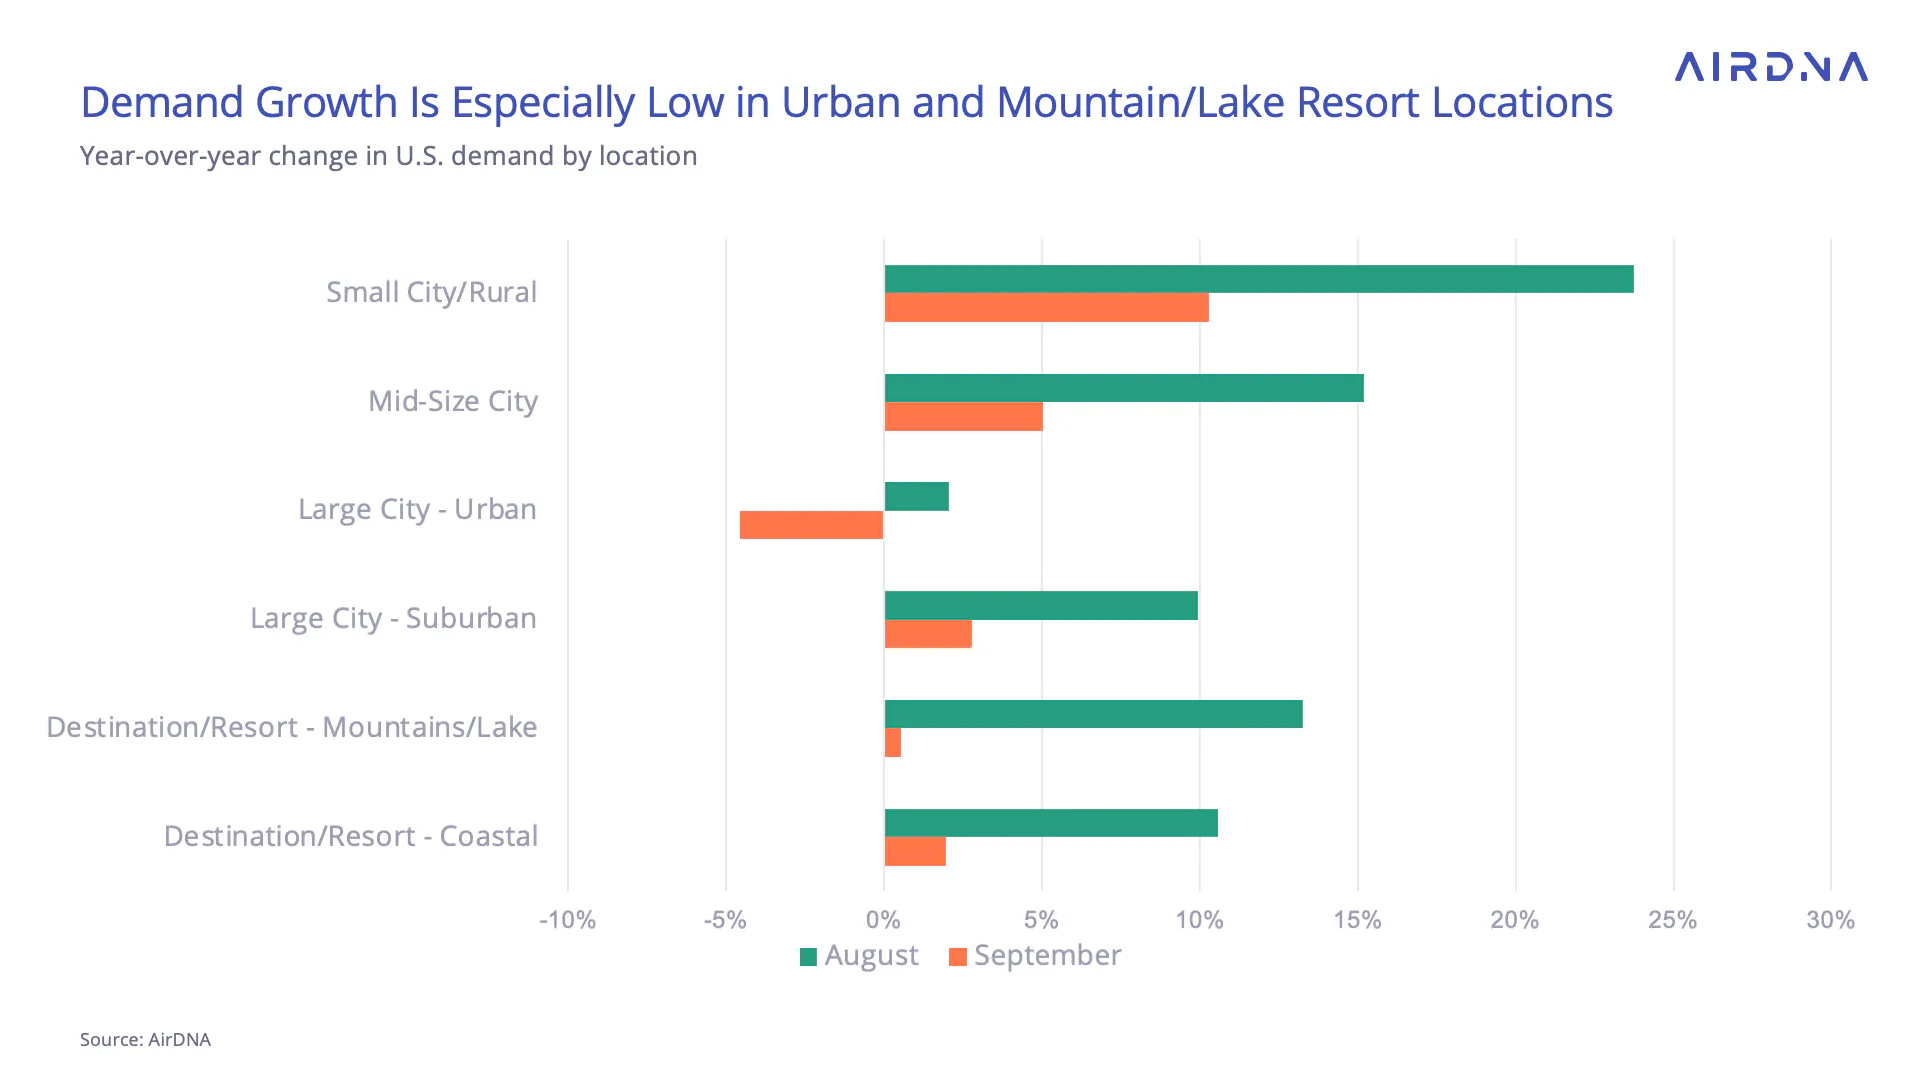
The lower cost of living and the variety of natural beauty in these remote places have certainly helped, and September was no exception. Despite the calendar shift and slower demand growth, Small City/Rural demand posted a strong 10.3% year-over-year (YOY) increase.
In contrast, both Urban locations and Mountain/Lake resorts experienced significant drops in demand. Urban locations are still feeling the effects of stricter regulations in places like New York, which has negatively impacted demand for several months. In September, Urban demand fell by 4.6%. Mountain/Lake resort locations saw an even more dramatic shift, with demand growth dropping from 13.2% in August to just 0.5% in September.
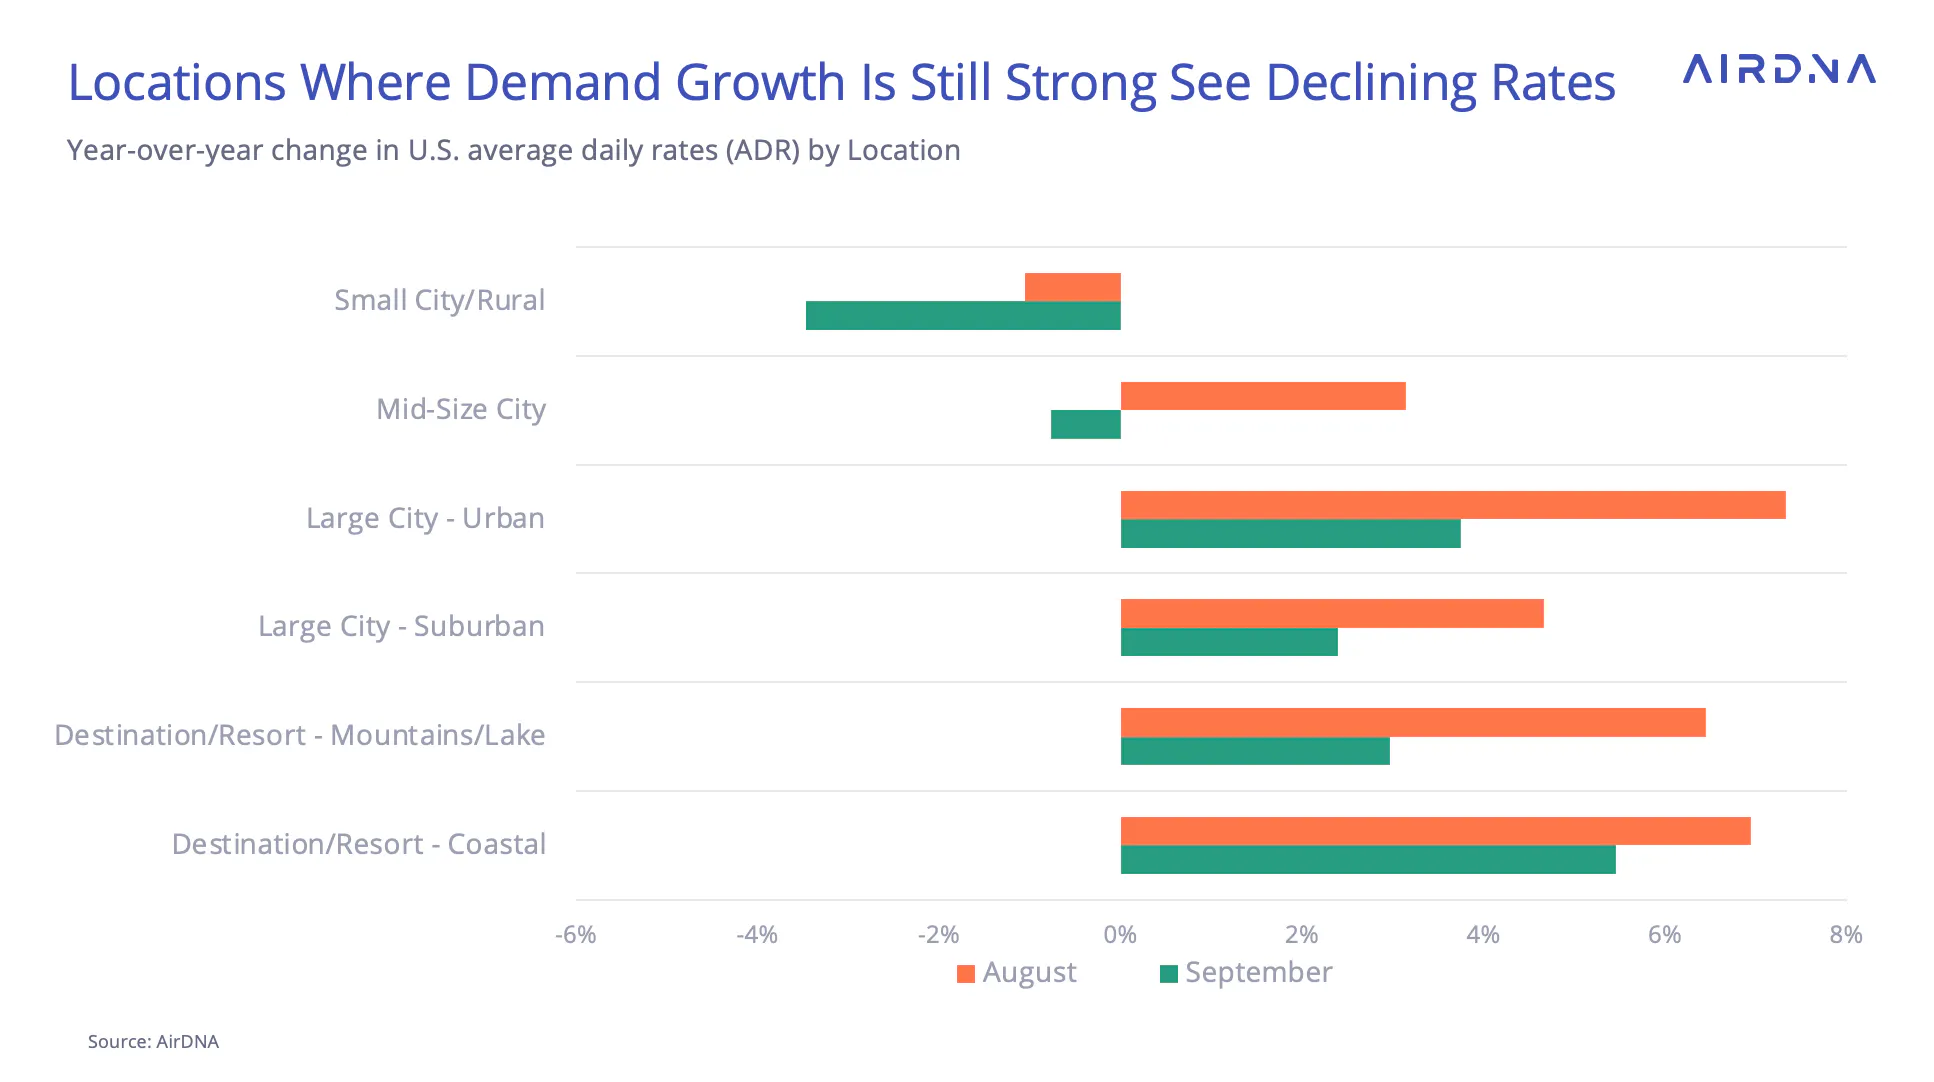
On the pricing side, locations with high demand growth—Small City/Rural and Mid-Size City markets—also saw declines in ADR. This is likely due to strategies aimed at boosting demand by lowering prices, as well as increased competition from aggressive supply growth in these areas over the past year.
One factor that didn’t contribute to falling ADRs was mix shift. The change in the Repeat Rent Index (RRI) in these locations was closely aligned with the ADR change, indicating that new listings in September were priced similarly to existing ones.
Strong Summer Demand Driven by Regional Performance
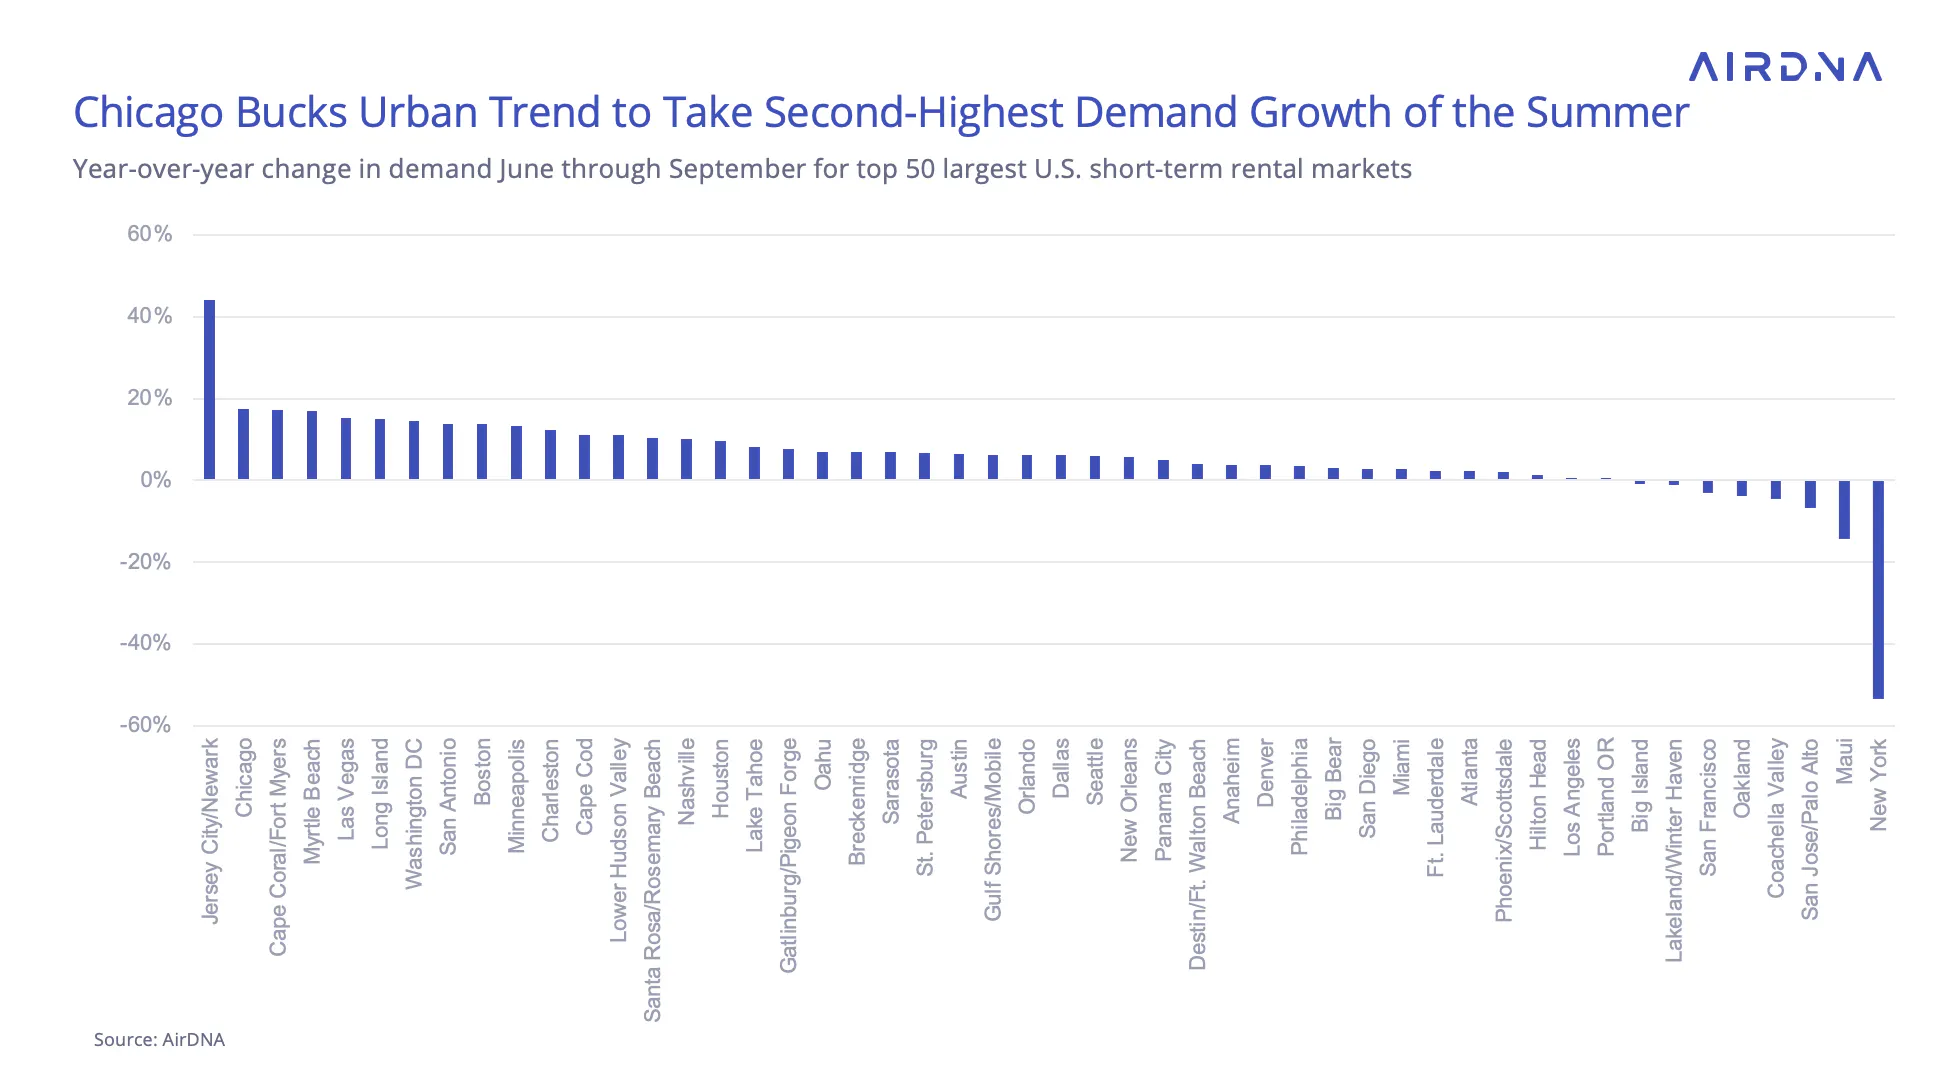
With September’s results in, we can now assess demand changes across different markets for the full summer season. The top growth markets from June through September include:
- Jersey City/Newark (+44.1% YOY): Benefited from travelers displaced by New York’s stricter regulations.
- New York (-53.4% YOY): The worst-performing market due to regulatory restrictions.
- Chicago (+17.5% YOY): Our second-fastest growing market among the top 50, helping to counterbalance New York’s effect on Urban performance.
- Cape Coral/Fort Myers, Florida (+17.2% YOY): Made a remarkable comeback after the devastation caused by Hurricane Ian.
- Myrtle Beach, South Carolina (+17.0% YOY): Demonstrated strong demand growth, underscoring the appeal of Atlantic beaches.
Fall and Holiday Demand Shows Strong Momentum
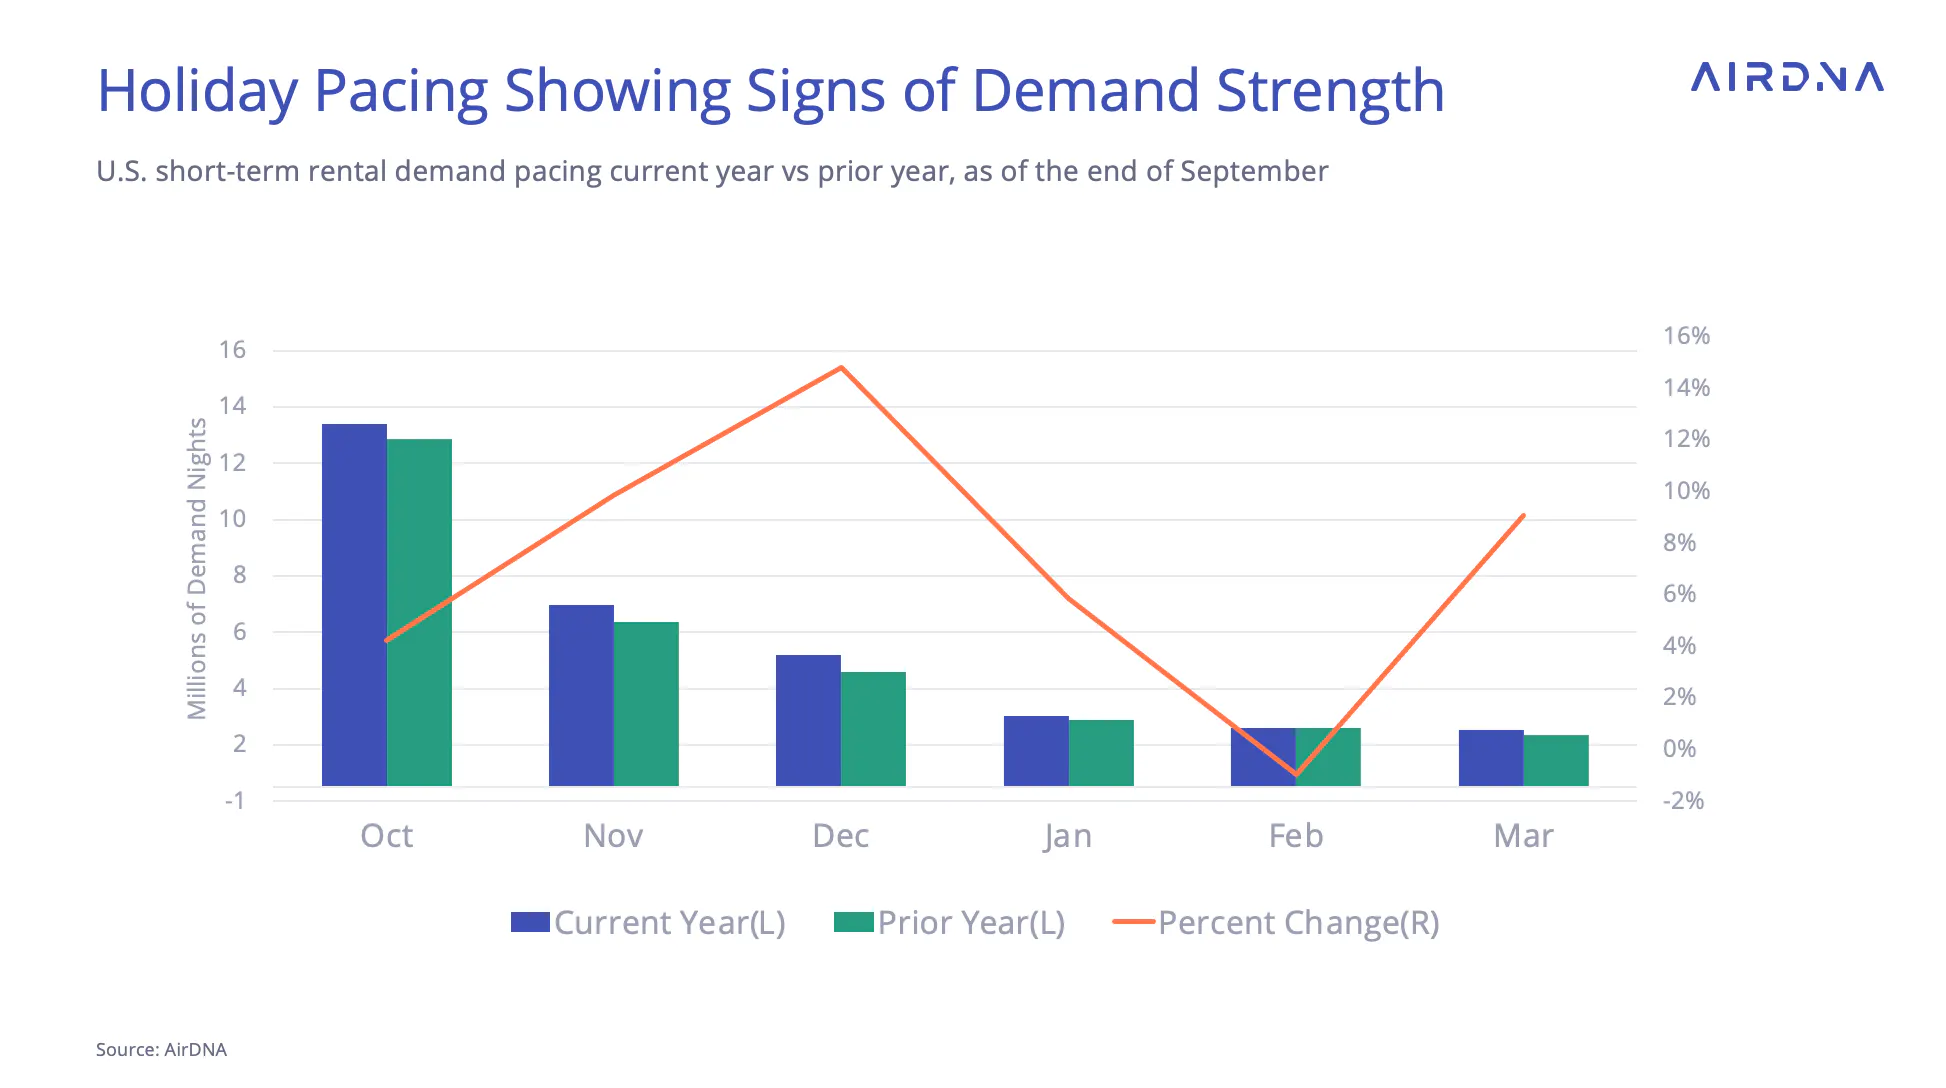
Looking ahead to the fall season, October pacing is set to improve over September, with on-the-books demand currently 4.2% higher than this time last year. Several popular leaf-peeping destinations are seeing particularly strong demand growth. Rural areas in New York state and along the Eastern Coast of Maine, near Acadia, are experiencing YOY demand increases of 19.7%. Demand for the fall really picks up in November and December, with national pacing 9.9% and 14.8% higher, respectively.
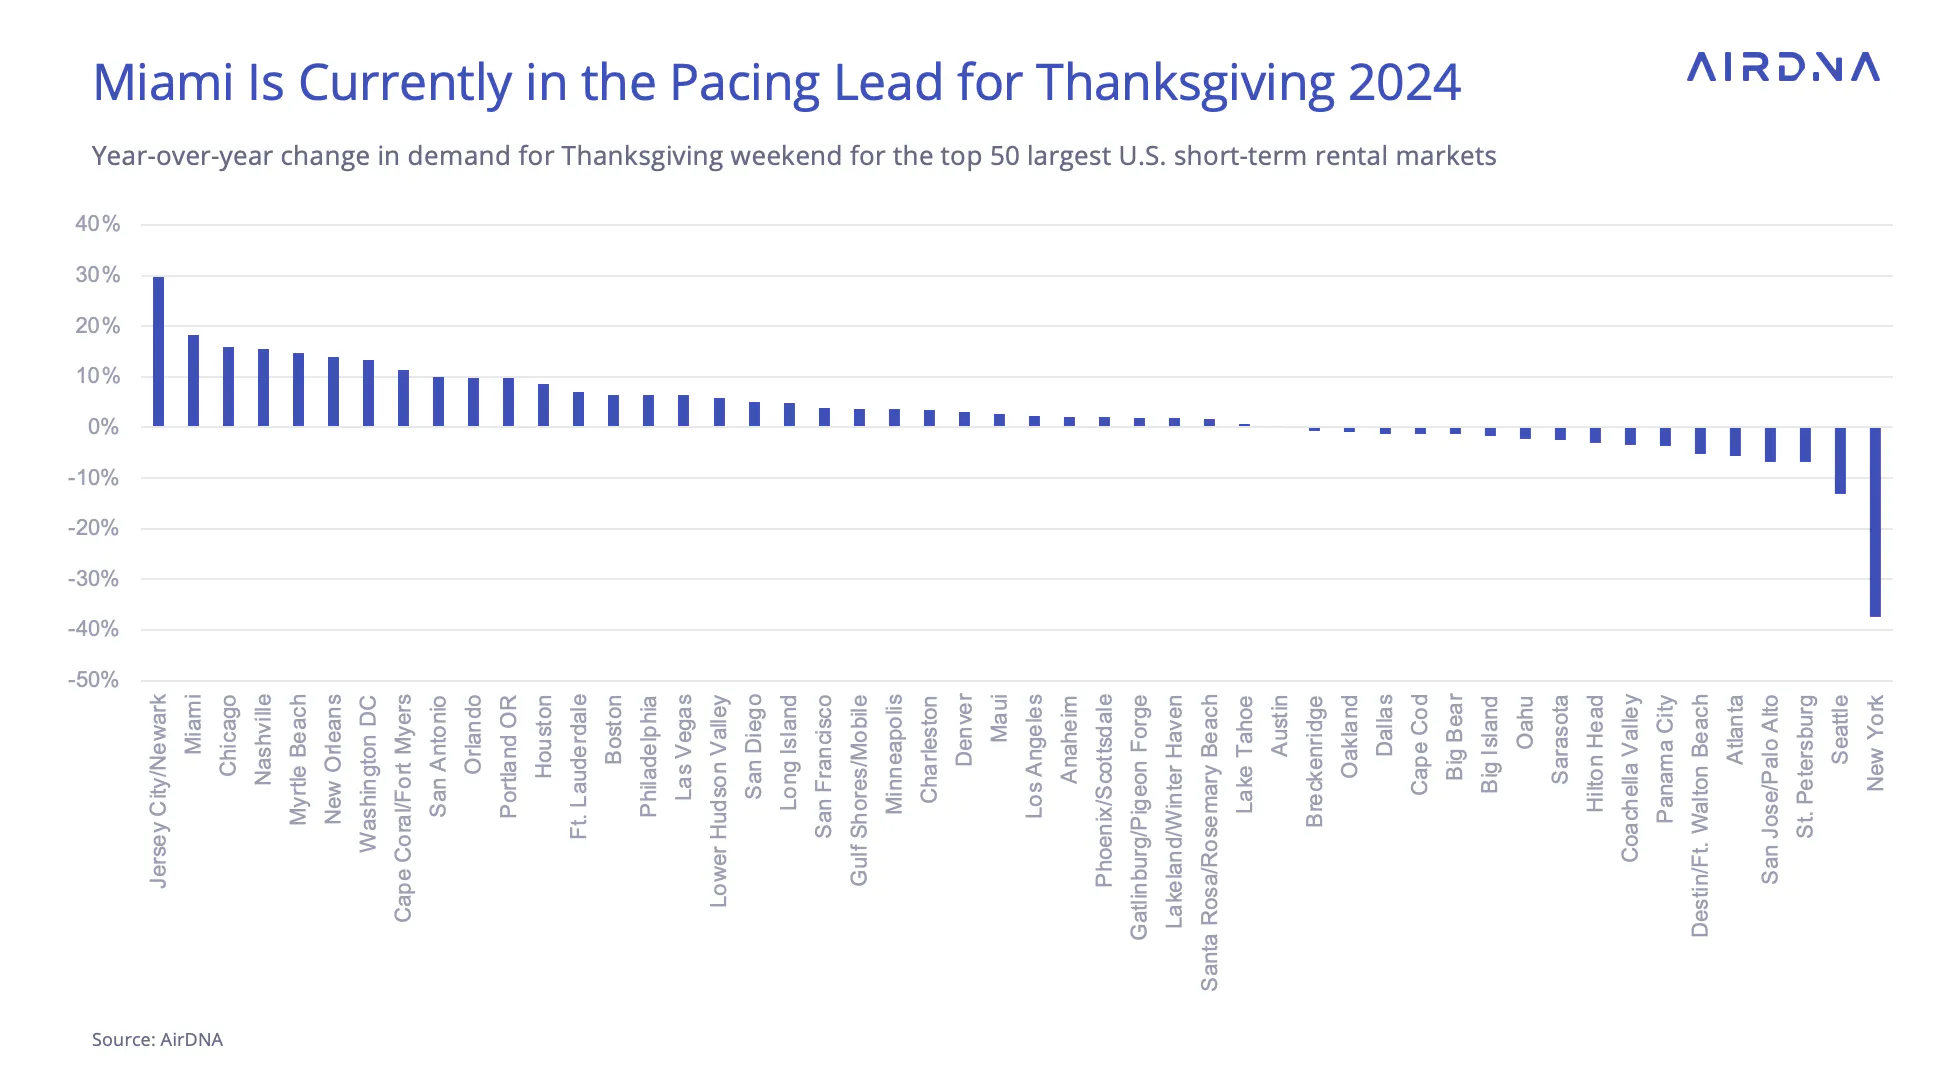
Although Chicago had a great run this summer, it appears warm sunny days have even greater appeal for the upcoming Thanksgiving holiday, as Miami takes the top demand growth spot, after Jersey City/ Newark of course(+29.8% YOY), with a demand growing +18.2% YOY. Chicago comes after (+16.0%), and Nashville(+15.5%), Myrtle Beach(+15.5%), and New Orleans(+13.8%) also had significant gains for Thanksgiving this year.
While Chicago had an excellent summer, warmer destinations seem to be more appealing for the upcoming Thanksgiving holiday. Miami takes the top spot for demand growth (+18.2% YOY) after Jersey City/Newark (+29.8% YOY). Other top markets for Thanksgiving include:
- Chicago: +16.0% YOY
- Nashville, Tennessee: +15.5% YOY
- Myrtle Beach, South Carolina: +15.5% YOY
- New Orleans: +13.8% YOY
ARTICLE SUMMARY
September saw slower listing growth in the U.S. short-term rental (STR) market, with new listings dropping 17.1% year-over-year. Despite this, average daily rates (ADR) posted their seventh consecutive month of growth, climbing 2.7% YOY. Fall and holiday travel shows strong momentum, with rising consumer optimism and solid bookings ahead.
Bram Gallagher
AirDNA Director of Economics and Forecasting
Bram Gallagher is an Economist at AirDNA, specializing in uncovering insights that drive smarter short-term rental decisions. He put his Ph.D. in Economics from the University of Georgia to work researching and forecasting hotel data with CBRE prior to joining AirDNA, as well as teaching economics at a number of universities. In his spare time, Bram enjoys making wooden furniture with hand tools.
