U.S. Review September 2025: Demand Softens as Supply Growth Hits Lowest Point of the Year
Published: October 15, 2025
Last updated: August 31, 2026

Bram Gallagher
Key Takeaways:
- Demand declined slightly year-over-year in September (–0.1%), marking the first negative change since April 2024.
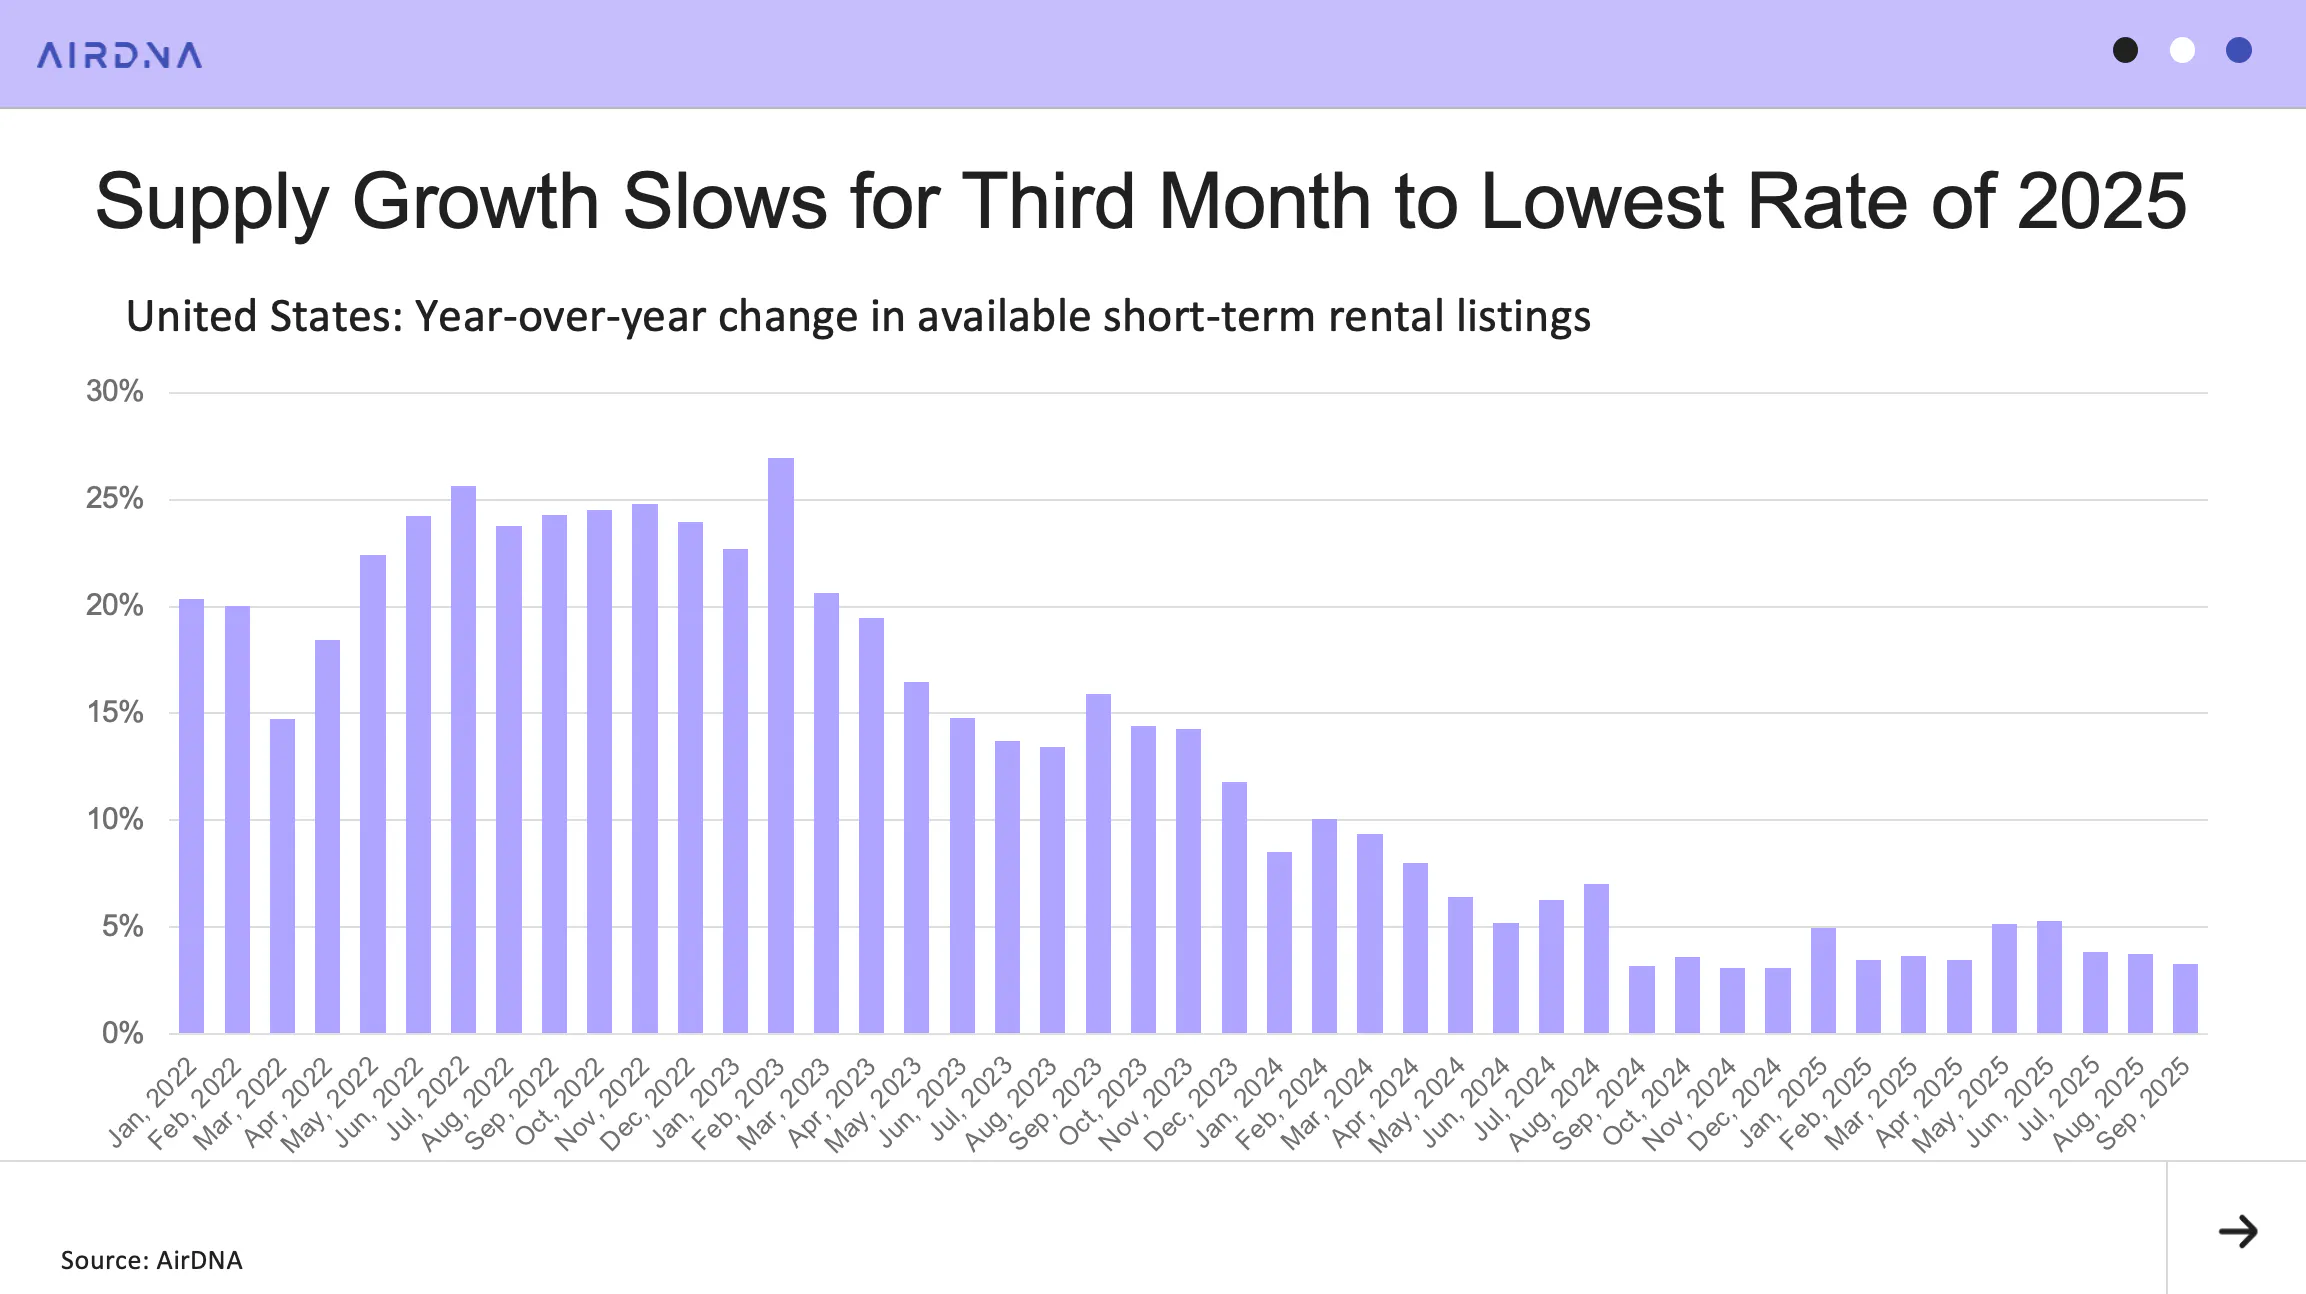
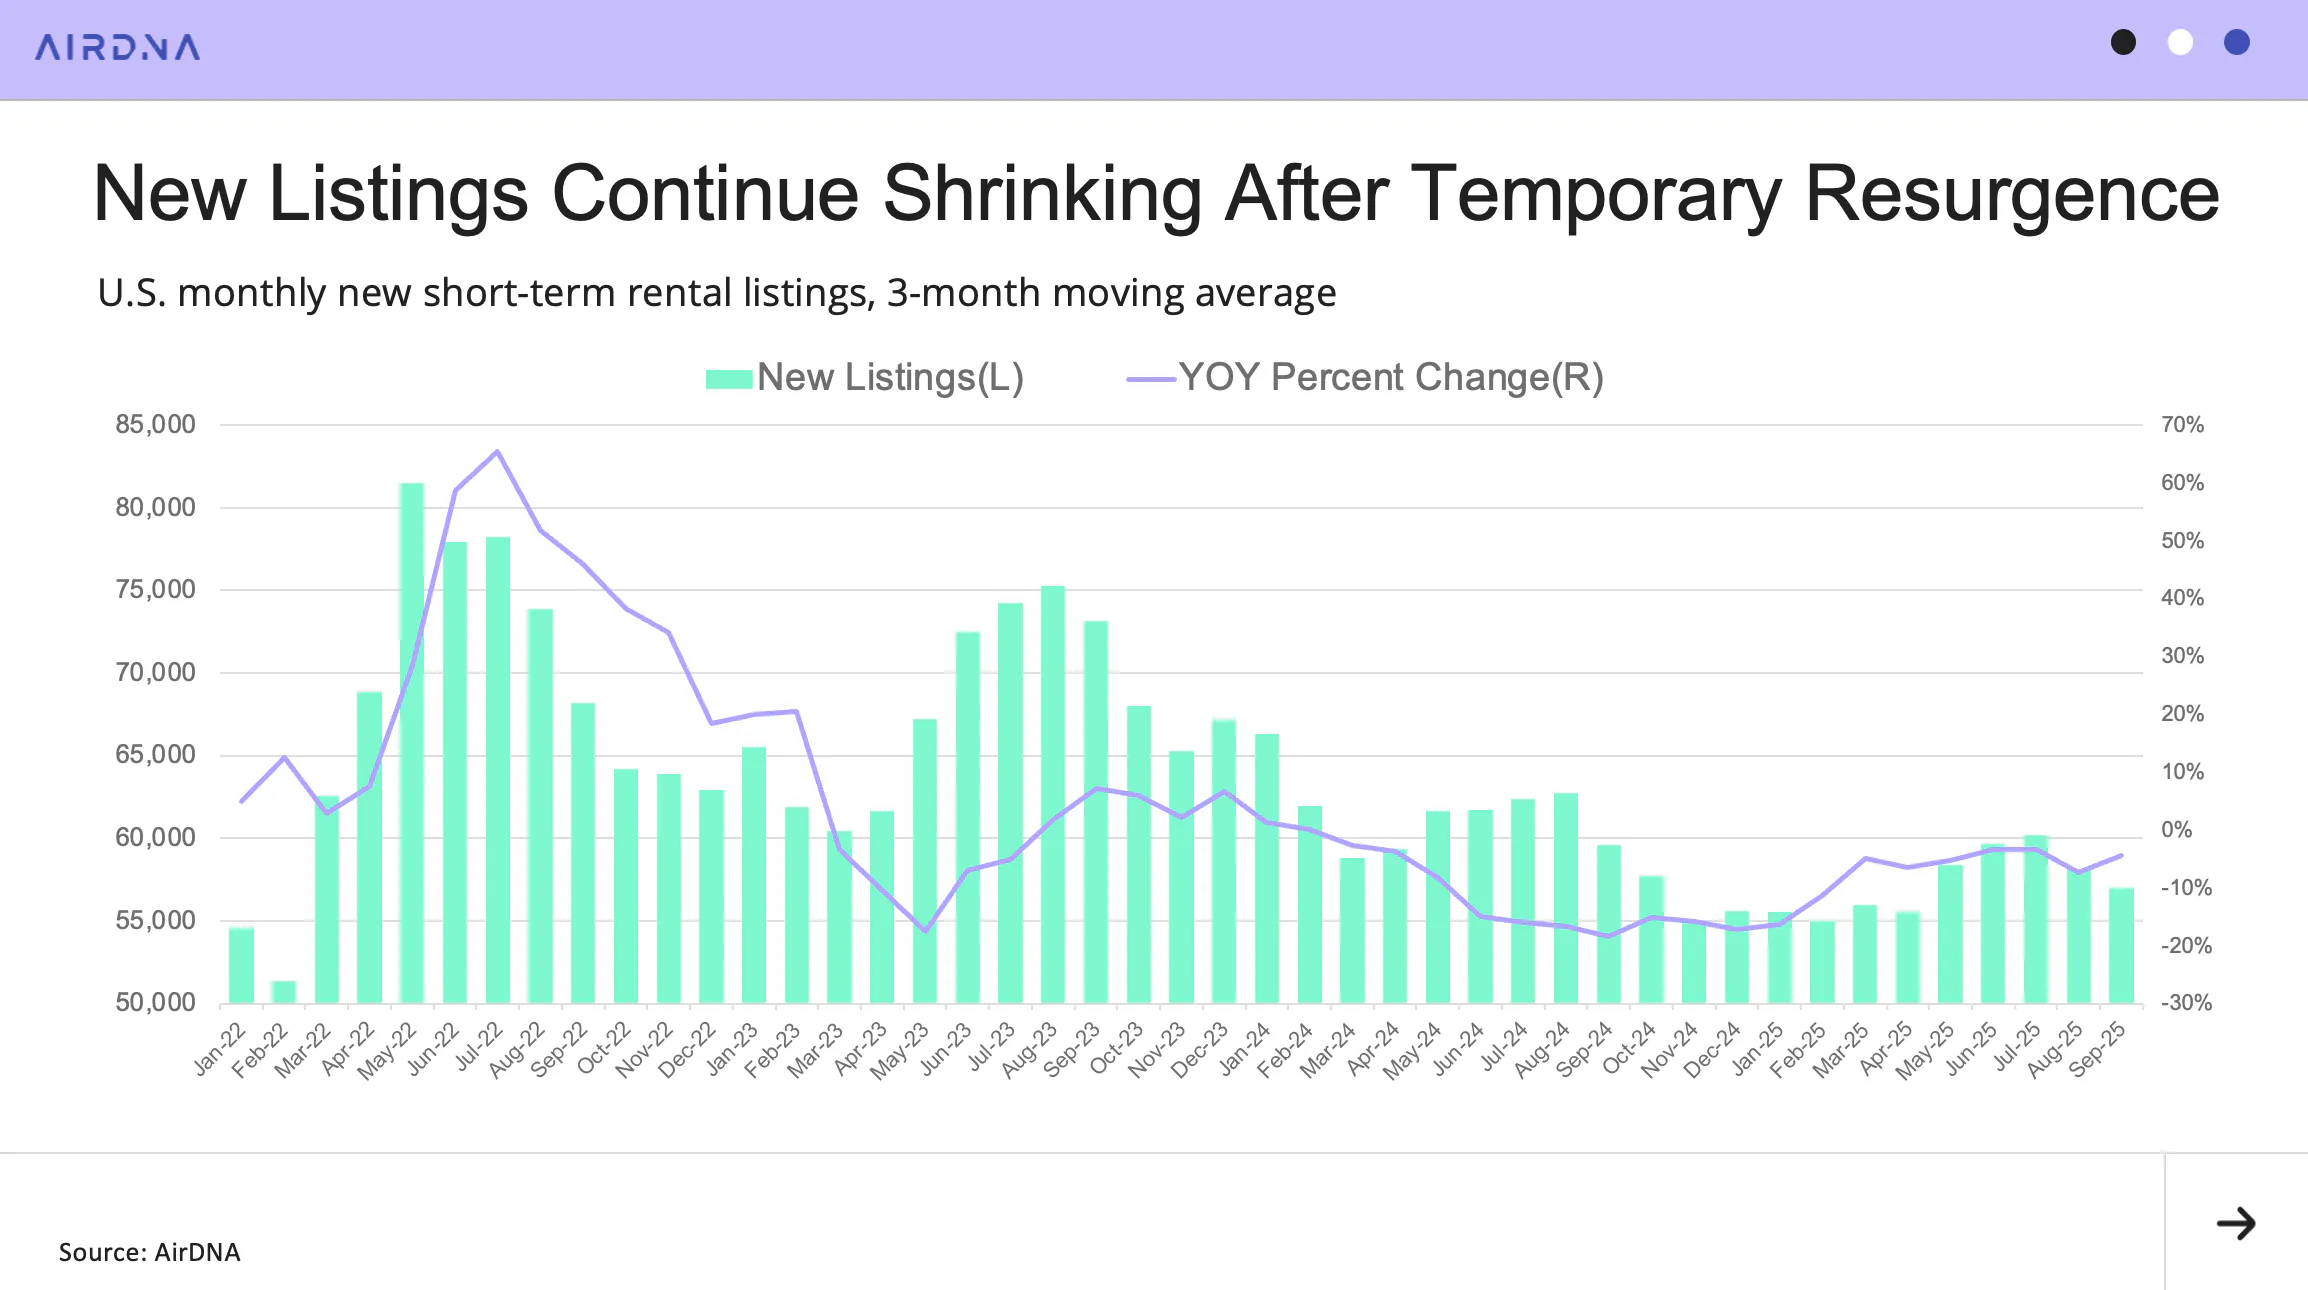
- Supply growth slowed to 3.3% year-over-year (the lowest rate of 2025) while new listings fell by –4.4%.
- Average daily rates (ADR) increased by +4.5%, helping lift RevPAR by +0.5% to $143.25 despite occupancy dropping –3.9% year-over-year.
- Strong holiday pacing gives hope for the end of the year, with Thanksgiving weekend bookings up +14.7% compared with 2024 and the prior weekend up nearly +19.7%.
September performance in the U.S. short-term rental (STR) market was muted, marking the first year-over-year decline in demand (–0.1%) since April 2024.
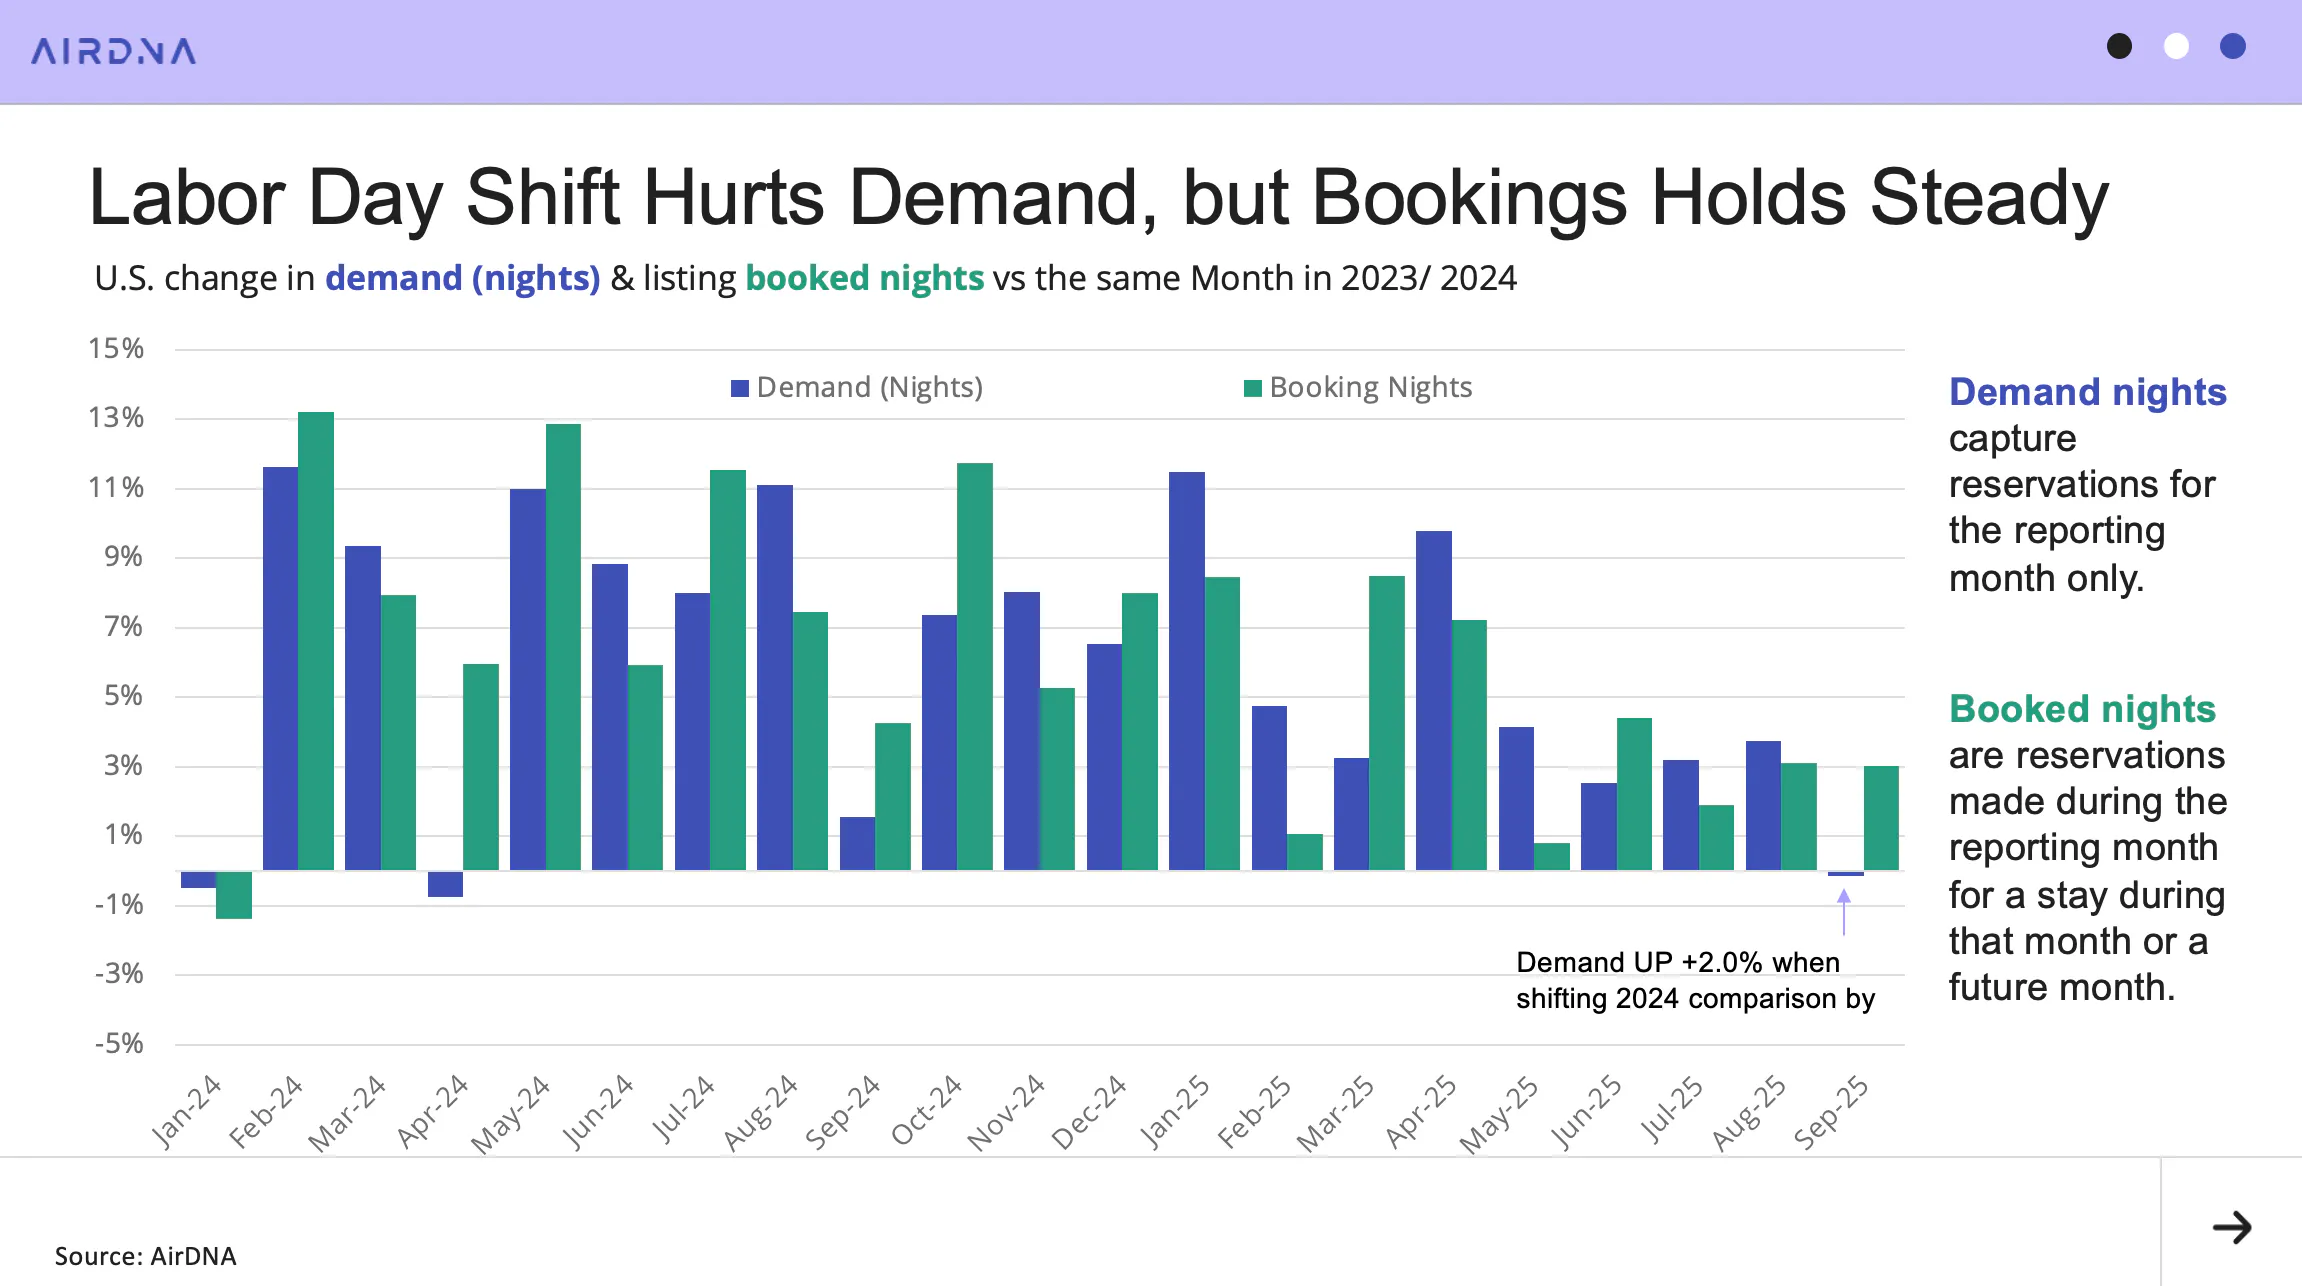
However, there is good news. Like April, results were skewed by a calendar shift that moved one day of the Labor Day weekend from September into August. Adjusting for this shift (by comparing September 2025 with September 2–October 1, 2024) demand growth comes in at +2.0%, a modest but steady rate of expansion.
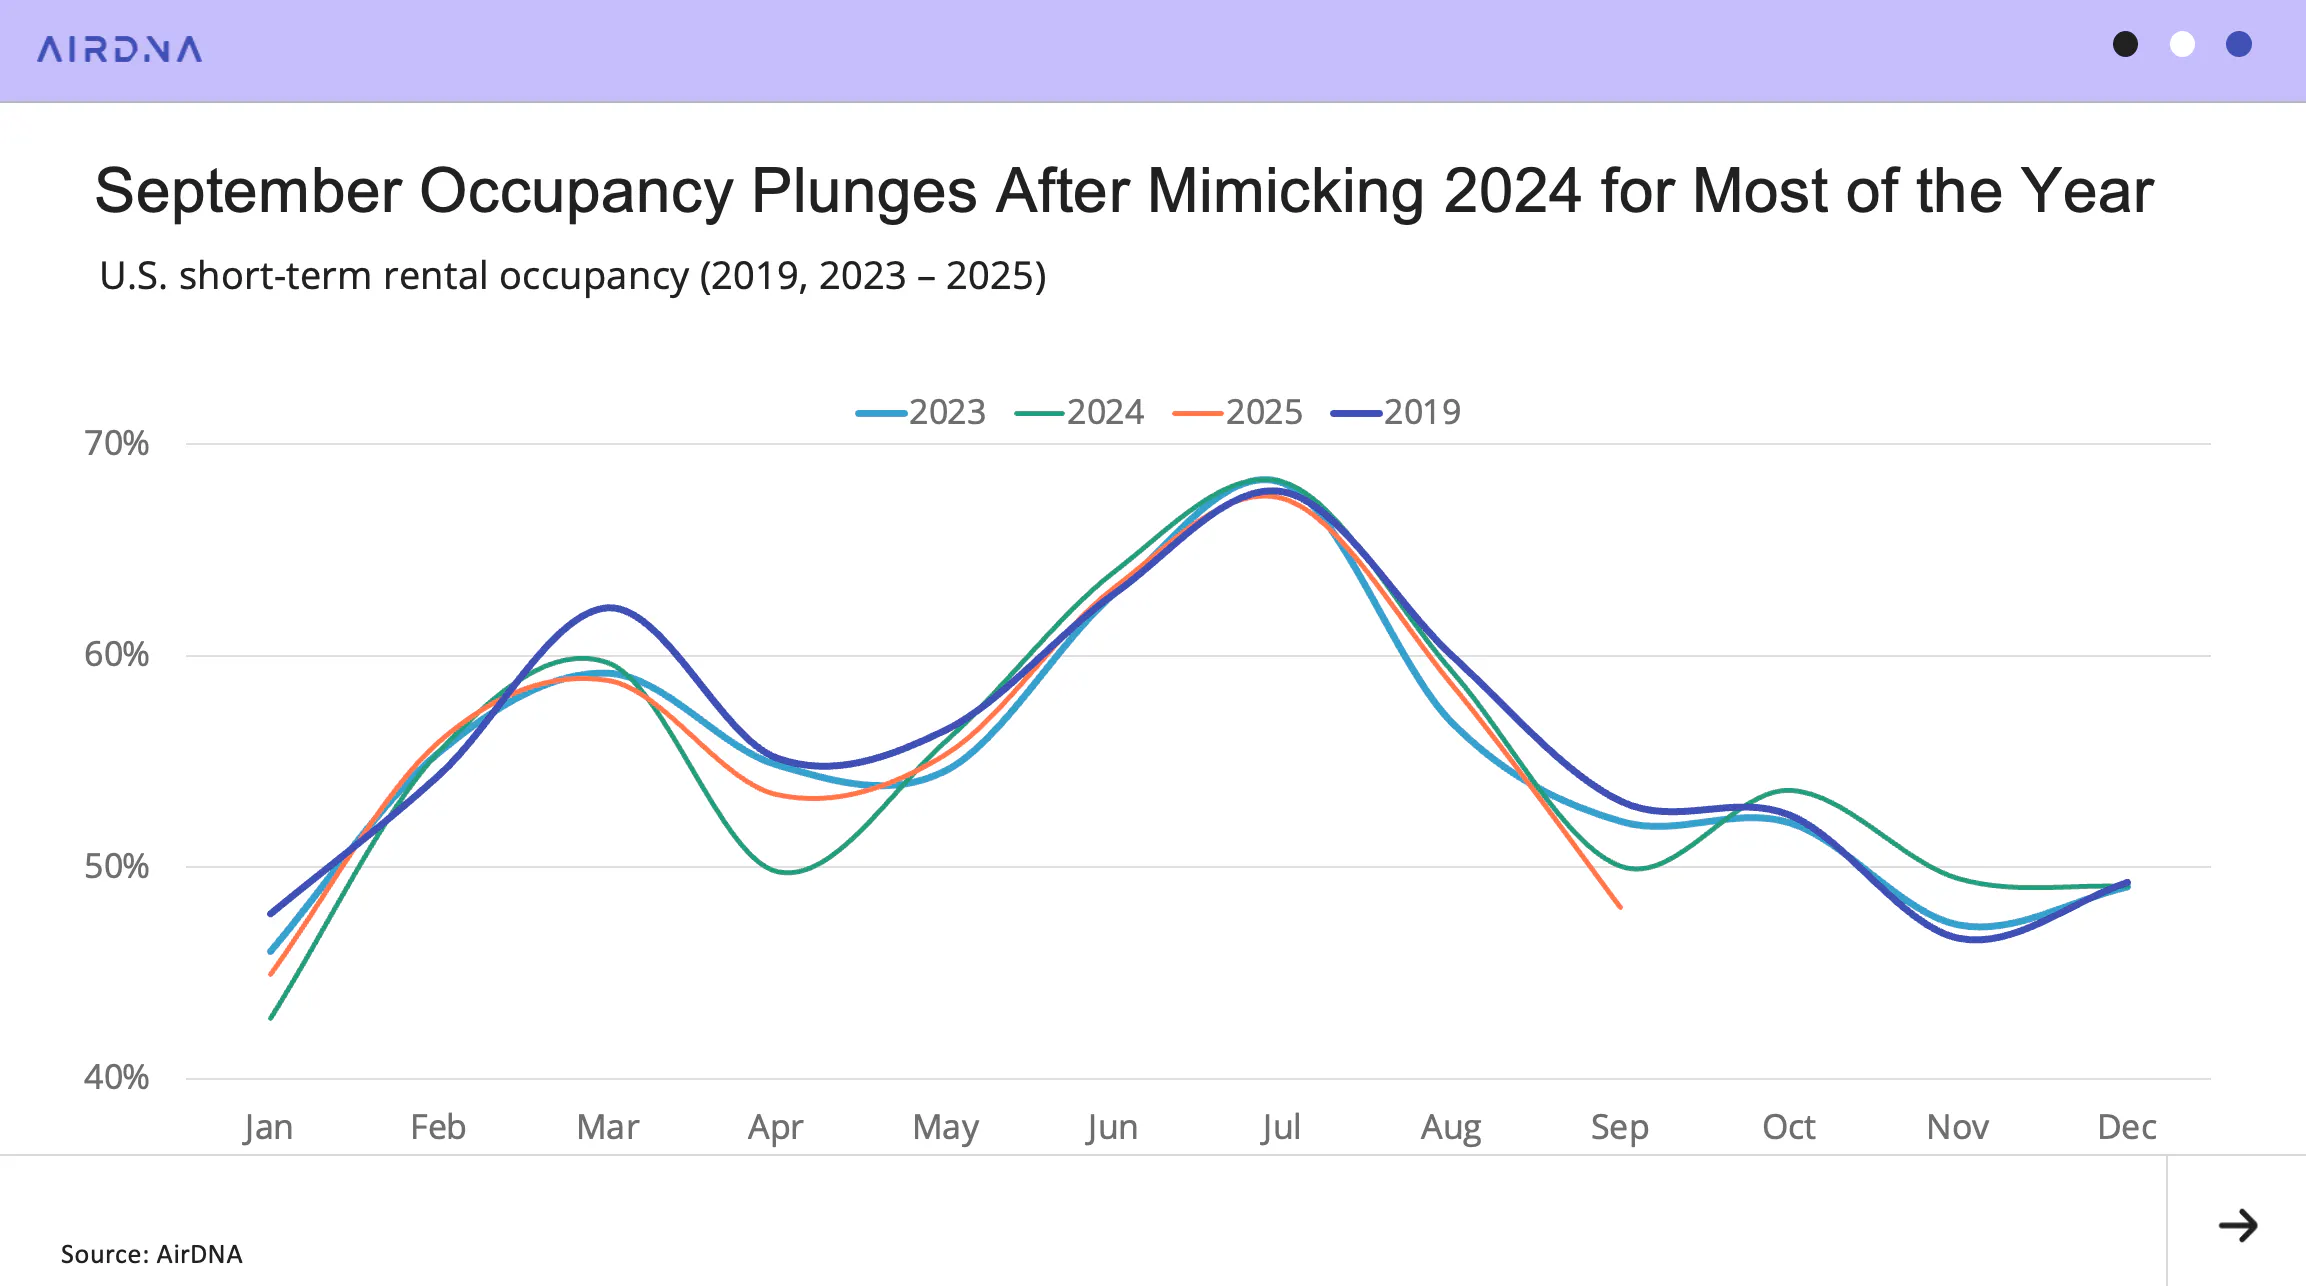
This adjustment also halves the apparent occupancy loss, reducing it from –3.9% to –2.0%, bringing it closer in line with the small monthly declines observed since May. Year-to-date occupancy remains level with 2024, supported by slower supply growth and strong holiday pacing. With demand expected to firm up through the remainder of the year, occupancy could still close 2025 slightly higher than last year.
At a Glance: Key U.S. STR Performance Metrics for September 2025
- Revenue per Available Rental (RevPAR) increased 0.5% year-over-year (YOY) to $143.25
- Available listings reached 1.76 million, a 3.3% increase year-over-year
- Demand nights were essentially flat, down -0.1% compared to September 2024, but up 2.0% when shifting from September 2024 one day forward.
- Occupancy averaged 48.1%, down 3.9% year-over-year, but down only 2.0% when shifting from September 2024 one day forward.
- Average Daily Rates (ADR) climbed to $297.79, up 4.5% from last year
- The Repeat Rent Index (RRI) rose 3.8% year-over-year
- Total nights booked were up 3.0% from September 2024.
Economic Outlook
The U.S. economic picture grew more uncertain in September as the recent government shutdown halted publication of official data from the Bureau of Labor Statistics. Before the shutdown, the BLS had already reported a sharp slowdown in hiring, with only 22,000 jobs added in August, one of the weakest monthly gains in recent years.
Private-sector estimates have since filled the gap, though they paint an equally subdued picture. The Carlyle Group, using data from its portfolio companies, estimated a gain of just 17,000 jobs in September, while payroll processor ADP reported a loss of 32,000 jobs. Together, these figures suggest that labor market momentum has stalled, reinforcing concerns of a broader economic cooling.
In response, the Federal Reserve cut interest rates in September (the first reduction of 2025) as signs of labor market weakness outweighed lingering inflation concerns. Inflation had hovered near 3% before the shutdown, but policymakers are now expected to prioritize employment stability. Most economists anticipate two to three additional rate cuts before the end of the year, a move that could begin to thaw the housing market and stimulate STR investment in 2026.

Cooling Labor Market and Lower Rates Temper Supply
In May and June, supply growth accelerated to above 5%, causing concern that a reinvigorated STR supply could further weaken occupancy. Since June, however, supply growth has slowed each month. In September, available listings grew 3.3% year-over-year, down from 3.8% in August and marking the lowest rate of 2025.
The difficulties in the labor market have led many economists to predict that rates will be cut more quickly than anticipated earlier in the year, with two or three cuts now seeming almost certain. Mortgage markets responded to this new trajectory by falling to their lowest level since October 2024, briefly touching 6.26% before settling at 6.3% by the end of September. This may signal a looser housing market and more STR investment in the future, but such a reversal is unlikely to occur until well into 2026. It takes considerable time for the Fed’s target rate to filter through to longer-term interest rates, the housing market, and ultimately the STR sector.
New listings also showed a temporary resurgence earlier in the year, with year-over-year growth improving from –16.3% in January to –3.3% by June. Since then, however, growth has stalled and declined again, with new listings down –4.4% year-over-year in September.
Labor Day Timing Distorts September STR Performance
The calendar shift dragged down demand to essentially match 2024 levels, dipping slightly at –0.1% year-over-year. When adjusting the September 2024 comparison to account for the Labor Day weekend change, demand rises modestly to +2.0%, which is still slower than August’s +3.7%. Bookings, an indicator of future demand, held steady at +3.0%, down only slightly from 3.1% in August. This suggests that September may represent a bottoming out of demand growth.
Occupancy saw a sharper decline, falling –3.9% year-over-year. Adjusting for the calendar shift reduces the decline to –2.0%. This aligns more closely with the moderate drops seen from April onward, when occupancy declined between –1% and –1.2%. Year-to-date occupancy remains even with 2024 at 56.6%, supported by strong early-year performance.
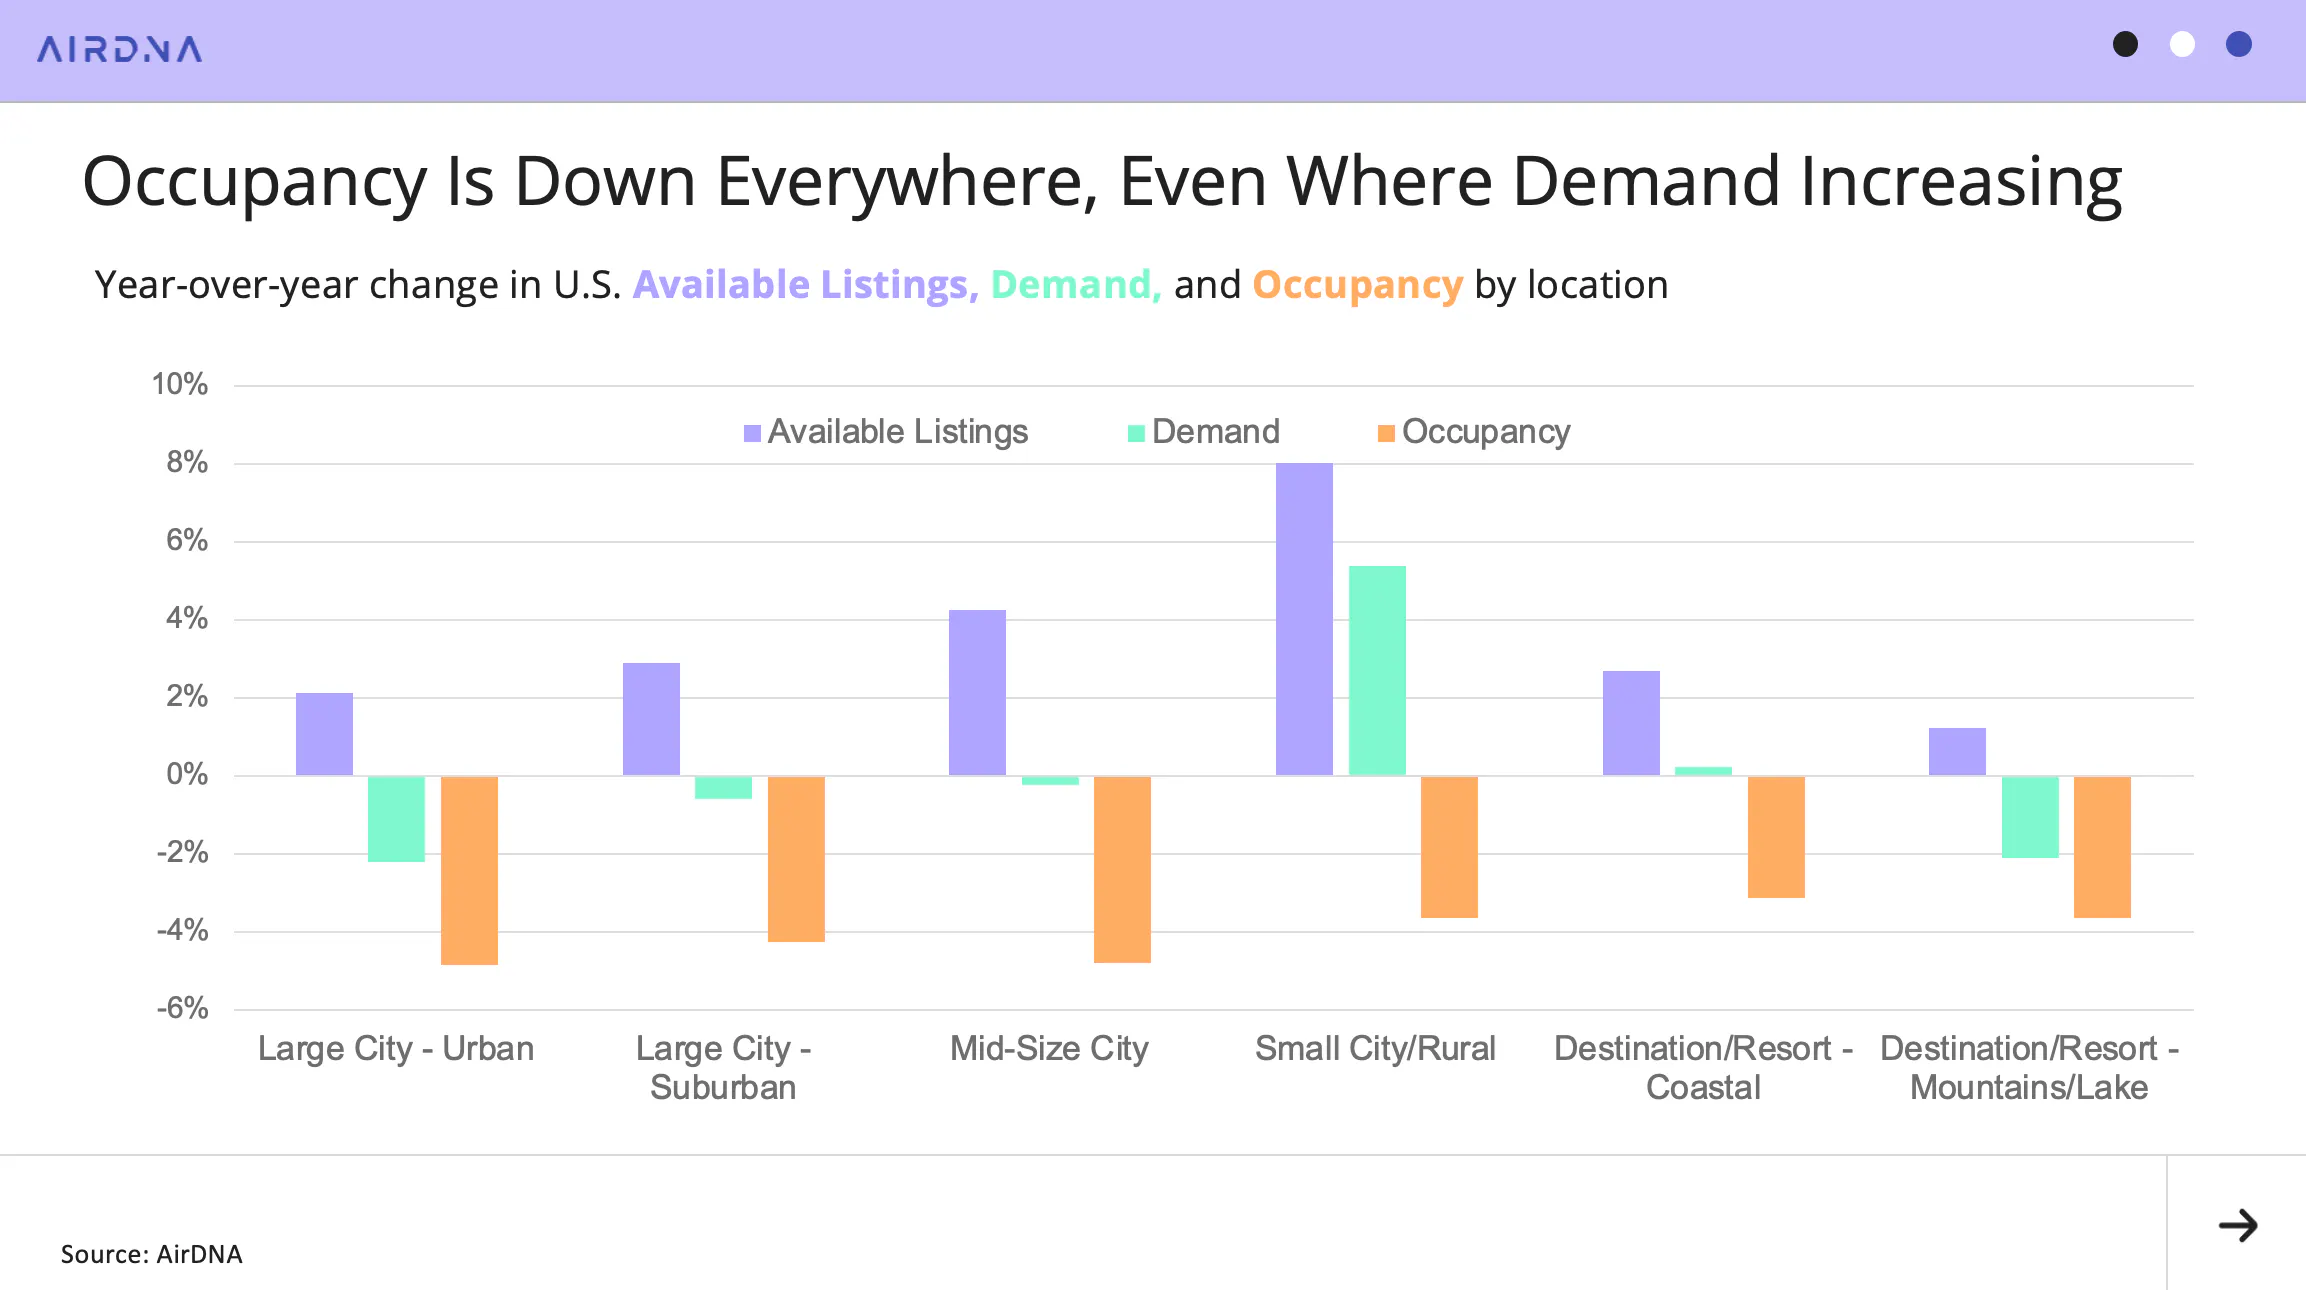
Across location types, none recorded an increase in occupancy in September. Only Small City/Rural and Coastal resort destinations saw growth in demand.
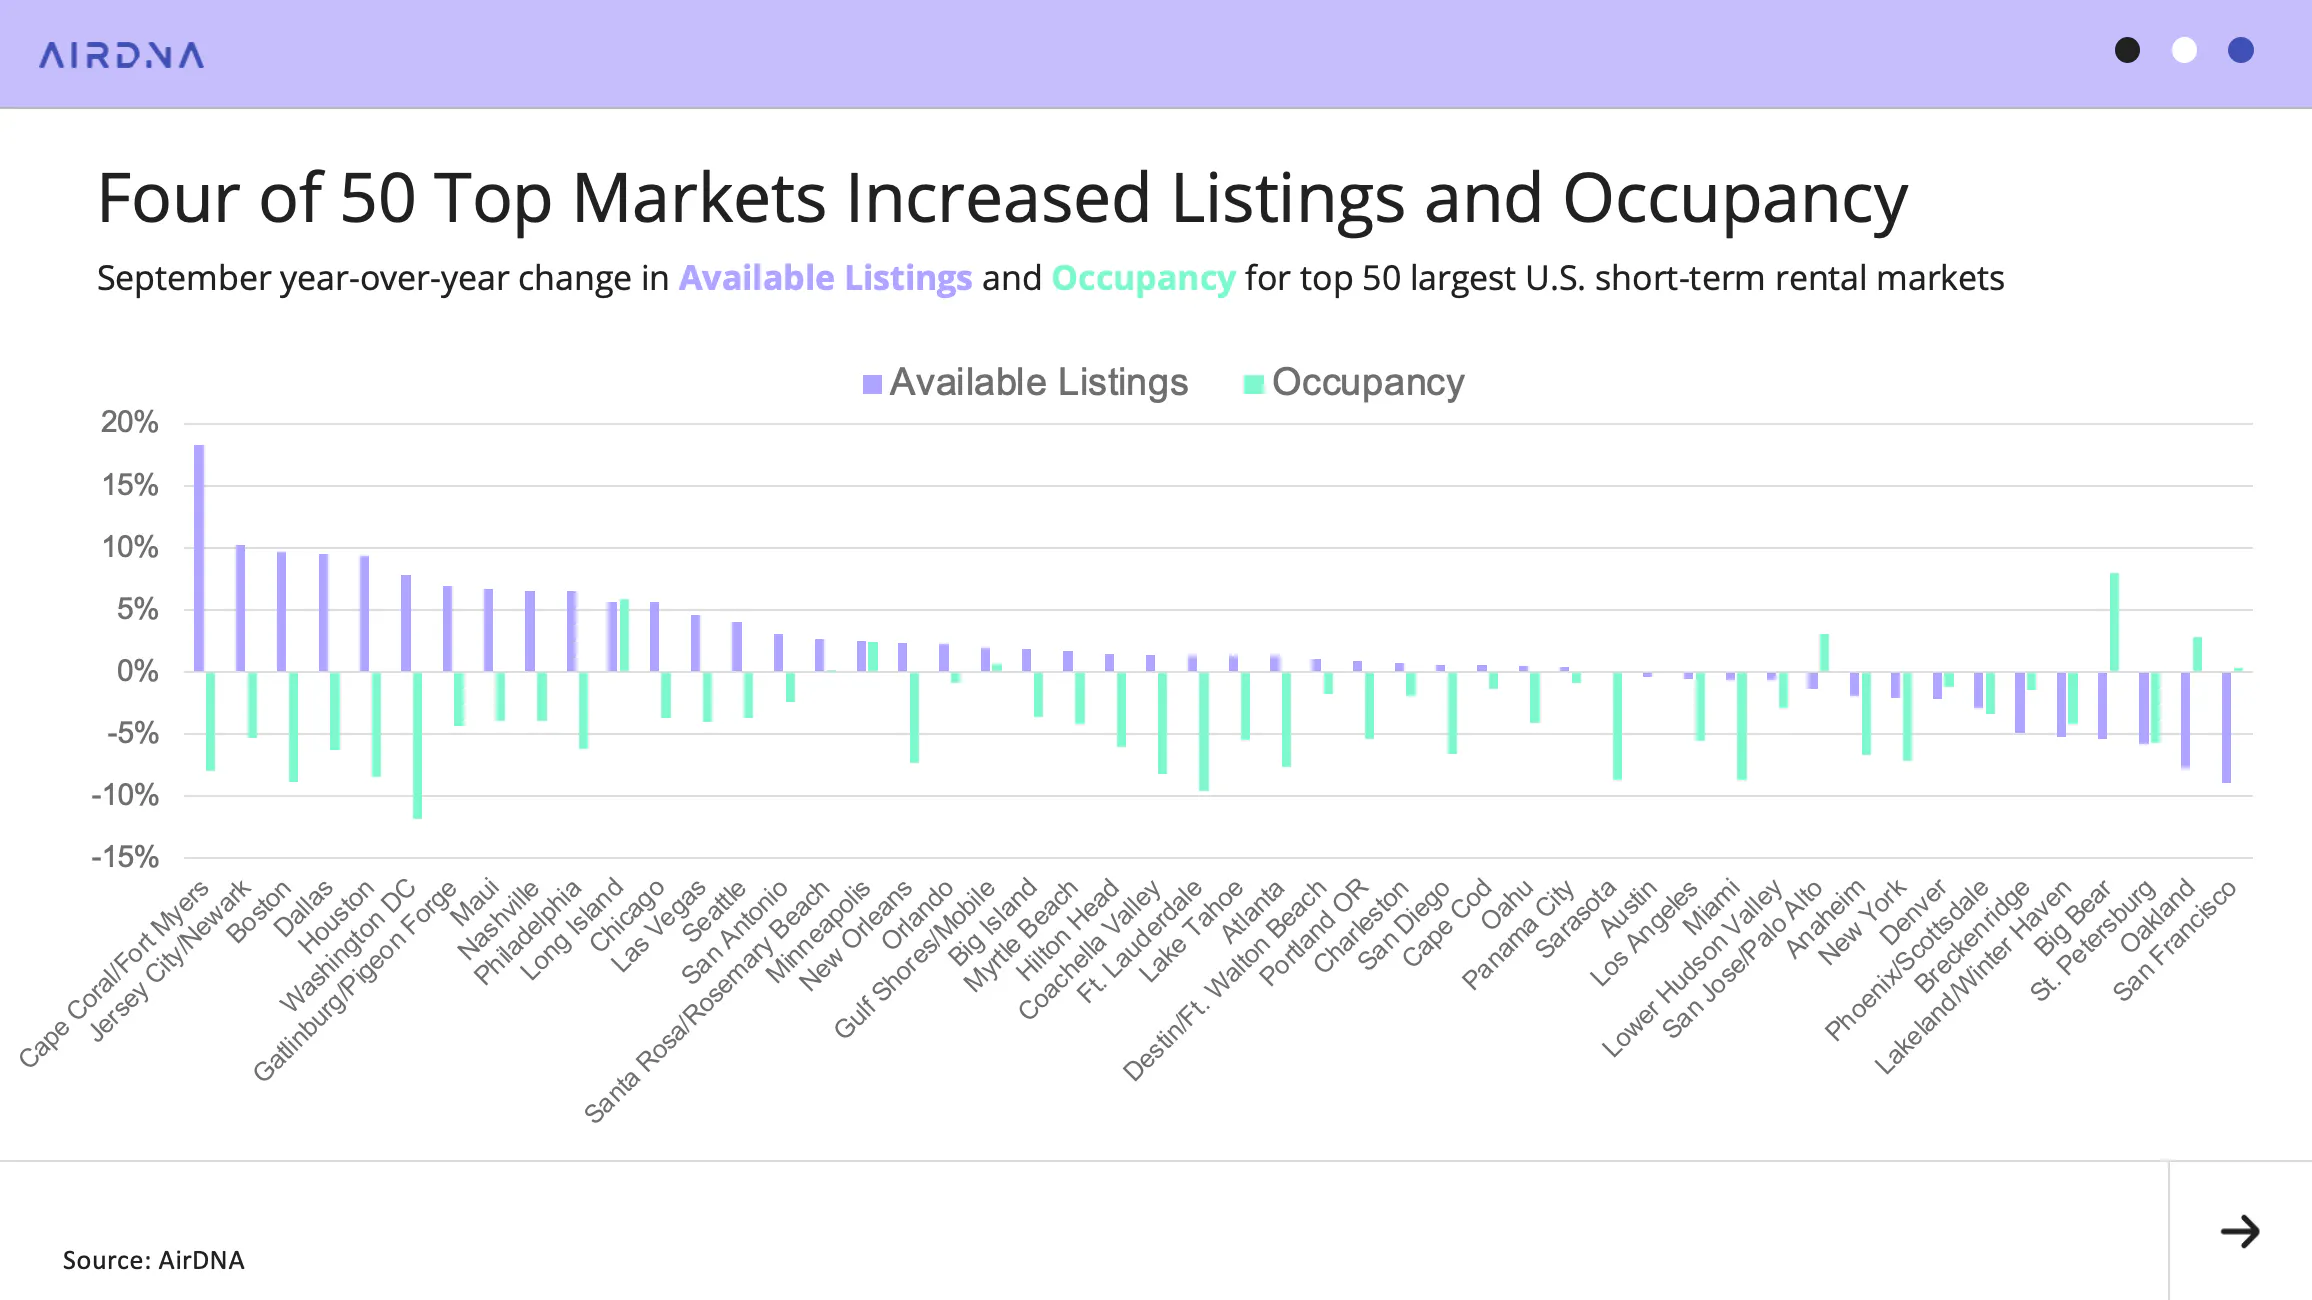
At the market level, the number of top 50 markets posting occupancy gains fell from 16 in August to just 8 in September. While demand softened, supply growth remained widespread, with 35 markets expanding their available listings.
Of those, only four achieved year-over-year occupancy increases:
- Long Island, New York (+5.9%)
- Santa Rosa/Rosemary Beach, Florida (+0.2%)
- Minneapolis, Minnesota, (+2.4%)
- Gulf Shores/Mobile, Alabama (+2.4%).
Nightly Rate Growth Dips Again
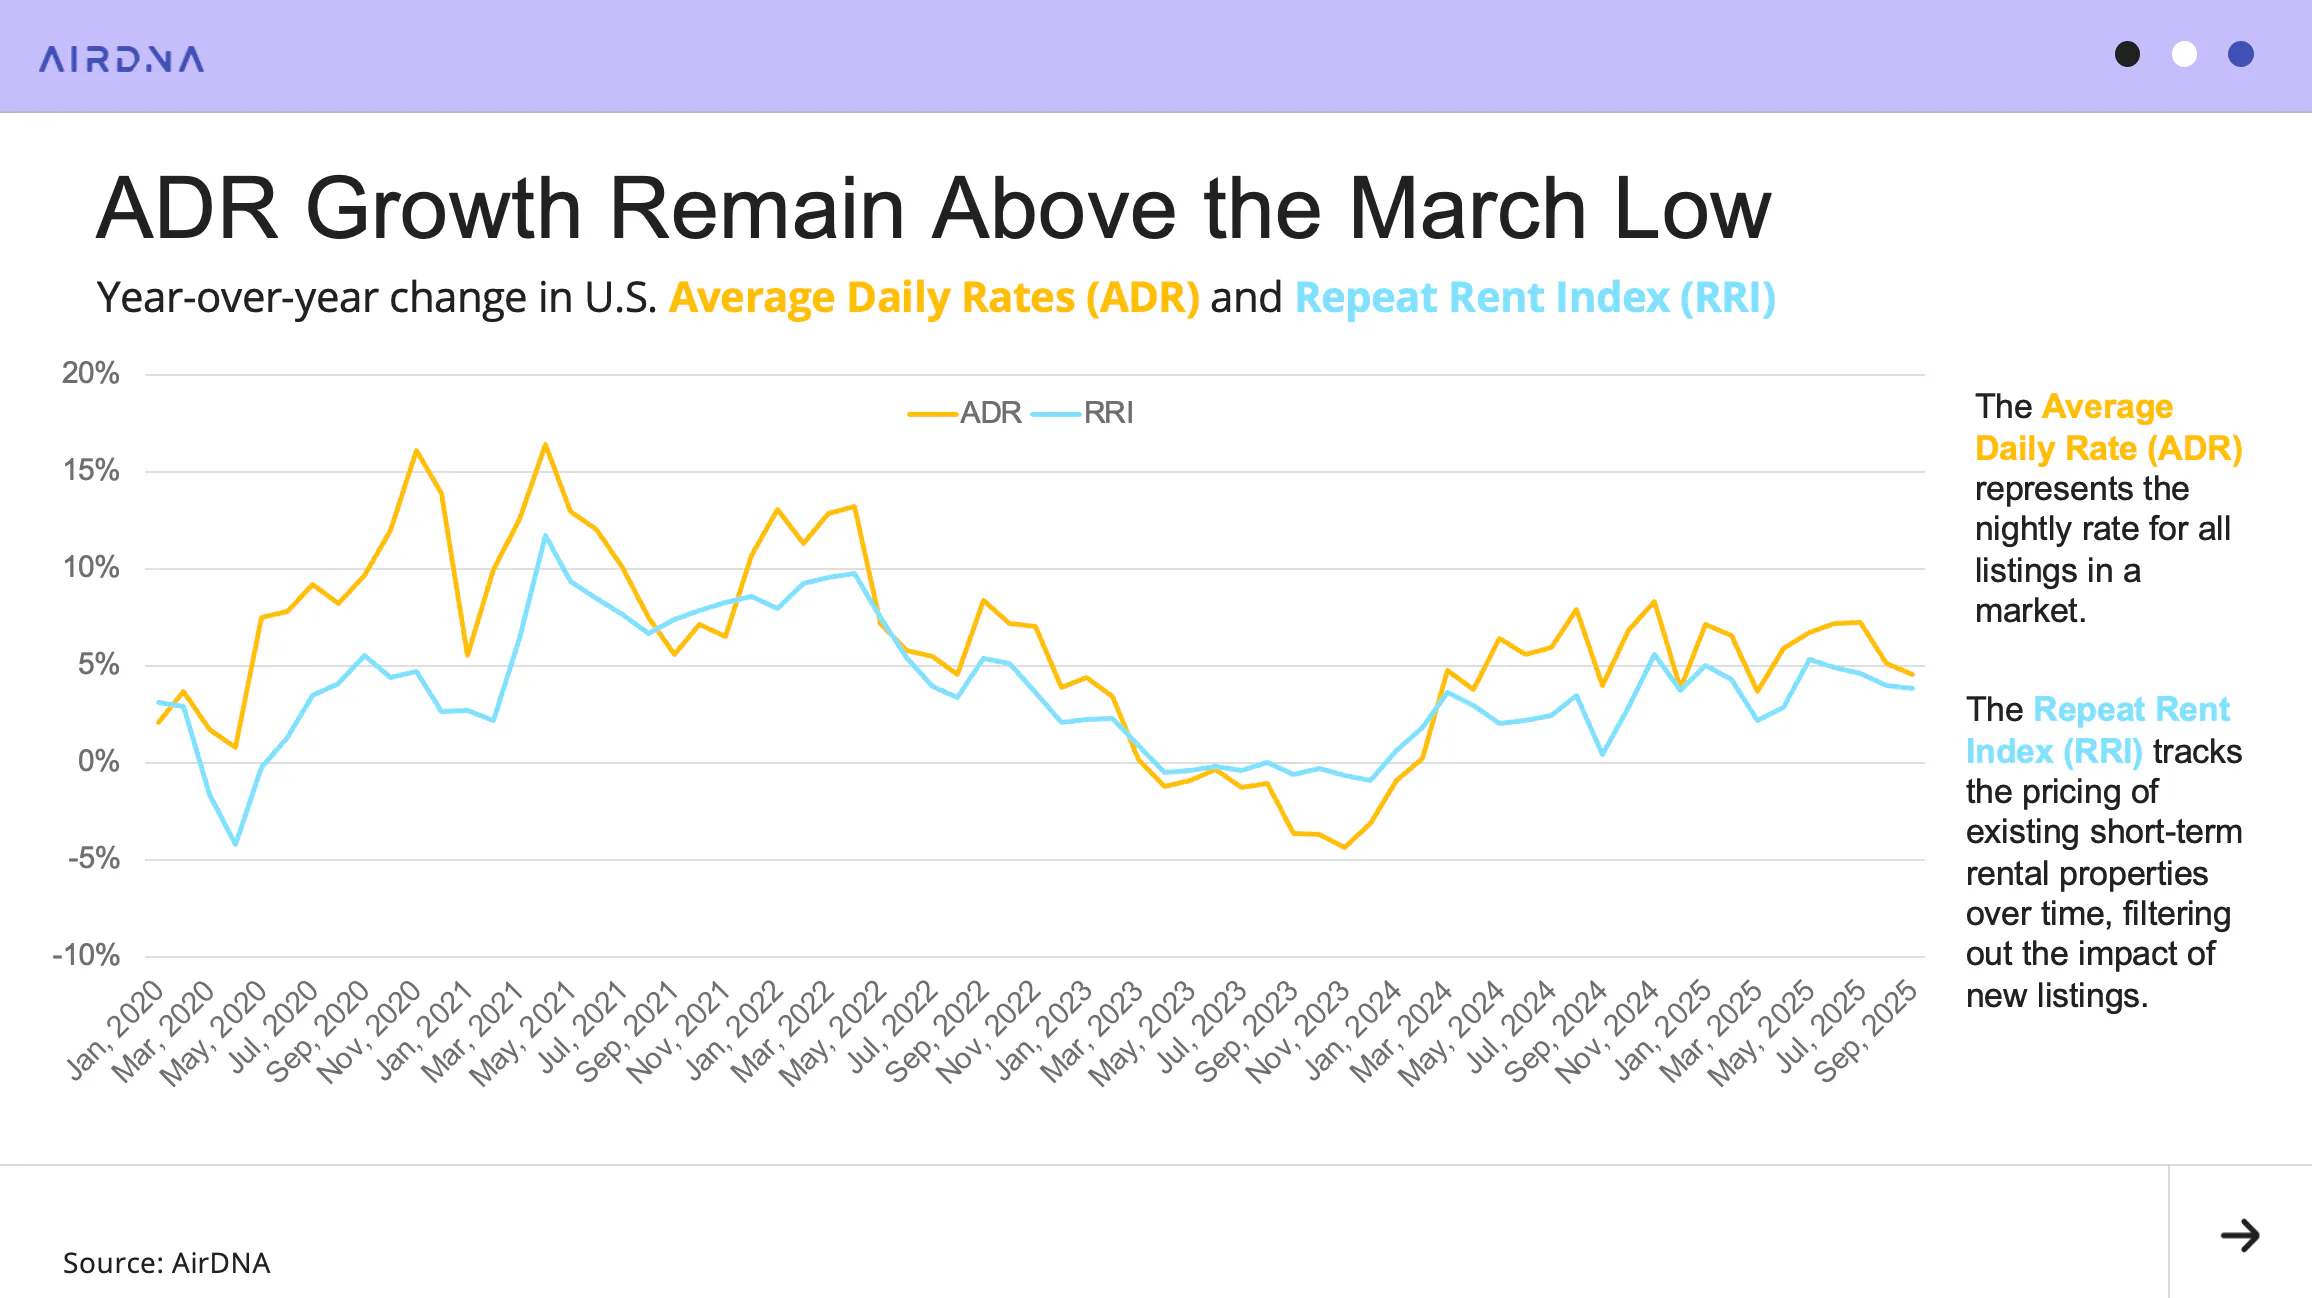
Average daily rate (ADR) growth slowed for the second month in a row. Despite steeper occupancy losses compared to August, the slowdown in rate growth was modest. ADR rose +4.5% year-over-year in September, down slightly from +5.1% in August.
ADR has now increased for nineteen consecutive months. The high inflation rates of 2022 and 2023 squeezed consumer budgets and pushed STR prices down. Since then, ADRs have recovered and are generally outpacing inflation.
The Repeat Rent Index (RRI), which measures pricing changes among existing operators and excludes the effect of new listings entering the market, also slowed slightly in September. RRI rose +3.8%, compared with +4.1% in August. The convergence between RRI and ADR reflects that new listings are being priced similarly to existing stock. The slowdown in overall supply growth has reduced the impact of listing mix changes on rate trends.
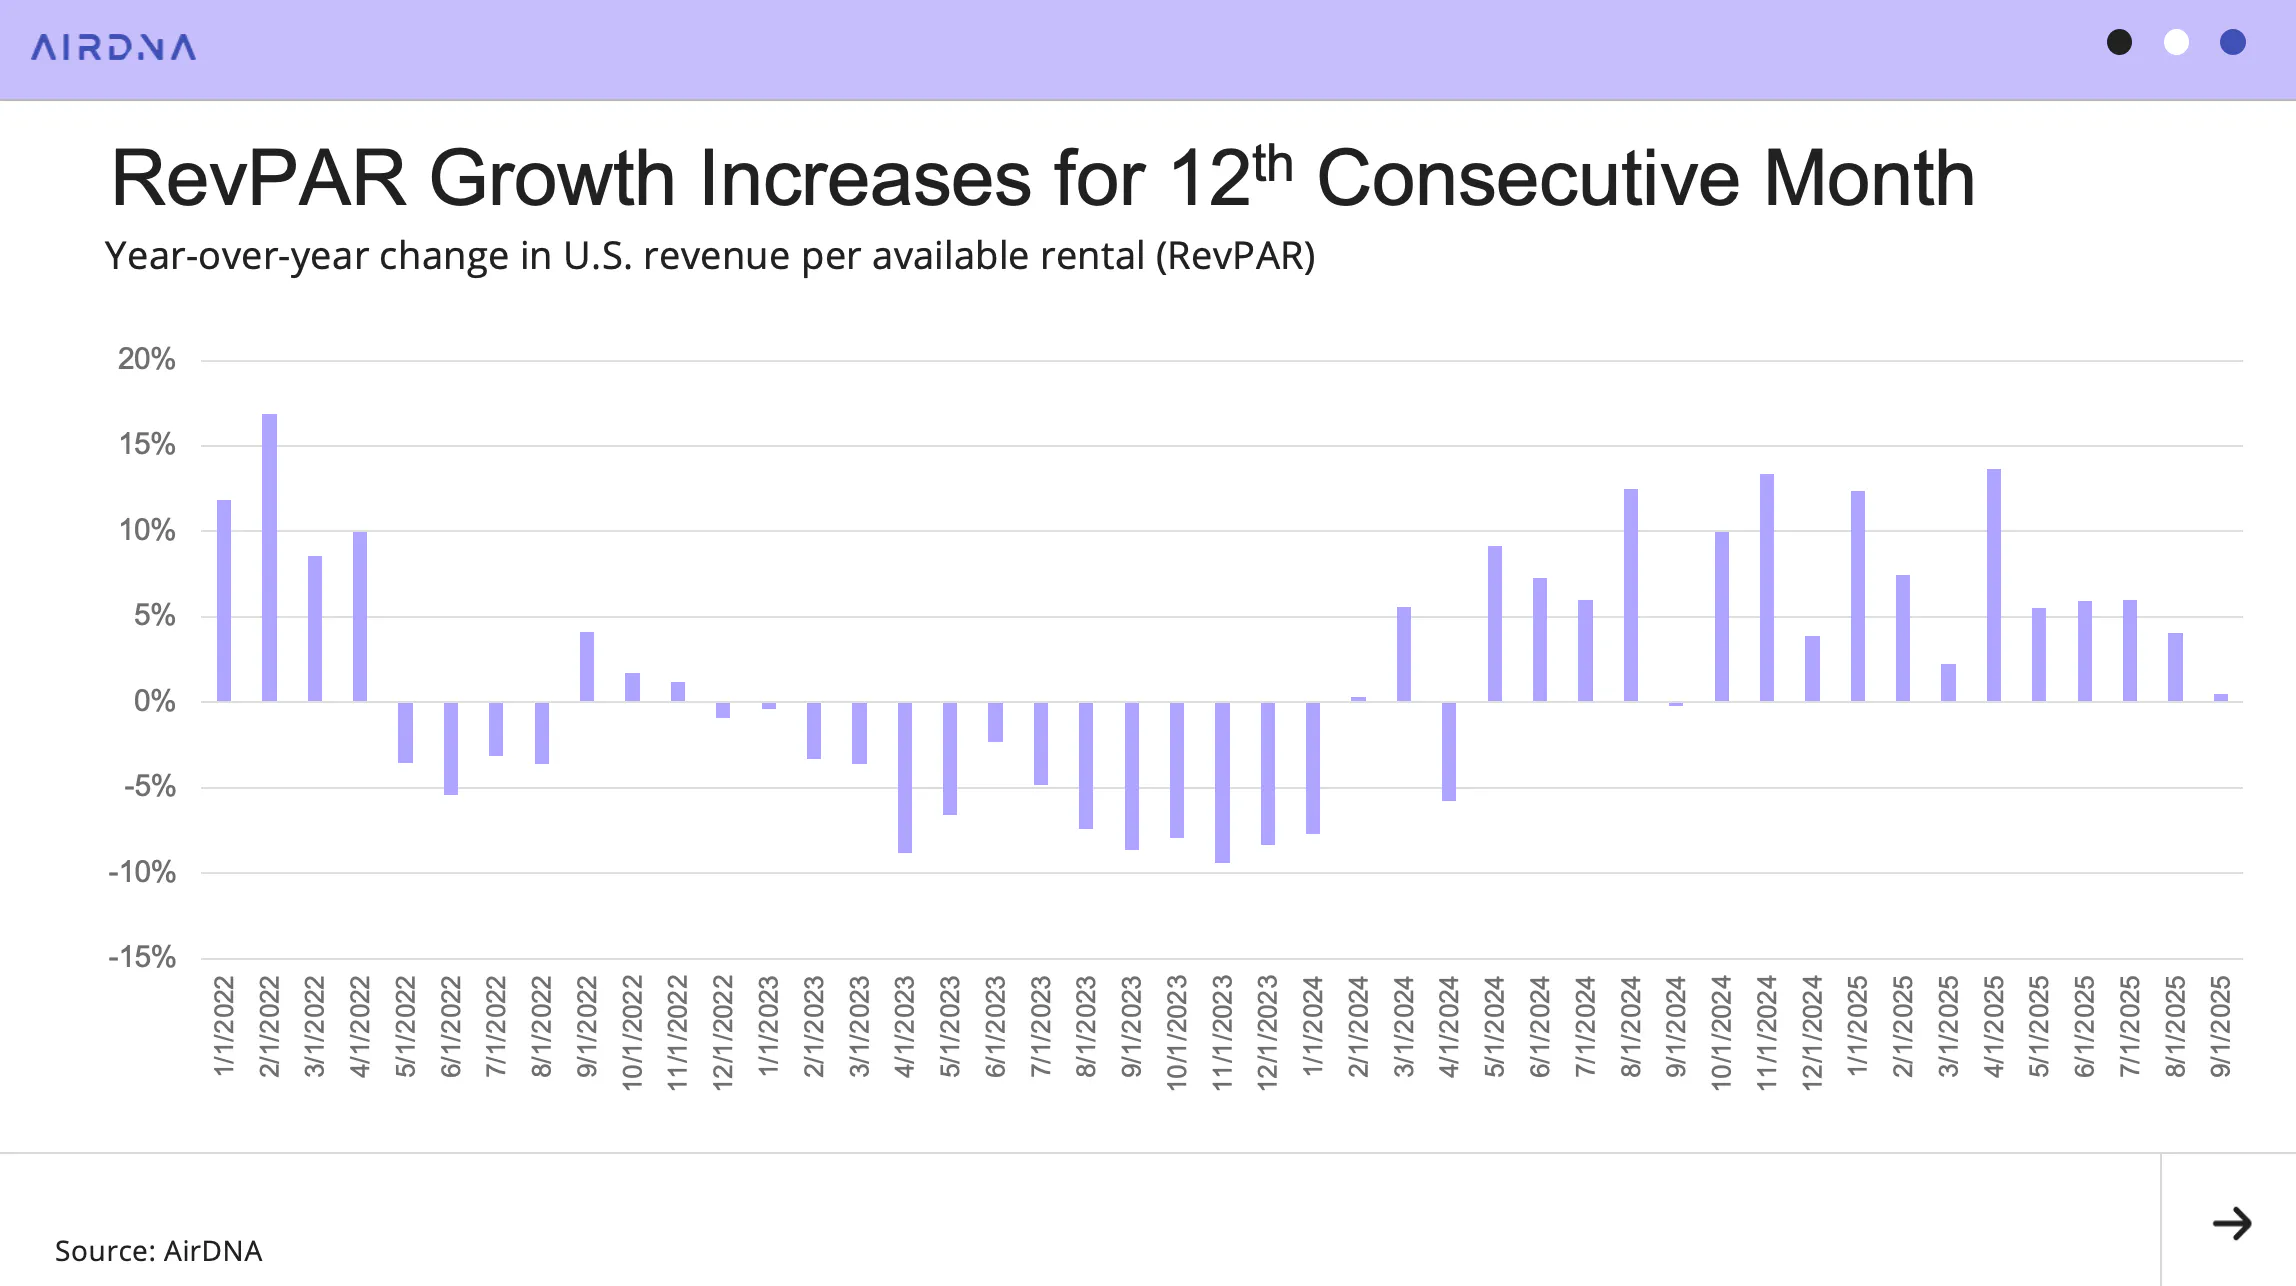
Since ADR has been the main driver of RevPAR growth in 2025, it’s no surprise that stronger rates have translated into steady revenue gains. RevPAR has now increased for twelve consecutive months, showing that pricing strength continues to support top-line growth even amid softening occupancy.
Holidays Are the Best Hope for the Rest of 2025
Looking ahead, on-the-books demand pacing suggests modest growth for October, with stronger gains expected in November and December. Travel demand that may have been deferred earlier in the year due to economic uncertainty following the April tariff announcements and the labour slowdown appears likely to resurface over the holiday season.
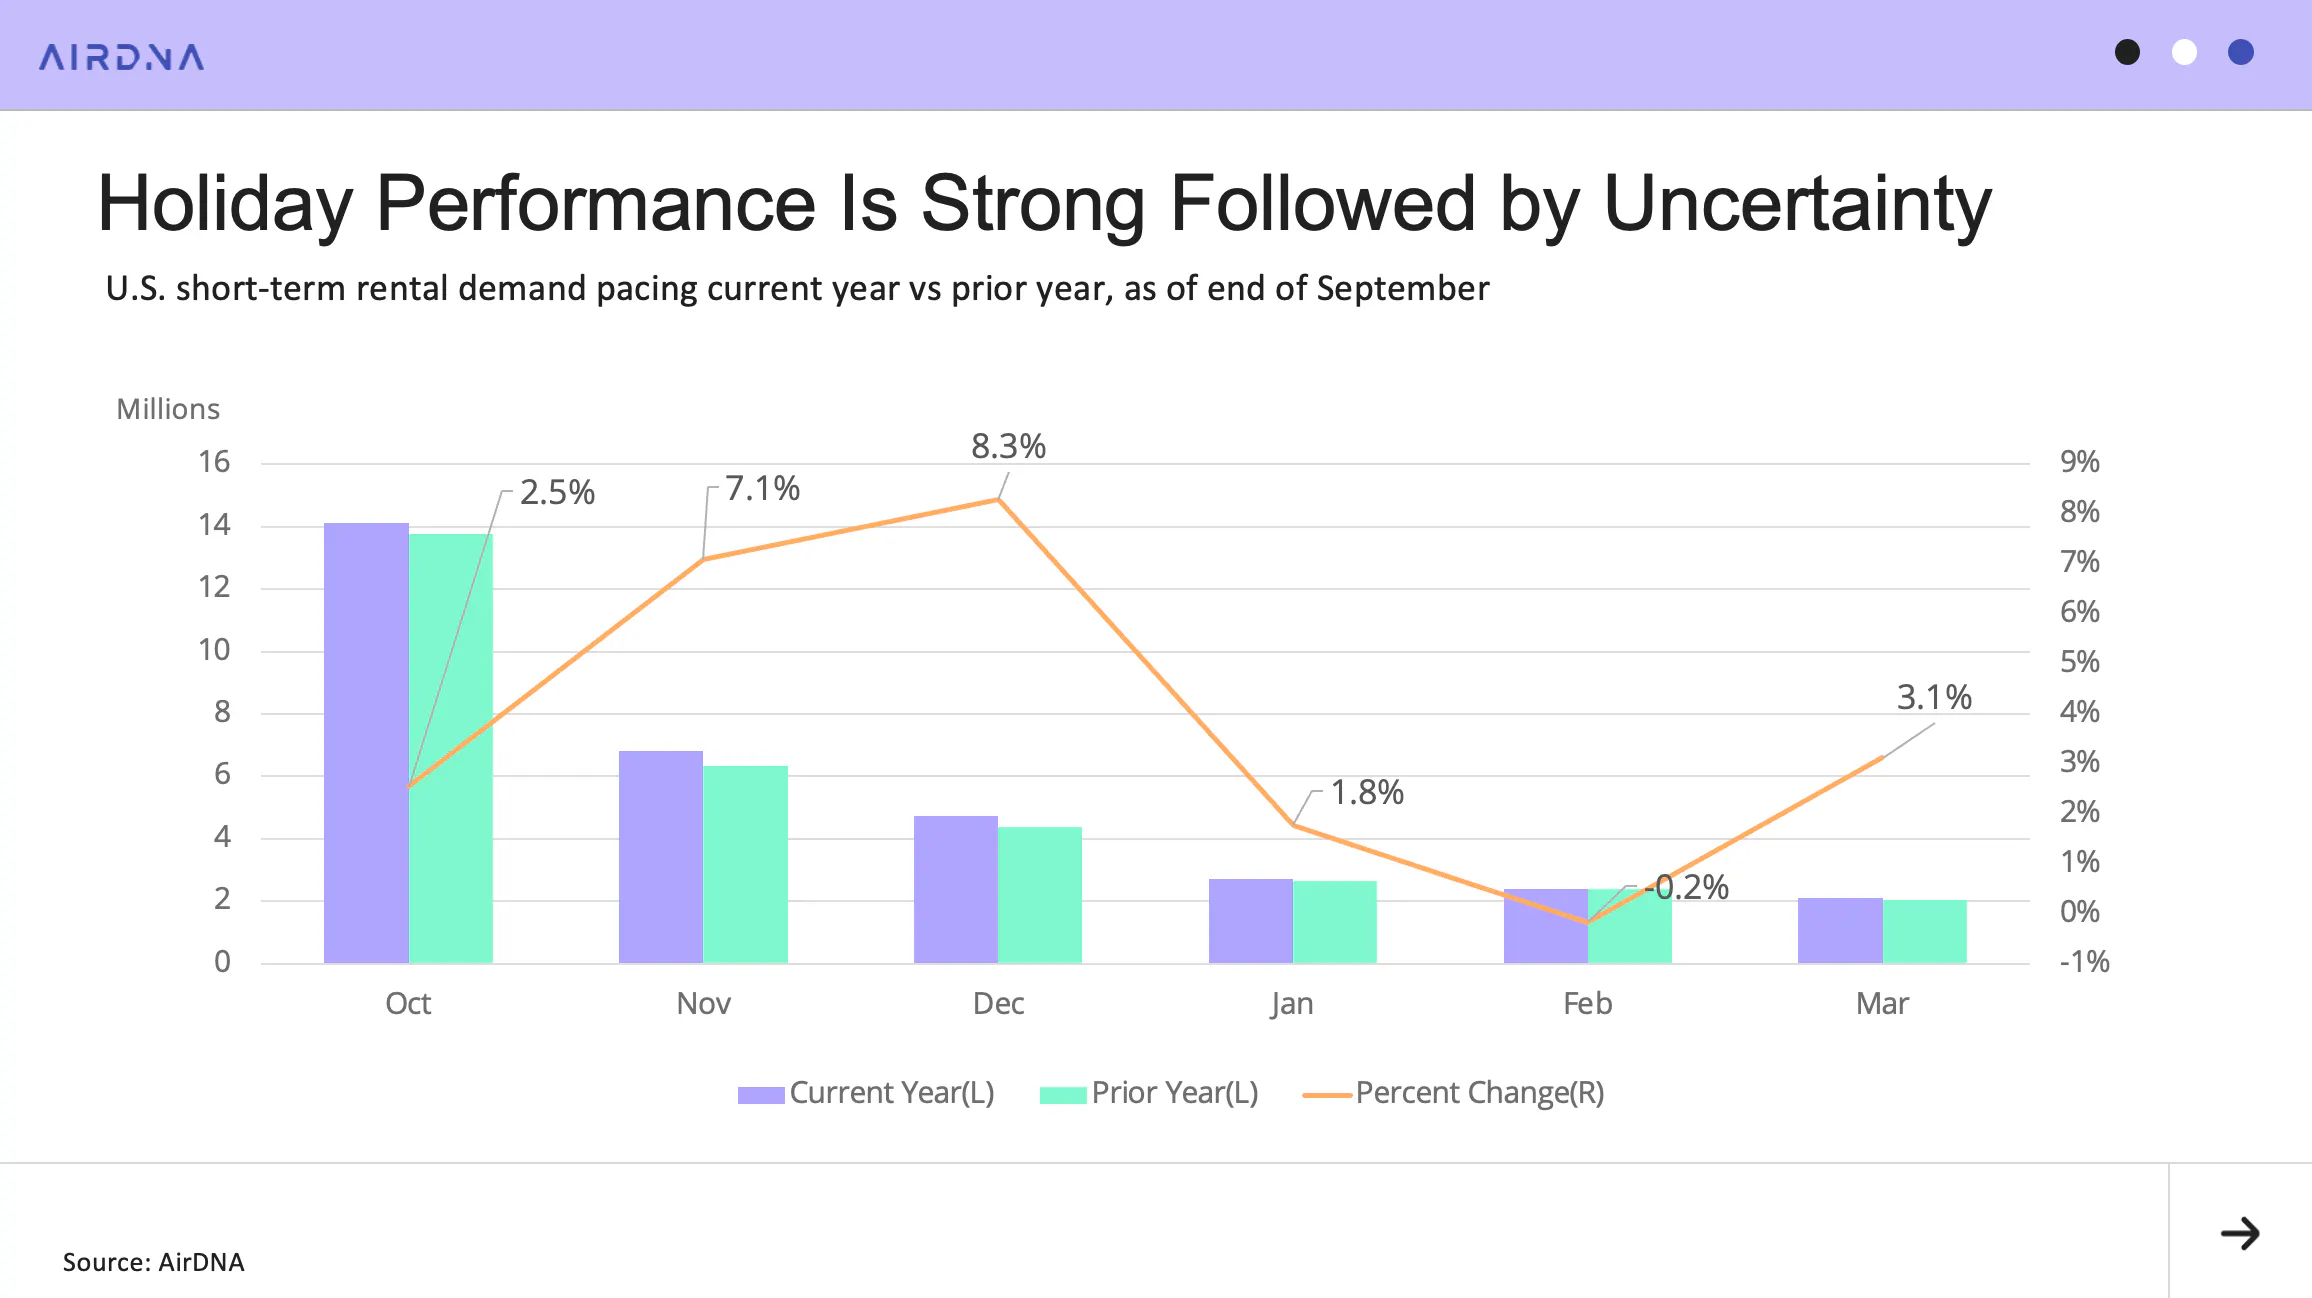
Thanksgiving weekend, in particular, is pacing exceptionally well, up as much as +14.7% compared with 2024. The preceding weekend also shows strong growth, with bookings up nearly 19.7%.
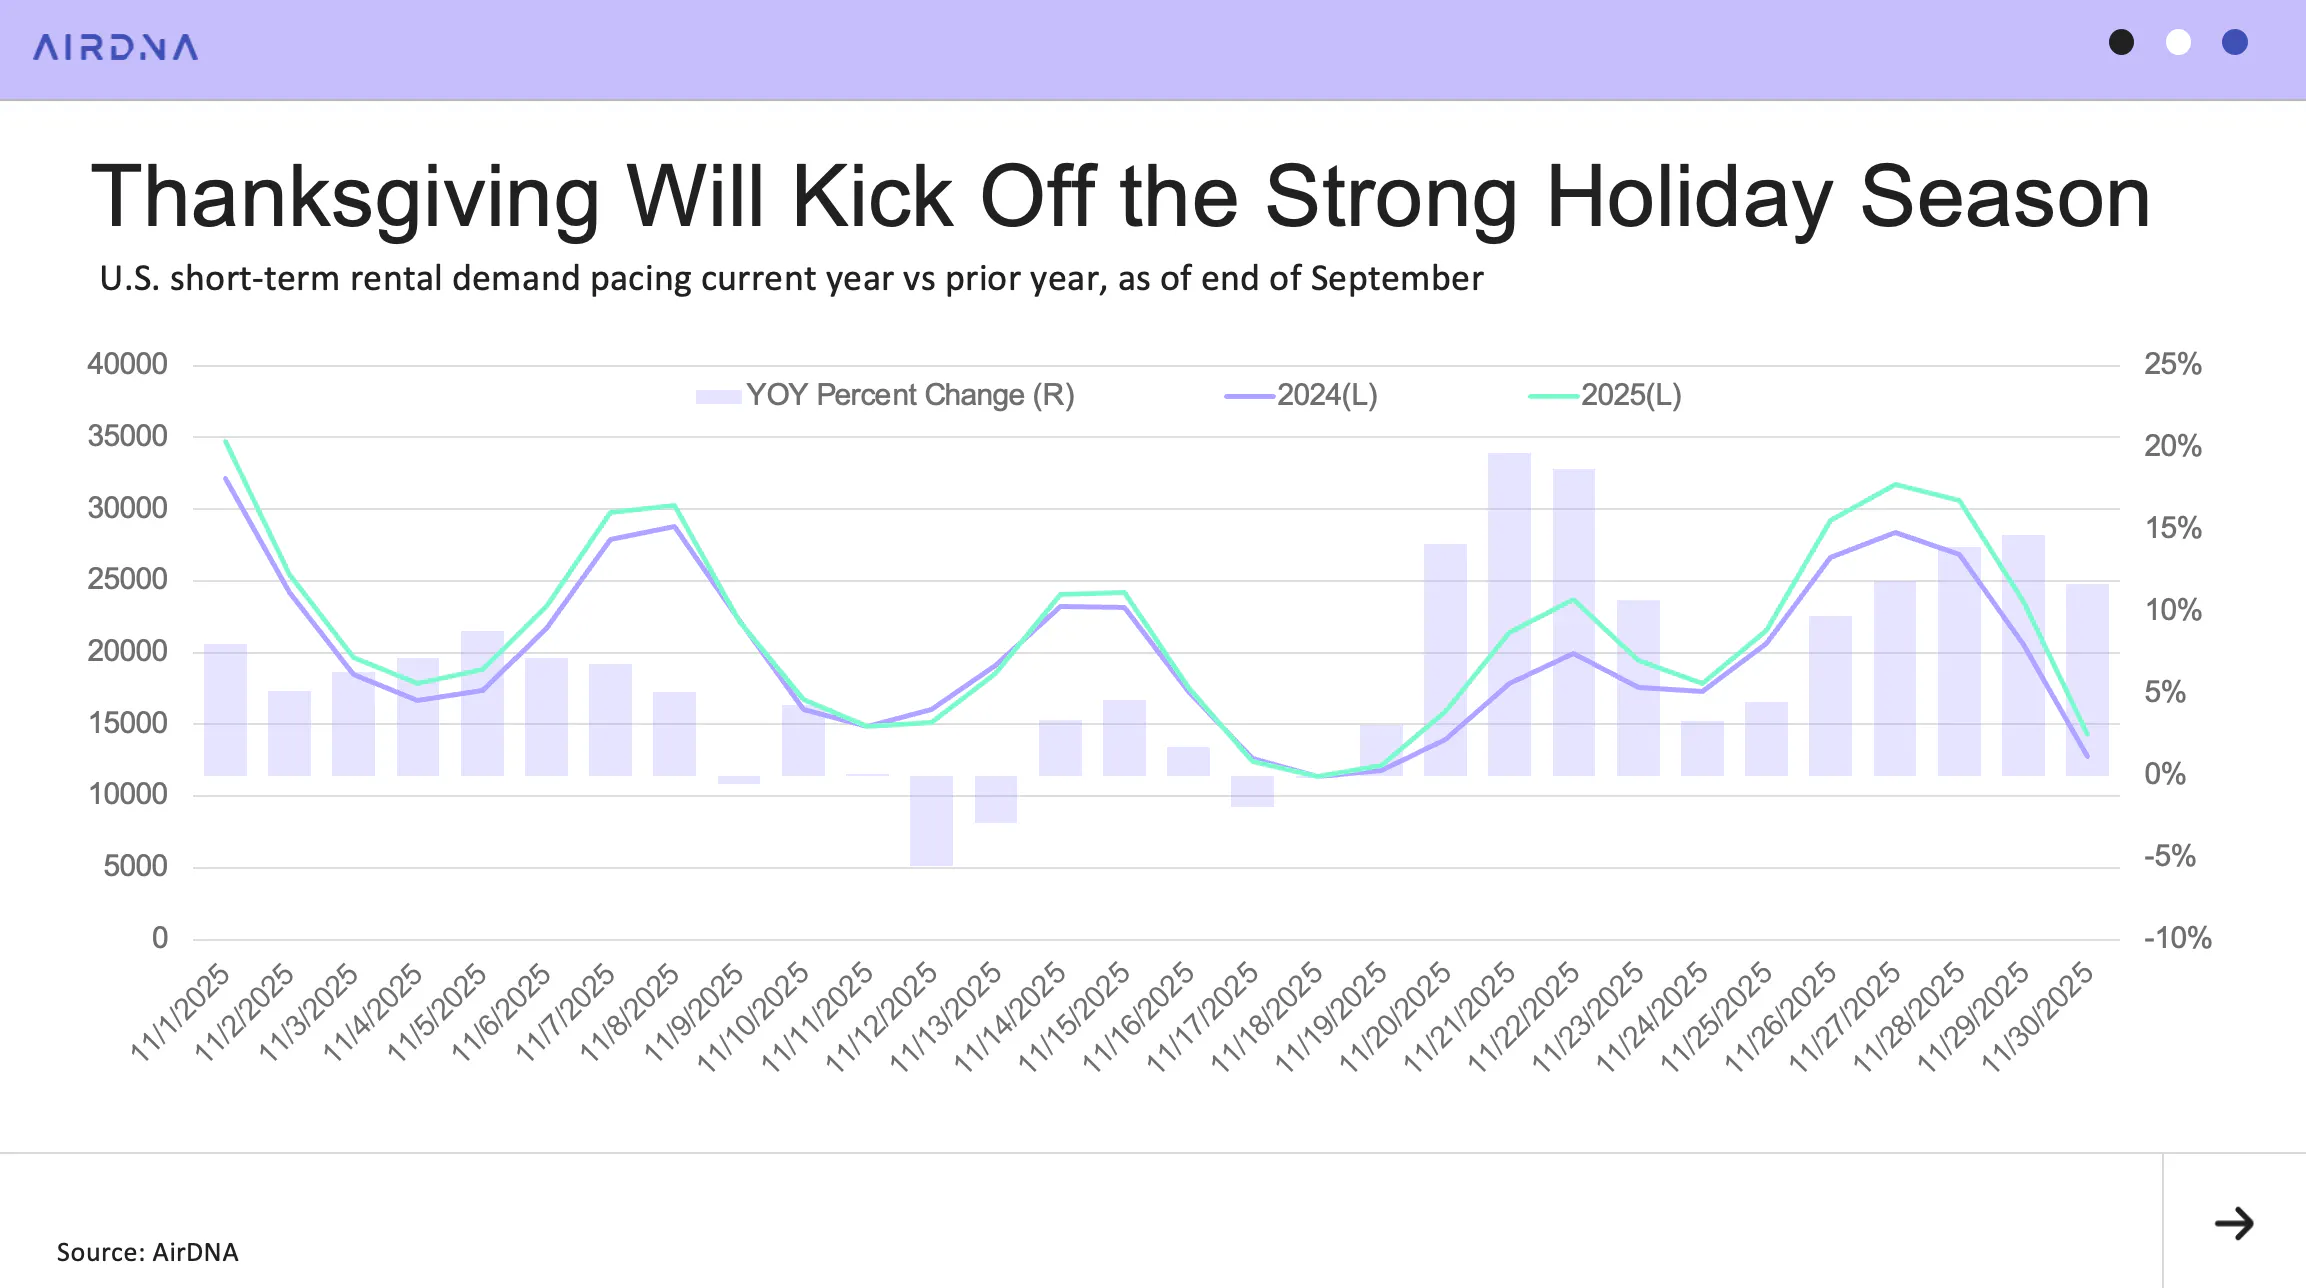
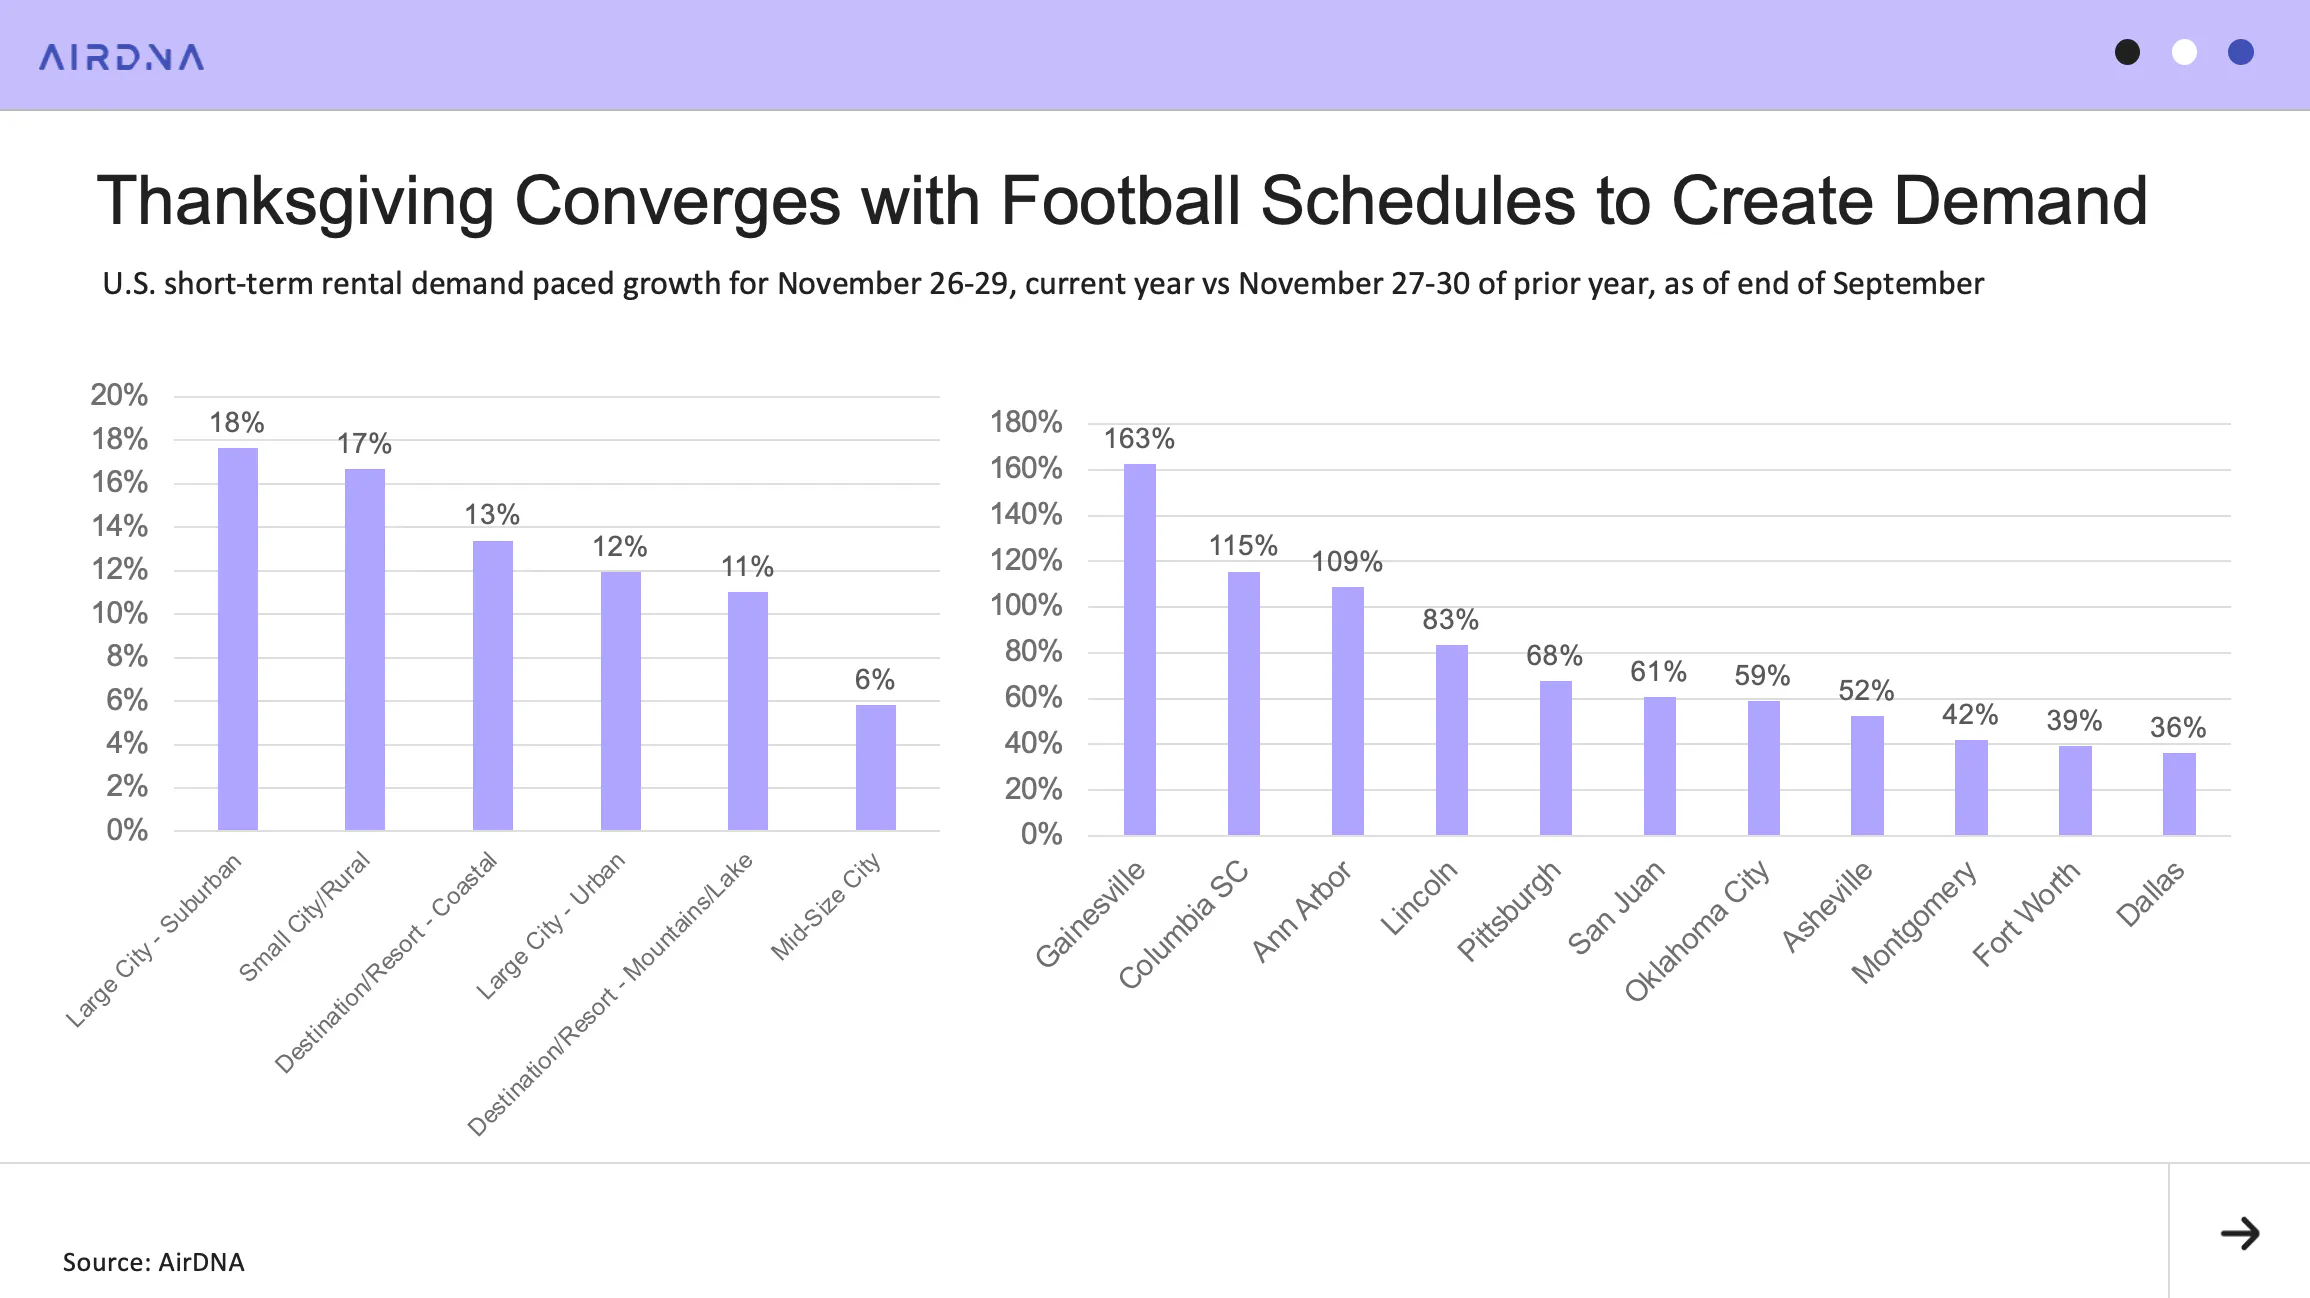
As expected, the biggest increases are in Suburban areas, where many families gather for the holidays. Small City/Rural destinations and Coastal resorts are also seeing healthy pacing, suggesting continued interest in quick getaways and late-season beach trips.
At the market level, several locations are experiencing significant swings tied to college football schedules. The relocation of major rivalry games is contributing to sharp weekend demand spikes around November 29. This includes Florida vs. Florida State in Gainesville, South Carolina vs. Clemson in Columbia, and Ohio State vs. Michigan in Ann Arbor, is contributing to sharp weekend demand spikes around November 29.
Leaf Peeping Is in Full Swing
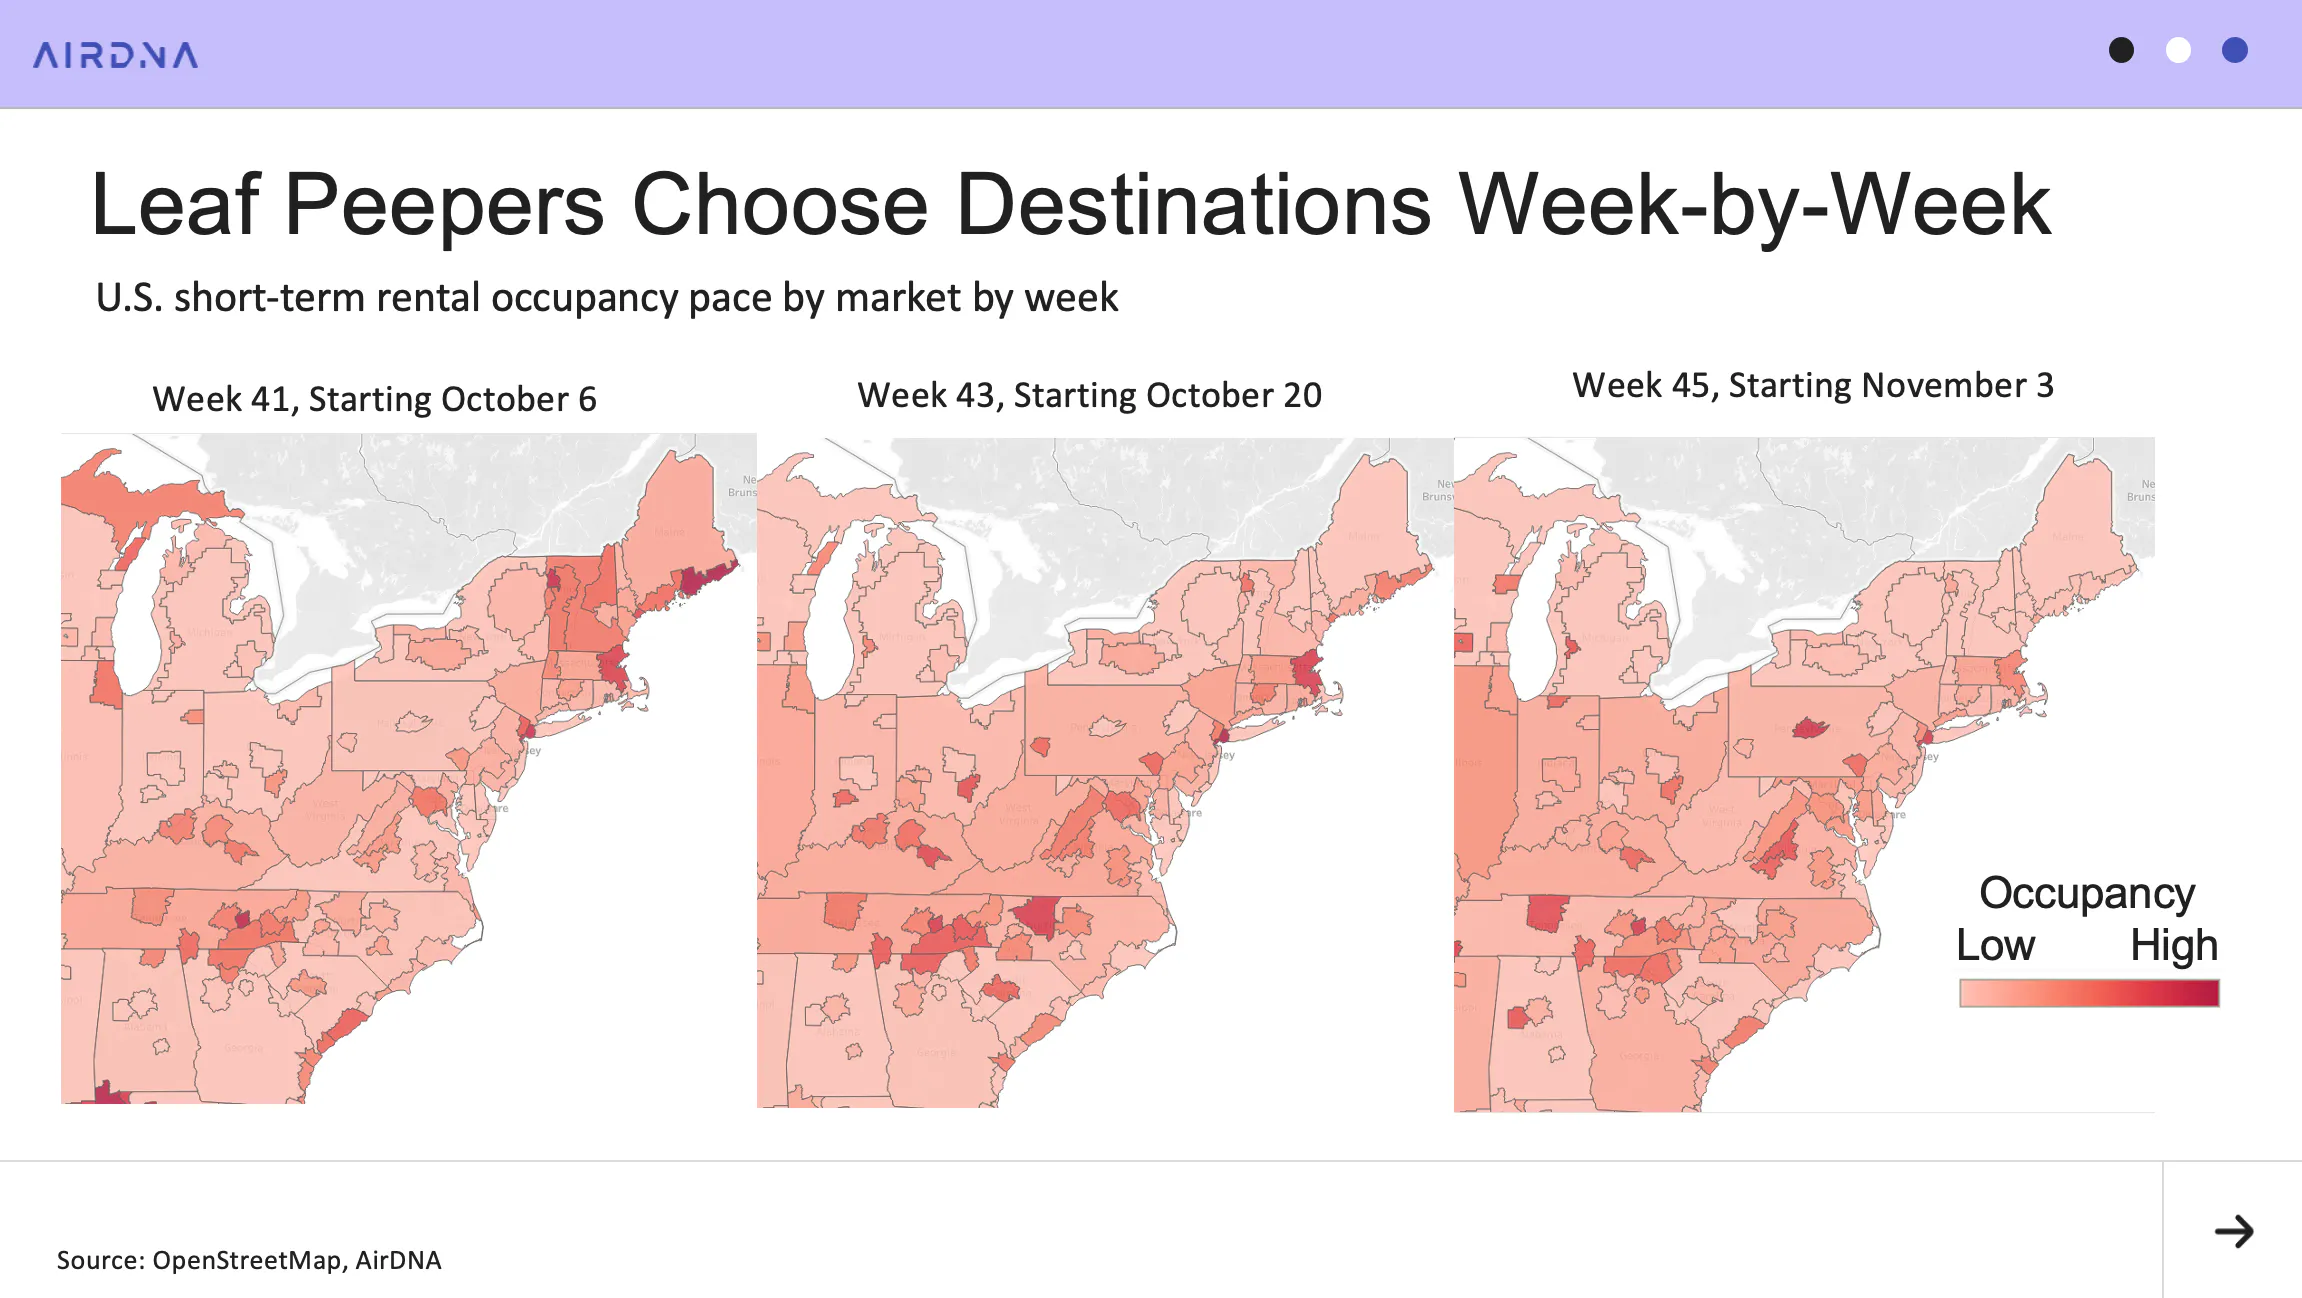
Finally, the Fall leaf-peeping season is well underway. Although a great opportunity to showcase the natural beauty surrounding rentals, the timing of the season transpires quickly. In the first half of October, northerly markets such as the Maine Coast; Burlington, Vermont; the White and Green Mountains, and Boston have a significant occupancy advantage. Michigan's Upper Peninsula also sees interest.
As the month wears on, New England loses significant occupancy. The exception is Boston, which retains elevated occupancy. The second half of October sees demand spread South and West, with Lancaster, Pennsylvania; Washington, DC; the Shenandoah Valley; and the Red River Gorge, Kentucky seeing uplift. Occupancy also heats up in the North Georgia mountains and North Carolina mountains.
By November, peeping North of Maryland is essentially over, as demand continues moving South to markets such as Lynchburg and Charlottesville in Virginia and Nashville and Chattanooga in Tennessee. Gatlinburg/ Pigeon Forge is also popular throughout this entire period.
ARTICLE SUMMARY
In September 2025, the U.S. short-term rental market saw slower growth as demand dipped slightly year-over-year and supply expansion eased to its lowest level of the year. Rising nightly rates kept revenue steady, while strong holiday pacing points to a potential rebound heading into year-end.
Bram Gallagher
AirDNA Director of Economics and Forecasting
Bram Gallagher is an Economist at AirDNA, specializing in uncovering insights that drive smarter short-term rental decisions. He put his Ph.D. in Economics from the University of Georgia to work researching and forecasting hotel data with CBRE prior to joining AirDNA, as well as teaching economics at a number of universities. In his spare time, Bram enjoys making wooden furniture with hand tools.