What Three Wildfires Did to Short-Term Rental Demand
Published: September 1, 2026

Camilo Schmid Rivas
Natural disasters don’t affect short-term rentals in one uniform way, and the differences matter for anyone planning around them as well as for the hosts operating in affected markets.
AirDNA’s analysis of Hurricanes Helene and Milton found that storms disrupt supply for a long time while creating demand somewhere else in the meantime. Short-term rentals became emergency housing: in the week after Hurricane Ian made landfall, Florida, Georgia and South Carolina together recorded roughly 20,000 additional bookings a day, and metro Atlanta absorbed spillover from displaced residents after Helene. Recovery on the supply side ran long, from 18 months to two years in most markets, and close to six years in Mexico Beach, Florida.
Wildfires behave differently. We looked at three fires in the summer of 2026 using AirDNA daily data: the fires in the Gironde in France, the Okanagan Lake fire in British Columbia, and the Sierra de Gredos fire in the hills west of Madrid. In all three, the demand didn’t move to a neighboring market. It came off the calendar, and in France it pulled the nearest city down with it.
Key takeaways
- Wildfires don’t redirect short-term rental demand to nearby markets the way hurricanes do. They remove it from the calendar, and the “safe” city next door gets hit too.
- Cancellation rates in affected markets ran from roughly 20% to well above 100% in a single week, turning net bookings negative.
- The Gironde lost 31.2 points of occupancy attributable to the fire once seasonality and the national trend are stripped out.
- Recovery varied from 11 days to not having started, and peak-season patterns make raw recovery look faster than it is.
- Occupancy alone would have misled us in two of the three markets, because supply moved in opposite directions.
How we measured it
Comparing a fire week to the week before it isn’t enough on its own, because these markets are climbing into peak season anyway. So we run the comparison three ways.
First, we measure the change from the week before the fire to the fire week. Second, we measure the same week-to-week change in 2025, which tells us what those calendar dates normally do. The difference between the two strips out seasonality. Third, we run that same two-step comparison for the country as a whole. If occupancy across all of France had slipped that week, a fire in the Gironde wouldn’t be the explanation, so we take the national change off the local one and keep the difference. What survives all three checks is the share of the move we can reasonably attribute to the fire, and it’s the figure we quote below.
We also assign a control market for each fire: somewhere close enough to share the same weather and the same season, but far enough from the fire to be untouched. For the Gironde that’s the Landes coast immediately to the south. For Okanagan Lake, it’s Big White and Silver Star, two resorts inside the same region but away from the water. For the Sierra de Gredos, it’s the Sierra de Guadarrama, the next range to the north. If a control moves with the affected market, the cause isn’t the fire.
Occupancy alone would have misled us in two of three markets, so we report demand and supply alongside it. In areas where supply increases, occupancy figures tend to exaggerate the actual damage. Conversely, when listings are removed from online platforms, the damage appears understated.
The impact, fire by fire
Gironde, France: a cancellation rate above 300%
Occupancy across the 13 affected communes tracked 2025 closely until 25 July, then fell 27 points in six days, from 78.3% to a low of 51.2% on 31 July. Running that drop through the three checks turns it into a figure we can attribute.
First, week to week: occupancy in the peak week came in 21.6 points below the week before the fire. Second, against the same dates a year earlier: in 2025 that week rose 9.9 points, because early August is when these markets fill, so the swing away from the normal path is nearer 31 points than 21.6. Third, against the country: France moved 0.2 points over the same dates, so almost none of this is countrywide. That leaves 31.2 points of occupancy attributable to the fire.
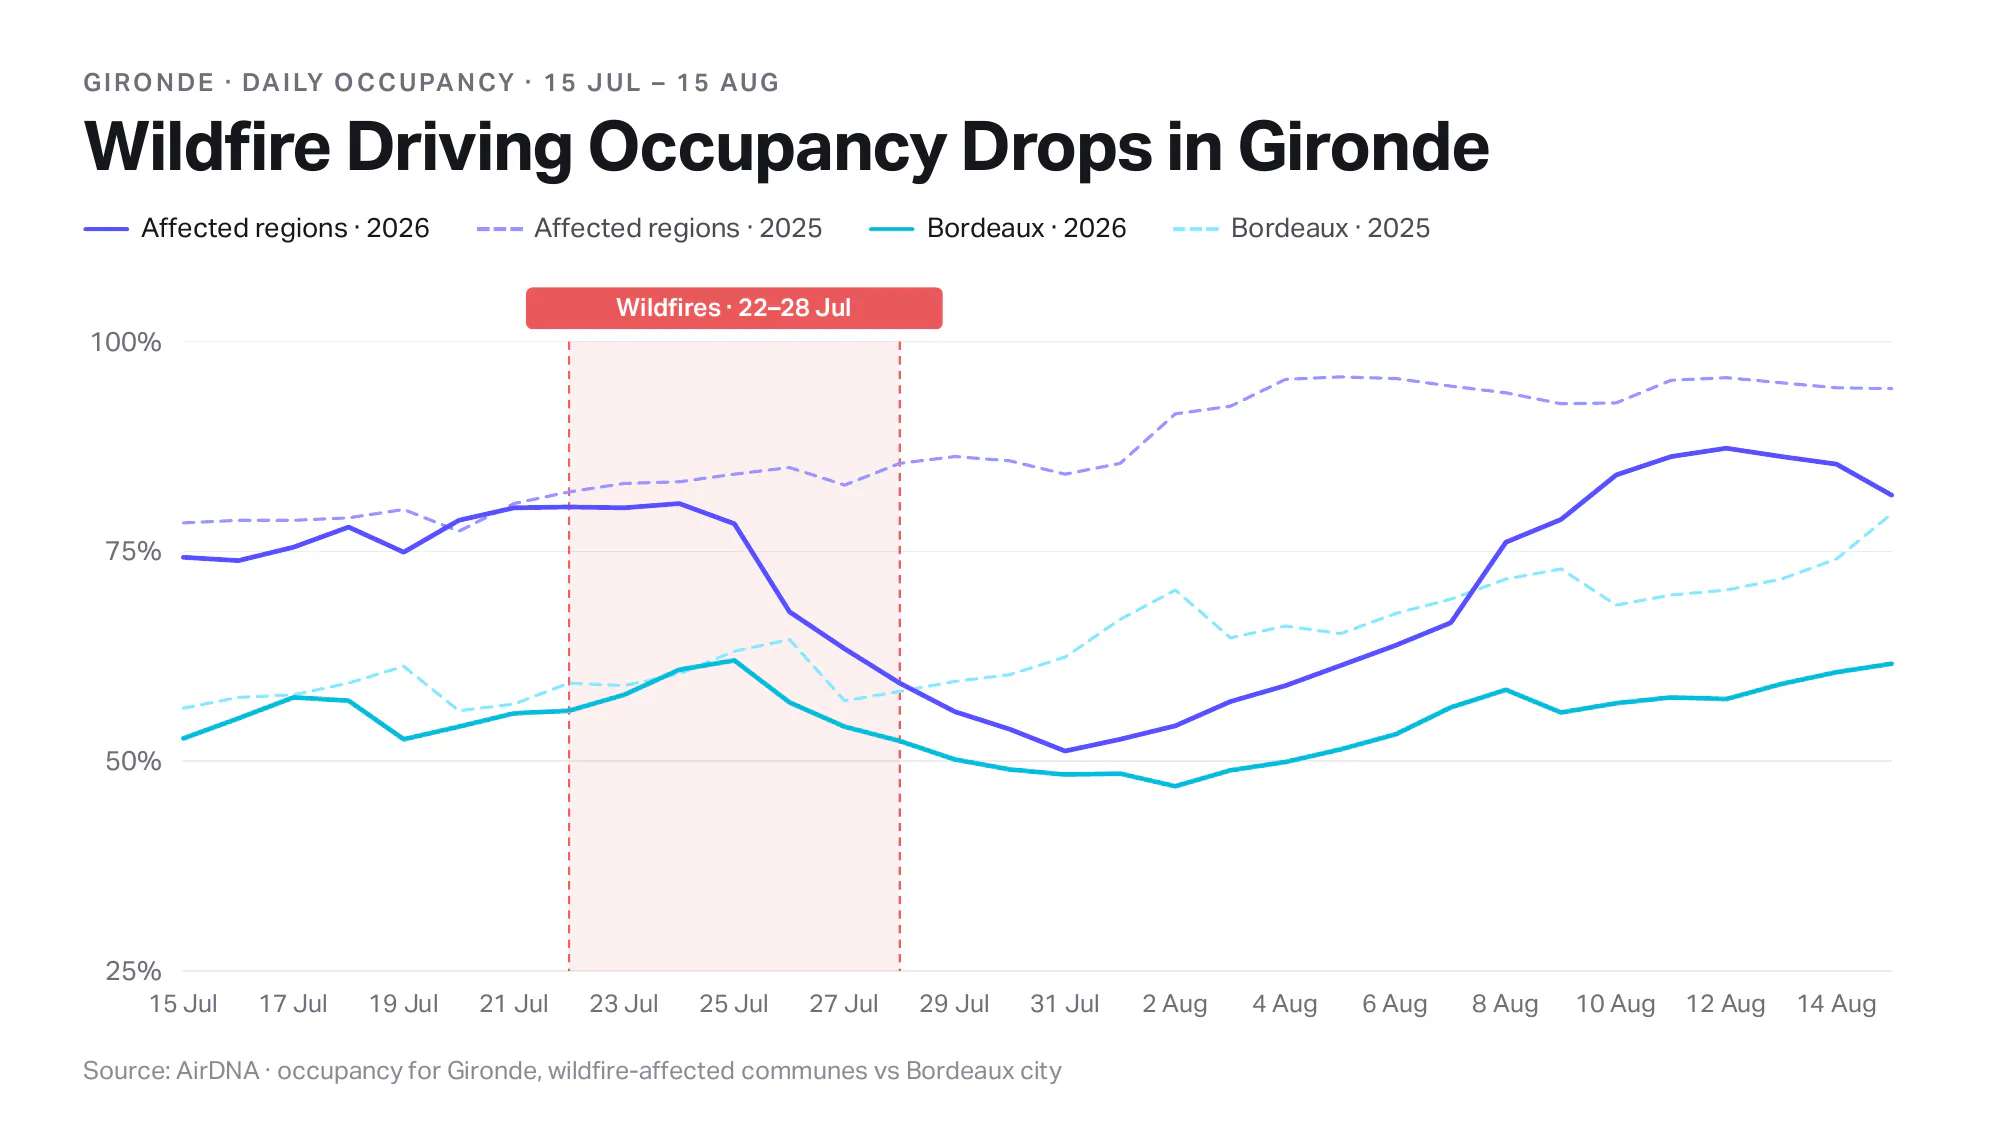
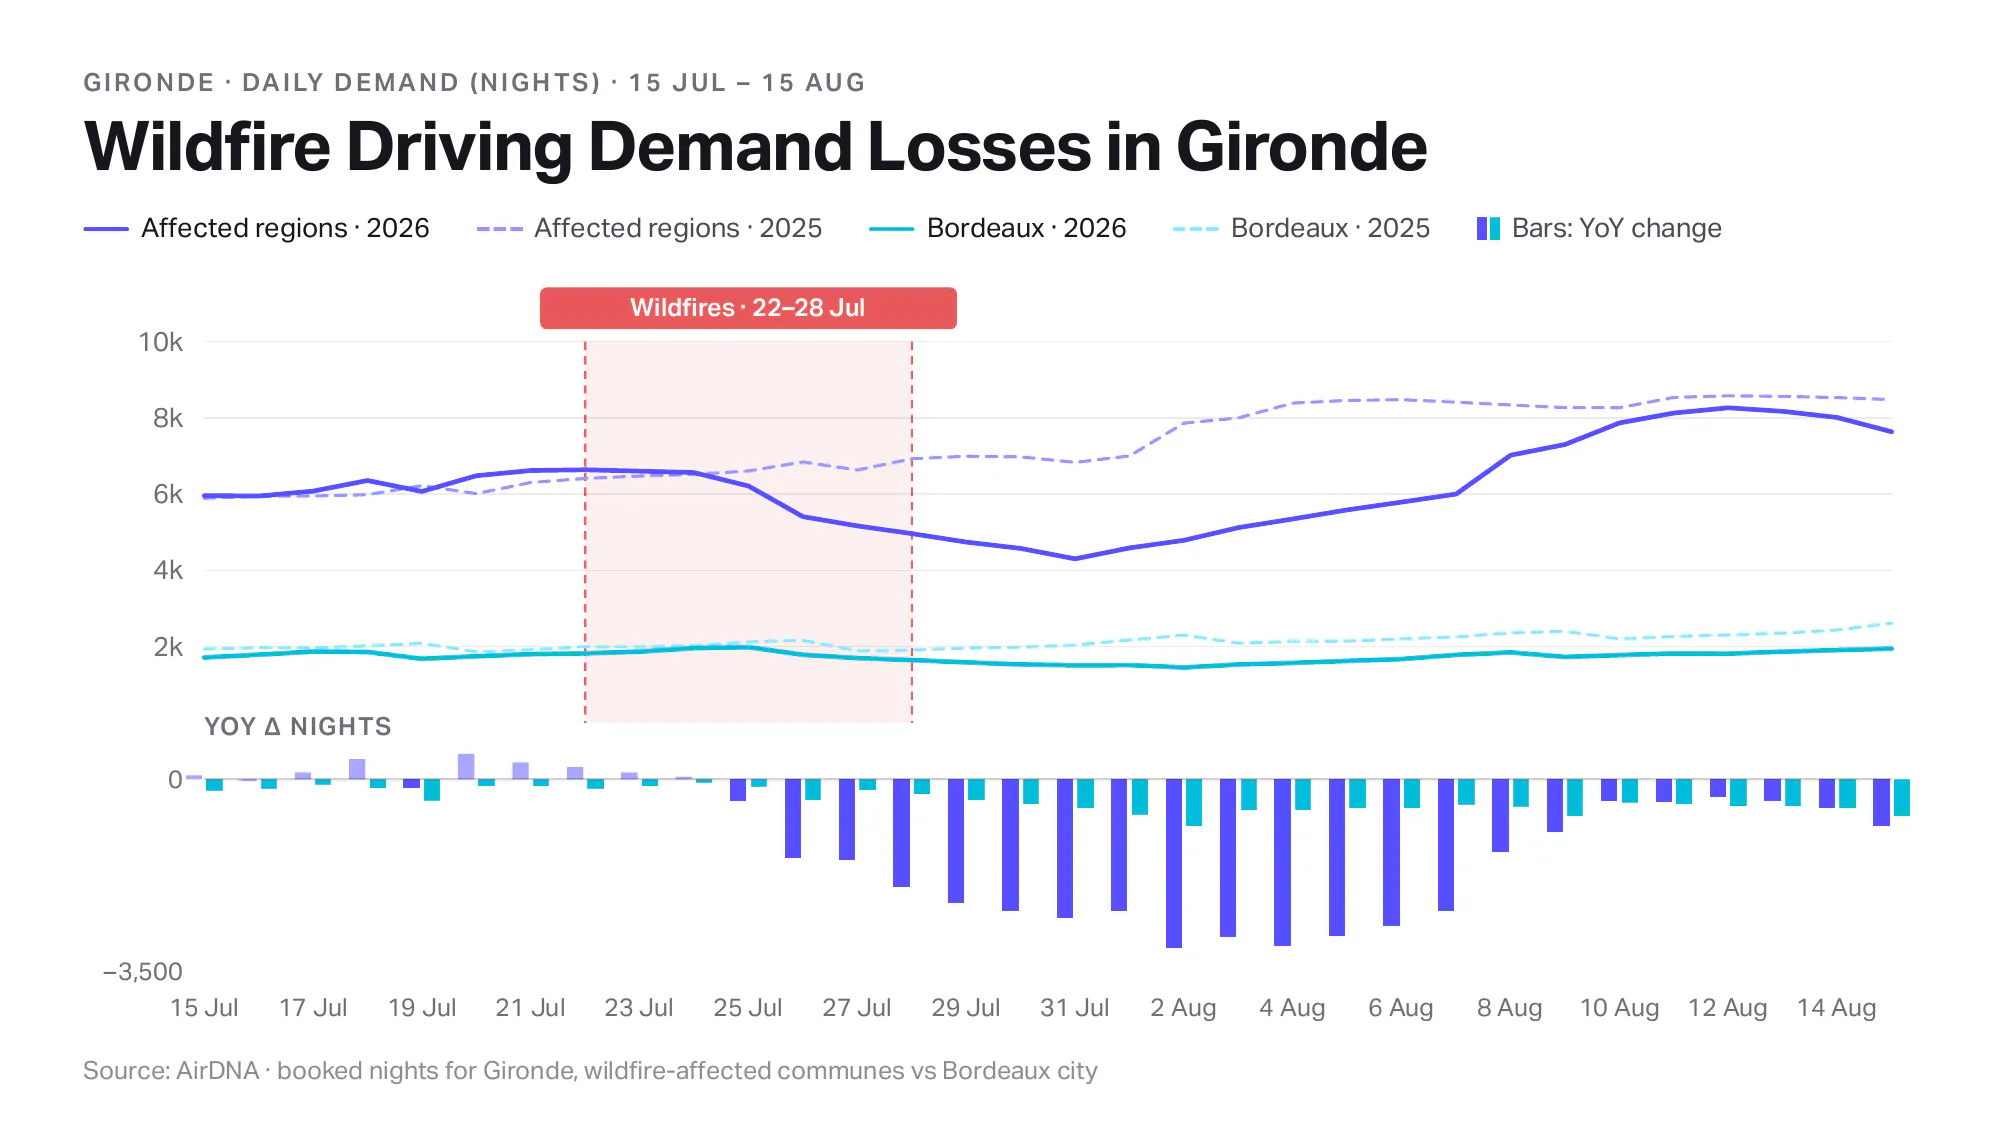
Demand tells the same story on its own scale: bookings for those nights fell 23.1% week on week, whereas the year before they rose 23.0%, which puts demand 45.5% below its normal path. In level terms, the peak week ran at 54.9% occupancy against 88.8% a year earlier, a gap of 34 points.
Cancellations tell it more starkly. We measure the rate as cancelled nights, dated by cancellation, over gross nights booked, dated by booking. The rate went from 21.4% to 328.7% in one week, and net nights booked fell by 28,924. A rate above 100% is not an error. It occurs when cancellations from many previous months happen simultaneously while new bookings decline.
One thing complicates the headline. Supply grew rather than shrank: hosts didn’t take listings down, and available listing nights rose 7.2% during the fire week. Since occupancy divides demand by available supply, a growing base drags the rate down faster than lost bookings alone would, which is why demand is the cleaner read on what the fire actually did.
Okanagan Lake, British Columbia: a clean natural experiment
The south lake around Penticton, British Columbia lost 36.2% of its demand and 31.6 points of occupancy. Cancellations reached 151.9% for the fire week.
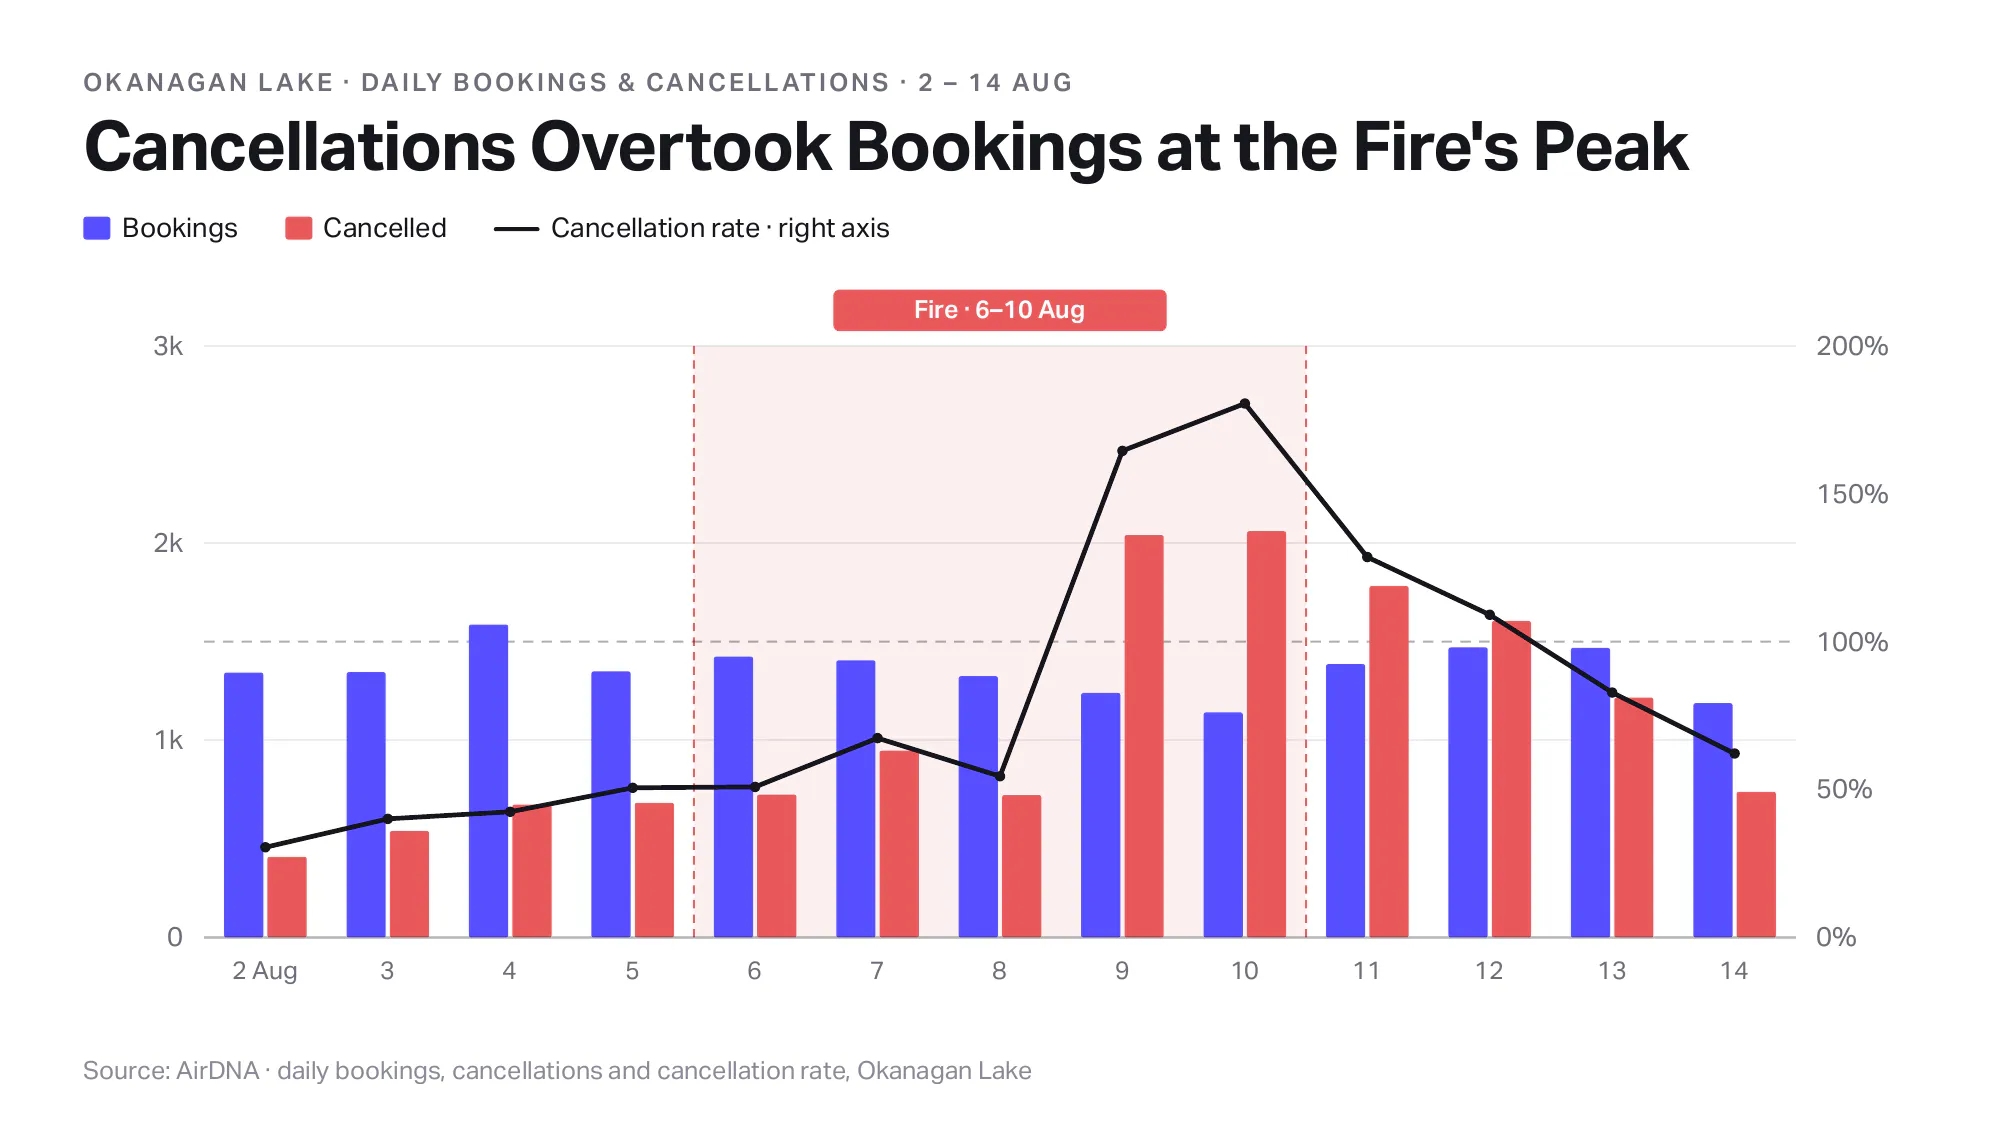
The cleanliness of this case comes from the control. Big White and Silver Star are in the same region but in mountain areas rather than near water, and they came through the fire week within 0.3 points of their normal occupancy path. Their season carried on as if nothing had happened, which rules out heat, weather, or anything else affecting the wider region.
Attributable occupancy loss then fades with distance from the water: the south lake was down 31.6 points, the Kelowna area down 24.7, the unincorporated lakeshore down 20.6, Vernon and Coldstream down 12.5, and the mountain resorts were flat.
Sierra de Gredos, Spain: the mildest hit and the most misleading number
Occupancy in the Gredos and Alberche valley fell only 6.0 points on the same basis, the mildest of the three fires by a wide margin. Demand fell 15.7%.
The gap between those two measures is the finding. Listings went offline during the fire, supply contracted by 4% to 6%, and a shrinking denominator props up the occupancy rate. Quote demand here, not occupancy. Cancellations reached 86.4%.

Wildfire displacement is not comparable to other natural disasters
The intuitive story, and the one the hurricane data supports, is that displaced guests rebook nearby. Across these three fires it either didn’t happen, couldn’t have been detected, or happened somewhere the obvious test doesn’t look.
Bordeaux was damaged itself. Bordeaux, France was the obvious candidate to absorb the Gironde coast. Instead it lost 12.4 points of occupancy and 20.3% of demand, and its own cancellation rate hit 41.2%. Even without damage, it couldn’t have absorbed the shock: the affected communes lost 20,072 demand nights during the peak week, nearly double Bordeaux’s total weekly demand of 10,709.
Madrid was too large to register it. The Sierra de Gredos lost 474 demand nights, against Madrid’s 52,320 a week. Even if every displaced guest had rebooked in Madrid, the city would have moved 0.9%, which is well inside its normal noise. That’s a limit of the test rather than a finding: we can’t say displacement didn’t happen here, only that a market this size could never have shown it.
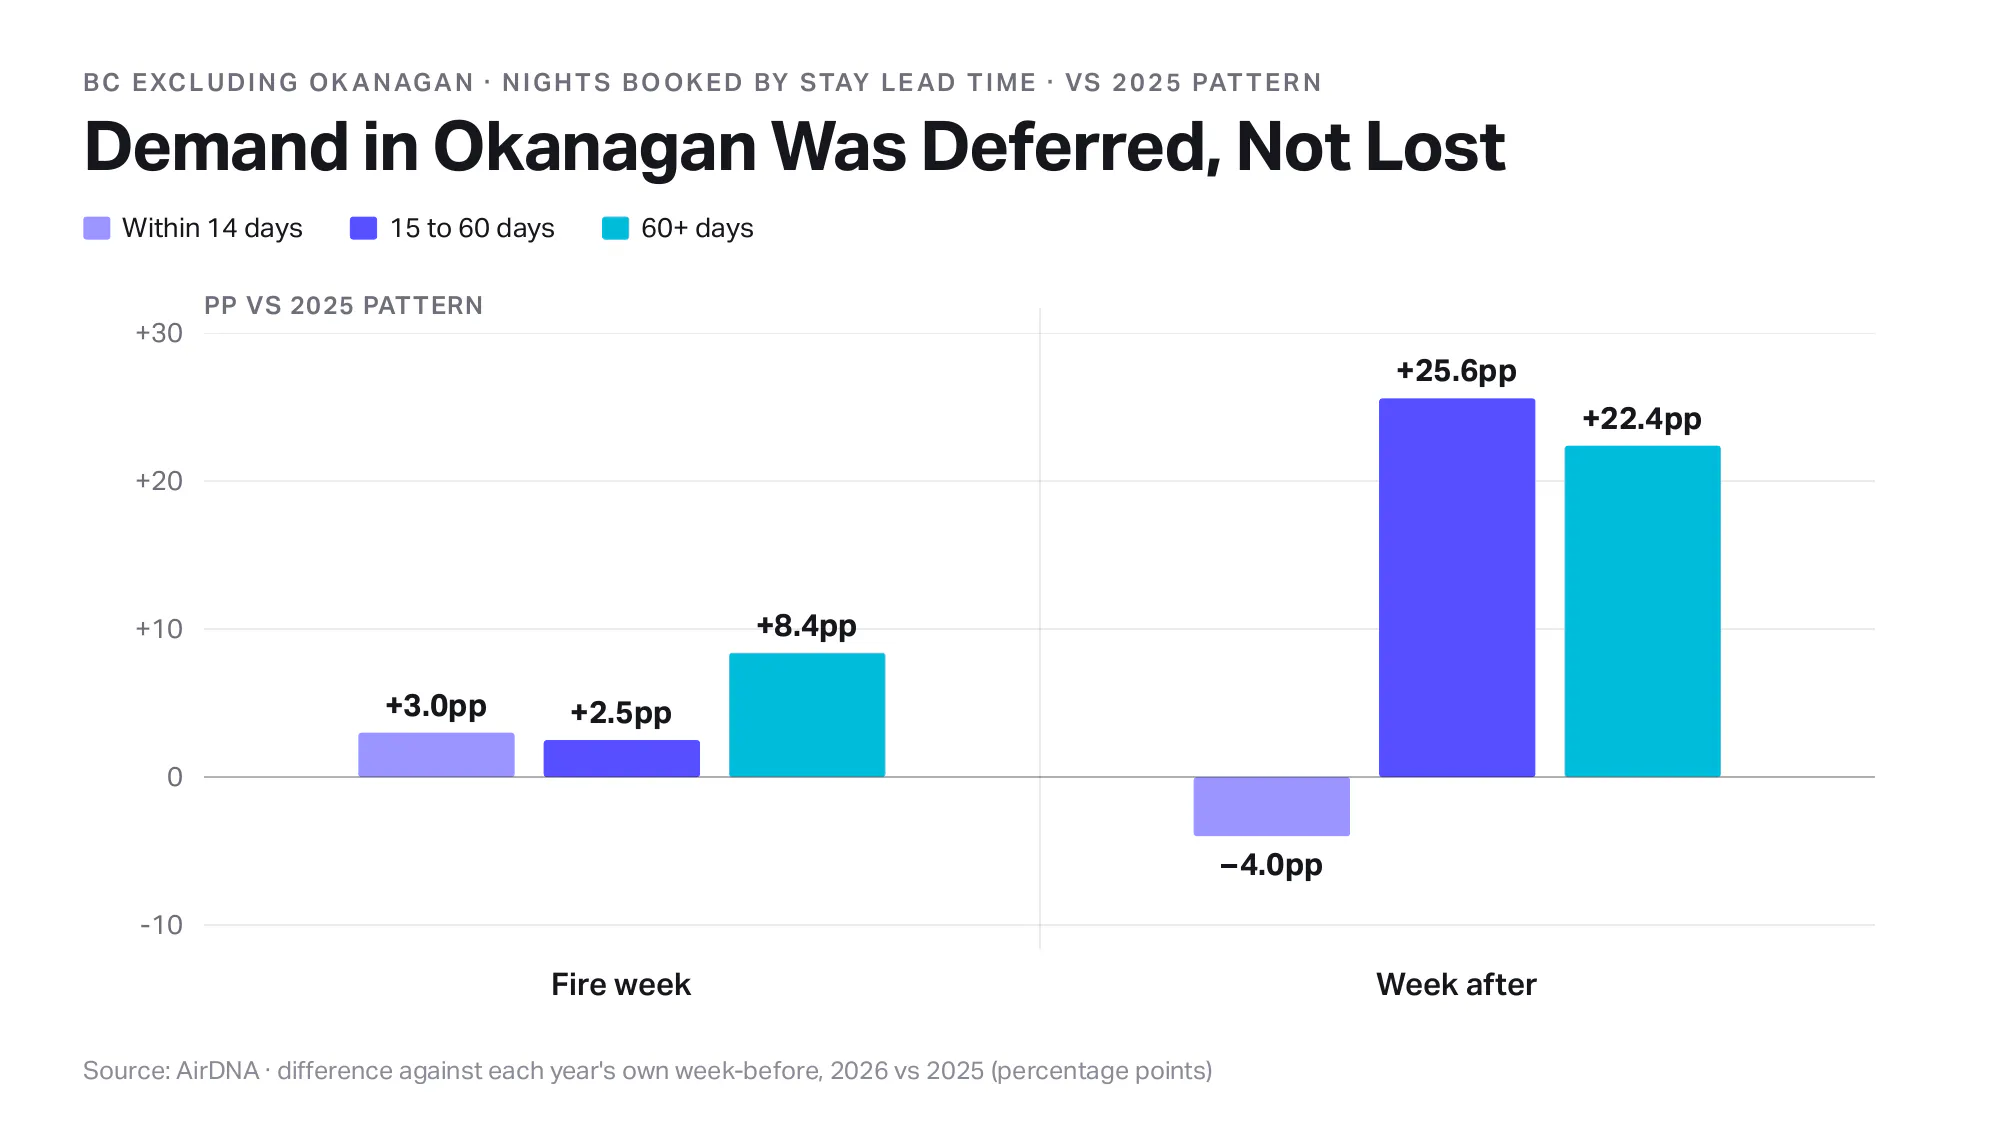
British Columbia sent the demand to later dates. Same-week demand across the rest of the province didn’t move, which on its own reads as no displacement at all. But bookings made in the week after the fire, for stays 15 to 60 days ahead, ran 25.6 points above the 2025 pattern, and those for stays 60 days or more ahead ran 22.4 points above it. That suggests demand was deferred rather than lost. During the fire week itself the gaps were far smaller, at 2.5 and 8.4 points, which is why the timing of the comparison matters.
Why these fires differ from the hurricanes
The useful comparison here is a narrow one: people displaced by these three fires against people displaced by Helene, Milton and Ian. This isn’t a general law about wildfires and hurricanes, and two specific differences between those two sets of events explain most of the gap.
The first is how much housing came out of use. The storms took a large share of the housing stock offline for a long time, which is what turned displaced residents into paying guests over months: available listings fell 20% year on year in Panama City, Florida, 23.3% in Cape Coral and Fort Myers, 77.1% in Sanibel, and 80% in Mexico Beach. Nothing close to that happened in our three fire markets. Supply in the Gironde and the south Okanagan actually grew slightly during the fire week, and the Gredos, the only market where listings did come offline, lost 4% to 6%. Whatever these particular fires destroyed, it wasn’t enough housing to generate sustained local rental demand.
The second is the market those evacuees walked into. Our hurricane work found that displaced Florida residents weren’t competing with vacationers, because October is the panhandle’s off-season. Two of these three fires landed in the opposite conditions: the affected Gironde communes were running at 76.5% occupancy the week before, and the south Okanagan at 85.7%, both at peak-season rates. There was little slack to absorb anyone, and the only inventory freeing up sat inside the evacuation zone itself.
On the visitor side the mechanism is simpler and doesn’t rest on the comparison at all. A fire cancels a trip rather than relocating it. Nobody rebooks a coastal holiday inland while the region is under smoke and road closures, so the booking is refunded and the traveler stays home.
Recovery patterns
What we look for
It’s easy to declare recovery prematurely. Four factors distinguish a genuine recovery from a seasonal one.
- The trough, not the first good day. Recovery has to be measured forward from a market’s low point, not from the day the fire started. These declines were slow and uneven: the eight markets we tracked bottomed out anywhere from 5 to 12 days after ignition, with Bordeaux taking 11 days. Measure from the fire date instead, and a market that hasn’t finished falling can drift back above its pre-fire level, look recovered, and then drop again. That’s a false positive, not a recovery.
- A counterfactual, not the pre-fire week. These are peak-season markets. The Gironde ran 79.0% to 94.4% occupancy across the same weeks in 2025, so returning to its mid-July level is a much lower bar than returning to where it should have been in early to mid August.
- Supply as well as demand. A market can post healthy occupancy while listings are still missing, which makes it important to track available listings alongside the occupancy rate.
- Forward bookings. If later dates are refilling, demand was deferred rather than lost, and the revenue arrives in a different month.
What we’ve seen
The three fires recovered at very different speeds, and the pattern echoes what the hurricane data shows: intensity and recovery vary sharply between adjacent communities.
The Sierra de Gredos recovered fully in 11 to 12 days, finishing level with the Guadarrama next door. The Gironde regained its pre-fire occupancy in 15 to 17 days, but measured against the Landes coast it was still about 3 points short a month after the fire, and Bordeaux recovered the slowest of any French market we looked at. The Okanagan hadn’t recovered on any measure. With the fire starting on 9 August and settled data ending on 21 August, there are only twelve days to judge by, which isn’t enough to call it either way.
What this means if you operate in a fire-prone market
- Model the demand hit, not just the property risk. Thirty points of occupancy for two to four weeks of peak season is a bigger number than most financial plans carry, and it has to be accounted for when underwriting a short-term rental in a high-risk zone.
- Don’t treat a nearby market as a hedge. If your diversification strategy is rentals 60 kilometers inland, it isn’t diversification. As we saw, most French markets moved together.
- Watch forward bookings, not just this week’s occupancy. In British Columbia the demand still arrived, but it had shifted to later dates.
- Position for short-notice local demand. Flexible booking, longer stays and pet-friendly policies are what evacuees look for, and that demand lands inside two weeks.
You can track daily occupancy, demand and forward pacing for any market in your AirDNA account.
FAQs
Do wildfires increase short-term rental demand the way hurricanes do?
No. Across the three 2026 fires we analyzed, demand came off the calendar rather than moving to a nearby market. The difference from hurricanes comes down to housing loss and seasonality: the storms took 20% to 80% of listings offline for months, turning displaced residents into long-stay guests, while these fires removed almost no housing and landed in peak season when neighboring markets had no slack.
How much occupancy can a wildfire cost a short-term rental market?
In the Gironde, 31.2 points of occupancy were attributable to the fire once seasonality and the national trend were stripped out. The south Okanagan lost 31.6 points and the Sierra de Gredos 6.0 points. The loss fades with distance: around Okanagan Lake it ran from 31.6 points at the south lake to flat at mountain resorts in the same region.
Can a cancellation rate really be above 100%?
Yes. We measure it as cancelled nights, dated by cancellation, divided by gross nights booked, dated by booking. When cancellations from many earlier months land in one week while new bookings dry up, the ratio exceeds 100%. The Gironde reached 328.7% and the south Okanagan 151.9%.
Why look at demand instead of occupancy after a wildfire?
Because supply moves too, and it moves in different directions. In the Gironde available listing nights rose 7.2% during the fire week, which drags occupancy down faster than lost bookings alone and overstates the damage. In the Gredos listings came offline and supply shrank 4% to 6%, which props occupancy up and understates it. Demand is the cleaner read in both cases.
How long does a short-term rental market take to recover from a wildfire?
It varies more than most people expect. The Sierra de Gredos recovered fully in 11 to 12 days. The Gironde regained its pre-fire occupancy in 15 to 17 days but was still about 3 points behind its control market a month later. The Okanagan had not recovered on any measure within the twelve days of settled data available. Measure from the trough rather than the ignition date, or a market still falling can look recovered.
ARTICLE SUMMARY
Hurricanes displace short-term rental demand. Wildfires delete it. AirDNA analyzed three fires in the summer of 2026: the Gironde in France, Okanagan Lake in British Columbia and the Sierra de Gredos west of Madrid, using daily data and matched control markets. In every case the demand came off the calendar rather than moving to a neighboring market, and in France the fire pulled the nearest city down with it. Camilo Schmid Rivas sets out the method, the market-by-market damage, and why the hurricane playbook does not transfer.
Camilo Schmid Rivas
Senior Research Analyst
Camilo Schmid Rivas is a Senior Research Analyst at AirDNA who brings a uniquely well-rounded perspective to short-term rental analytics. With a background that spans investment, real estate, and business analysis—including roles at Stayery and Sollers Consulting—Camilo has worn many analyst hats, each sharpening his ability to turn complex data into clear, actionable insights. A graduate of École hôtelière de Lausanne, he now channels his multidisciplinary expertise into uncovering trends that drive smarter STR decisions. In his free time, he enjoys playing tennis or scuba diving in or around Barcelona.