

 Calculate Revenue
 Research Markets
 Find For Sale Properties
 Compare My Listing
 STR Revenue Calculator
 Custom Comp Sets
 Submarket Insights
 Custom Search Filters
 Rate Recommendations
 Performance Benchmarking
 Competitor Comparison
 Owner Contact Details
 Property-level performance data
 Tourism Insights
 Real Estate Investment Analytics
 About Us
 Sales
Sales Support
 Press
PressCanadian Travelers Are Pulling Back From U.S. STRs
Published: May 21, 2026
Last updated: August 31, 2026

Bram Gallagher
Key Takeaways
- Canadian demand for U.S. short-term rentals remains sharply down, with Q1 2026 demand nights falling 27% year over year and 32% compared to Q1 2024.
- Border and drive-to destinations saw the steepest declines, particularly across the Northeast and Pacific Northwest, while traditional fly-to destinations like Florida and Hawaii held up better.
- Markets still attracting Canadian travelers tend to offer a clear reason to visit, whether that’s warm weather, events, outdoor travel, or strong value compared to more casual cross-border trips.
Canadian travel demand for U.S. short-term rentals has shifted dramatically over the past year. What began as a sharp decline in 2025 has now extended well into 2026, with many markets continuing to see substantial drops in Canadian demand nights.
But the pullback hasn’t been evenly distributed. Some of the biggest declines are showing up in border and drive-to destinations, while a smaller group of fly-to leisure and event-driven markets are still managing to attract Canadian travelers.
Using AirDNA data, this report looks at where Canadian demand is falling the fastest, which U.S. markets are holding up best, and what the changing travel patterns could mean for operators heading into the summer season.
Canadian Demand for U.S. STRs Continues to Slide
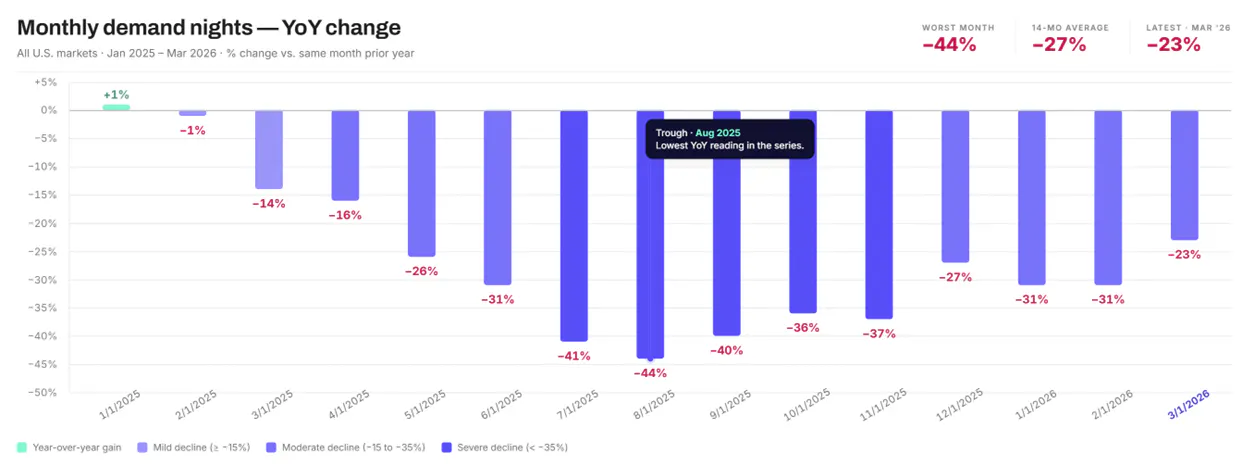
Canadian demand for U.S. short-term rentals fell sharply throughout 2025, and the slowdown has continued into 2026. Every month since the start of 2025 has posted a year-over-year decline in Canadian demand nights.
The steepest drop came in August 2025, when Canadian demand fell 44% YoY. Since then, the pace of decline has moderated somewhat, but the broader trend remains firmly negative. In Q1 2026, Canadian demand nights were down approximately 27% compared to Q1 2025 and 32% compared to Q1 2024.
Summer travel continues to account for the largest absolute losses, with July and August each losing roughly 230,000 demand nights year over year. At the same time, traditional winter snowbird travel has also weakened, suggesting the pullback extends beyond just seasonal leisure trips.
Border States Are Seeing the Sharpest Pullback
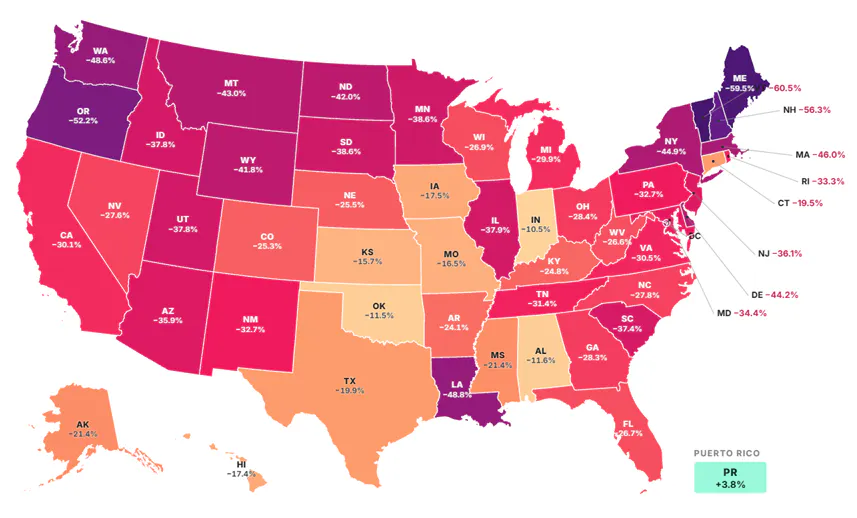
The states seeing the steepest declines in Canadian demand over the last 12 months aren’t traditional fly-to vacation destinations like Florida or Hawaii. Instead, the largest drops are concentrated in states closest to the Canadian border. Maine (−60.5%), New Hampshire (−56.3%), Oregon (−52.2%), and Washington (−48.6%) led the declines, suggesting Canadians are pulling back first on shorter, more casual cross-border trips.
That pattern matters because these markets often rely on repeat regional travel, long weekends, and drive-to demand rather than once-a-year destination vacations. When travelers become more selective about discretionary spending, nearby convenience trips are often the easiest to cut back.
Meanwhile, traditional Sun Belt destinations are holding up comparatively better. Florida (−26.7%) and Hawaii (−17.4%) still saw meaningful declines, but not at the scale seen in the Northeast or Pacific Northwest. Puerto Rico stands out as the lone bright spot, posting a 3.8% increase and appearing as the only green market on an otherwise overwhelmingly red map.
The data suggests that Canadians who are still traveling to the U.S. are increasingly prioritizing warmer-weather and destination-focused trips over shorter, lower-commitment cross-border travel.
A Market-by-Market Look at Canadian Demand
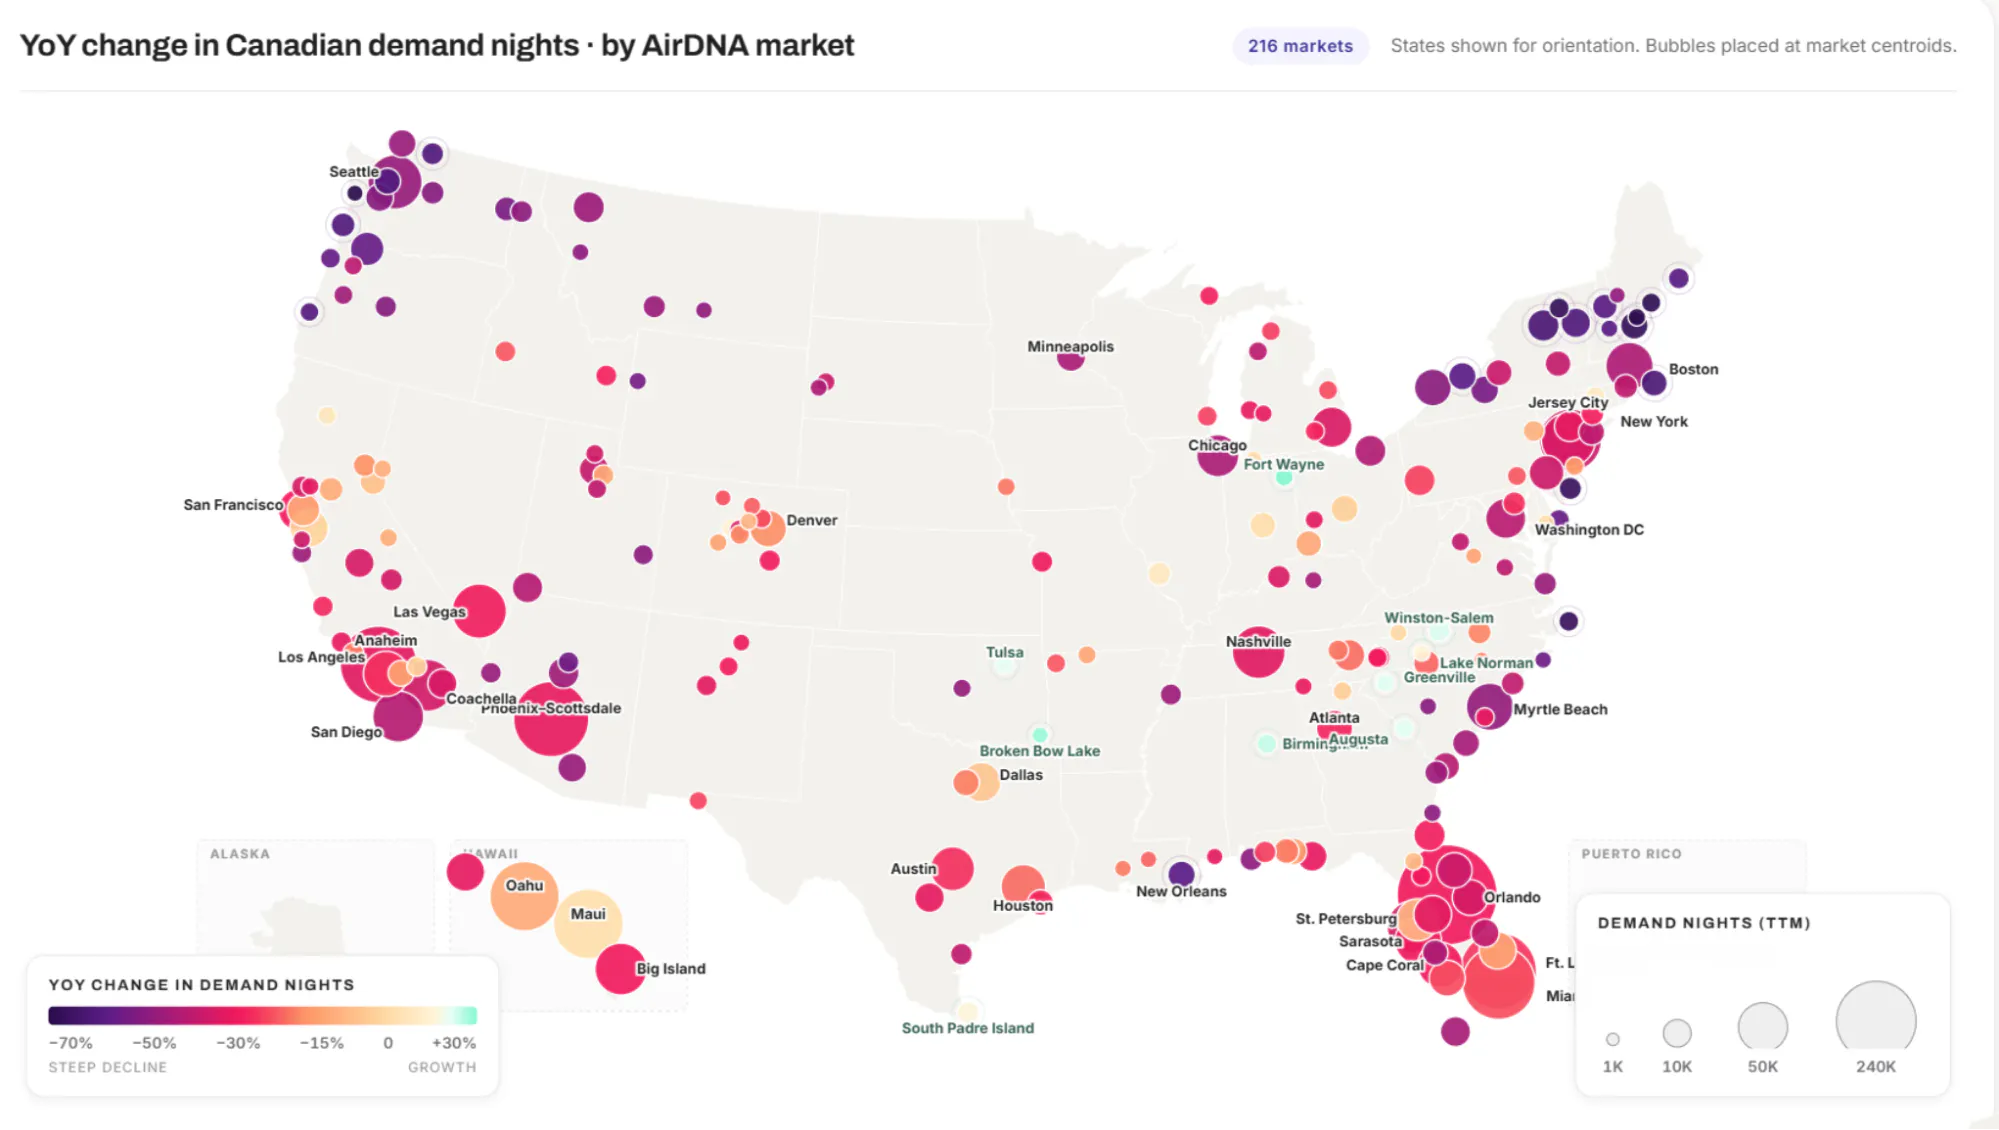
Note: The rank only includes markets that have over 1K demand nights from Canadians in 12 months.
Markets across the Pacific Northwest, particularly Washington state and British Columbia’s cross-border neighbors, saw some of the steepest declines in Canadian demand. Many posted drops between 50% and 70%, highlighting how sharply shorter cross-border travel has pulled back.
Major Sun Belt destinations also recorded meaningful contractions despite historically attracting large volumes of Canadian snowbirds. Markets such as Las Vegas, Phoenix-Scottsdale, Orlando, Sarasota, and Cape Coral all saw notable declines over the trailing 12-month period.
A smaller group of markets managed to buck the trend. Several Midwest and Southern destinations posted modest gains, though most increases remained relatively limited.
The map also highlights where the impact matters most in absolute terms. The largest bubbles, concentrated across Florida, Southern California, and parts of the Northeast, represent markets with the highest total volume of Canadian demand nights. Even moderate percentage declines in those destinations translate into substantial losses in actual booking volume.
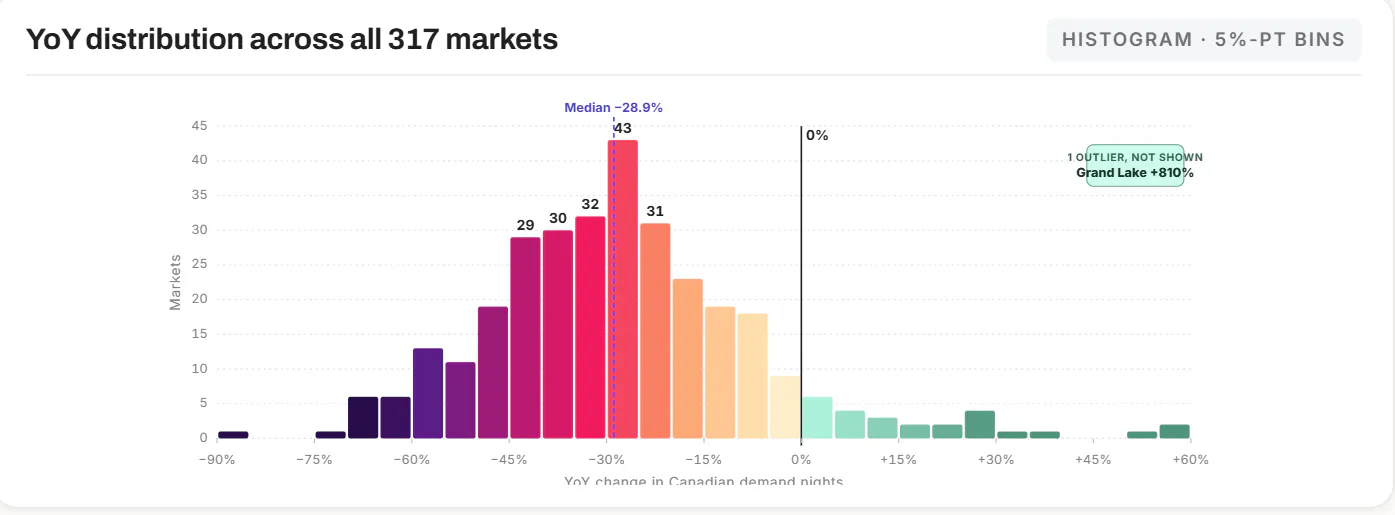
The pullback is also remarkably broad-based. Of the 317 U.S. markets tracked, the median decline in Canadian demand sits at −28.9%. A total of 291 markets saw inbound Canadian demand fall, while only 26 posted gains, most of them relatively modest in the 5% to 15% range.
Top 10 Markets that Declined Most and Gained Most from Canadians
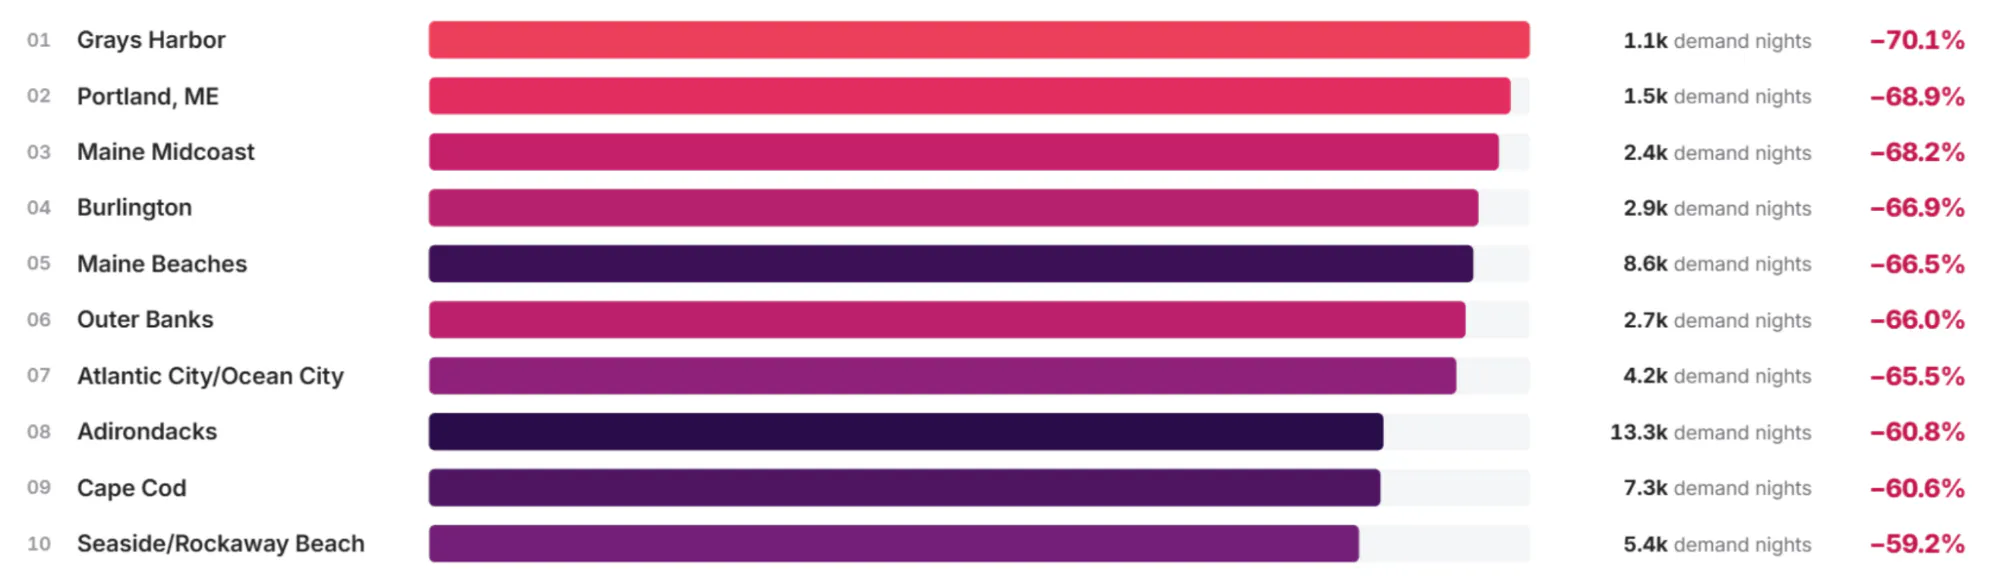
Note: The rank removed 2 groups of markets: 1) markets with less than 1K demand nights from Canadians in 12 months; 2) miscellaneous markets named with “XX Area”, representing a group of small markets in one state
The steepest declines in Canadian demand are heavily concentrated in border and drive-to leisure markets, particularly across the Northeast. Grays Harbor, Washington (−70.1%), Portland, Maine (−68.9%), Maine Beaches (−66.5%), Outer Banks, North Carolina (−66.0%), and Cape Cod, Massachusetts (−60.6%) all saw major pullbacks in Canadian demand nights over the trailing 12 months.
What these markets have in common is accessibility. Many are traditional road-trip or regional vacation destinations that historically benefited from convenient cross-border travel rather than destination-driven demand.
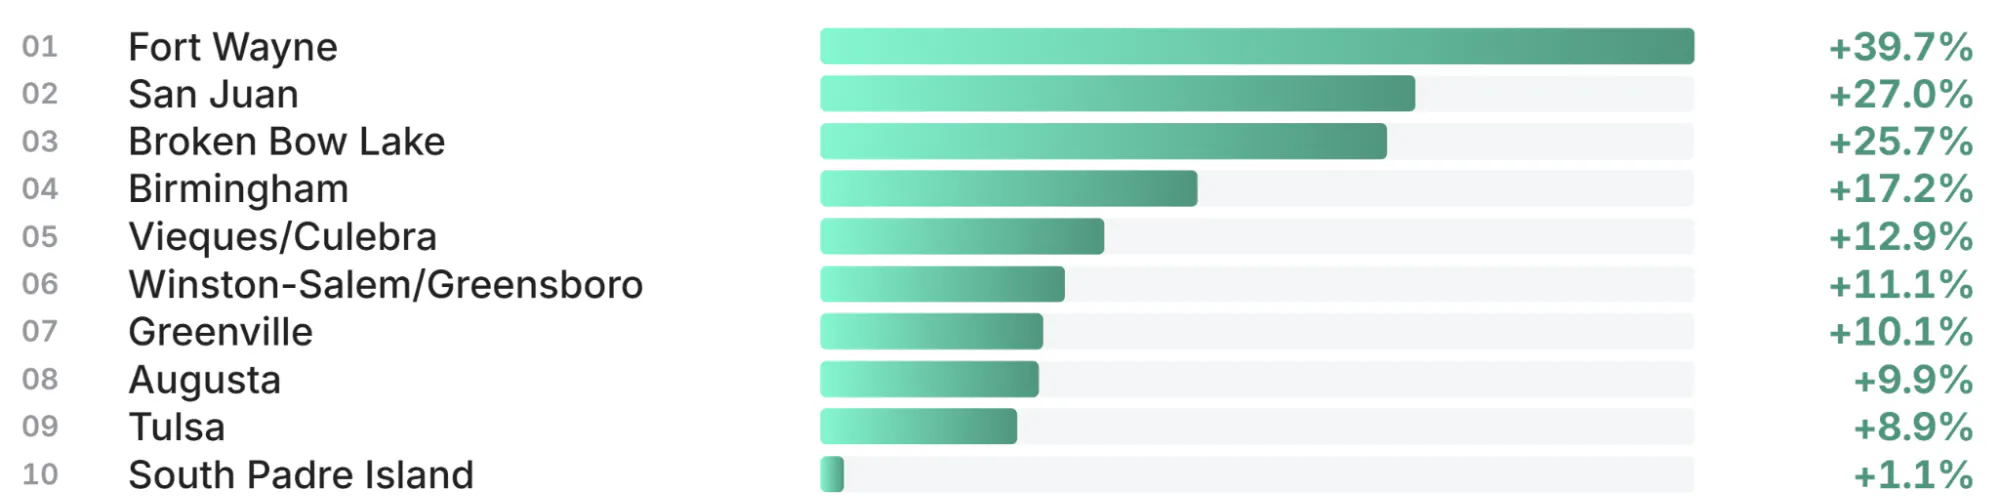
The markets posting gains tell a very different story. The strongest performers tend to be fly-to or purpose-driven destinations rather than casual cross-border trips. San Juan, Puerto Rico (+27%) and Vieques/Culebra, Puerto Rico (+12.9%) benefited from warm weather and direct-flight accessibility, while markets such as Fort Wayne, Indiana (+39.7%) and Broken Bow Lake, Oklahoma (+25.7%) point toward event-driven and outdoor-focused travel demand.
Other gainers, including Birmingham, Alabama; Winston-Salem, North Carolina; Greenville, South Carolina; Augusta, Georgia; and Tulsa, Oklahoma, share another common thread: relatively affordable destinations with strong sports, golf, outdoor, or cultural appeal.
The broader pattern suggests Canadians who are still traveling to the U.S. are increasingly doing so with a specific purpose, whether that’s a major event, warm-weather travel, or a strong value proposition. Convenience alone appears to matter less than it once did.
Even so, the broader U.S. STR market remains overwhelmingly driven by domestic travel demand. Domestic travelers accounted for 92% of all U.S. demand nights in the twelve months through March 2026, up from 91% during the same period a year earlier
ARTICLE SUMMARY
Canadian demand for U.S. short-term rentals continues to decline sharply. While some fly-to and event-driven markets are still attracting Canadian travelers, the broader trend suggests travelers are becoming more selective about when and why they visit the U.S.
Bram Gallagher
AirDNA Director of Economics and Forecasting
Bram Gallagher is an Economist at AirDNA, specializing in uncovering insights that drive smarter short-term rental decisions. He put his Ph.D. in Economics from the University of Georgia to work researching and forecasting hotel data with CBRE prior to joining AirDNA, as well as teaching economics at a number of universities. In his spare time, Bram enjoys making wooden furniture with hand tools.
