

 Calculate Revenue
 Research Markets
 Find For Sale Properties
 Compare My Listing
 STR Revenue Calculator
 Custom Comp Sets
 Submarket Insights
 Custom Search Filters
 Rate Recommendations
 Performance Benchmarking
 Competitor Comparison
 Owner Contact Details
 Property-level performance data
 Tourism Insights
 Real Estate Investment Analytics
 About Us
 Sales
Sales Support
 Press
PressU.S. Market Review: January's STR Booking and Pace Data Deliver a Pleasant Surprise | AirDNA
Published: February 21, 2023
Last updated: May 5, 2026

Scott Sage
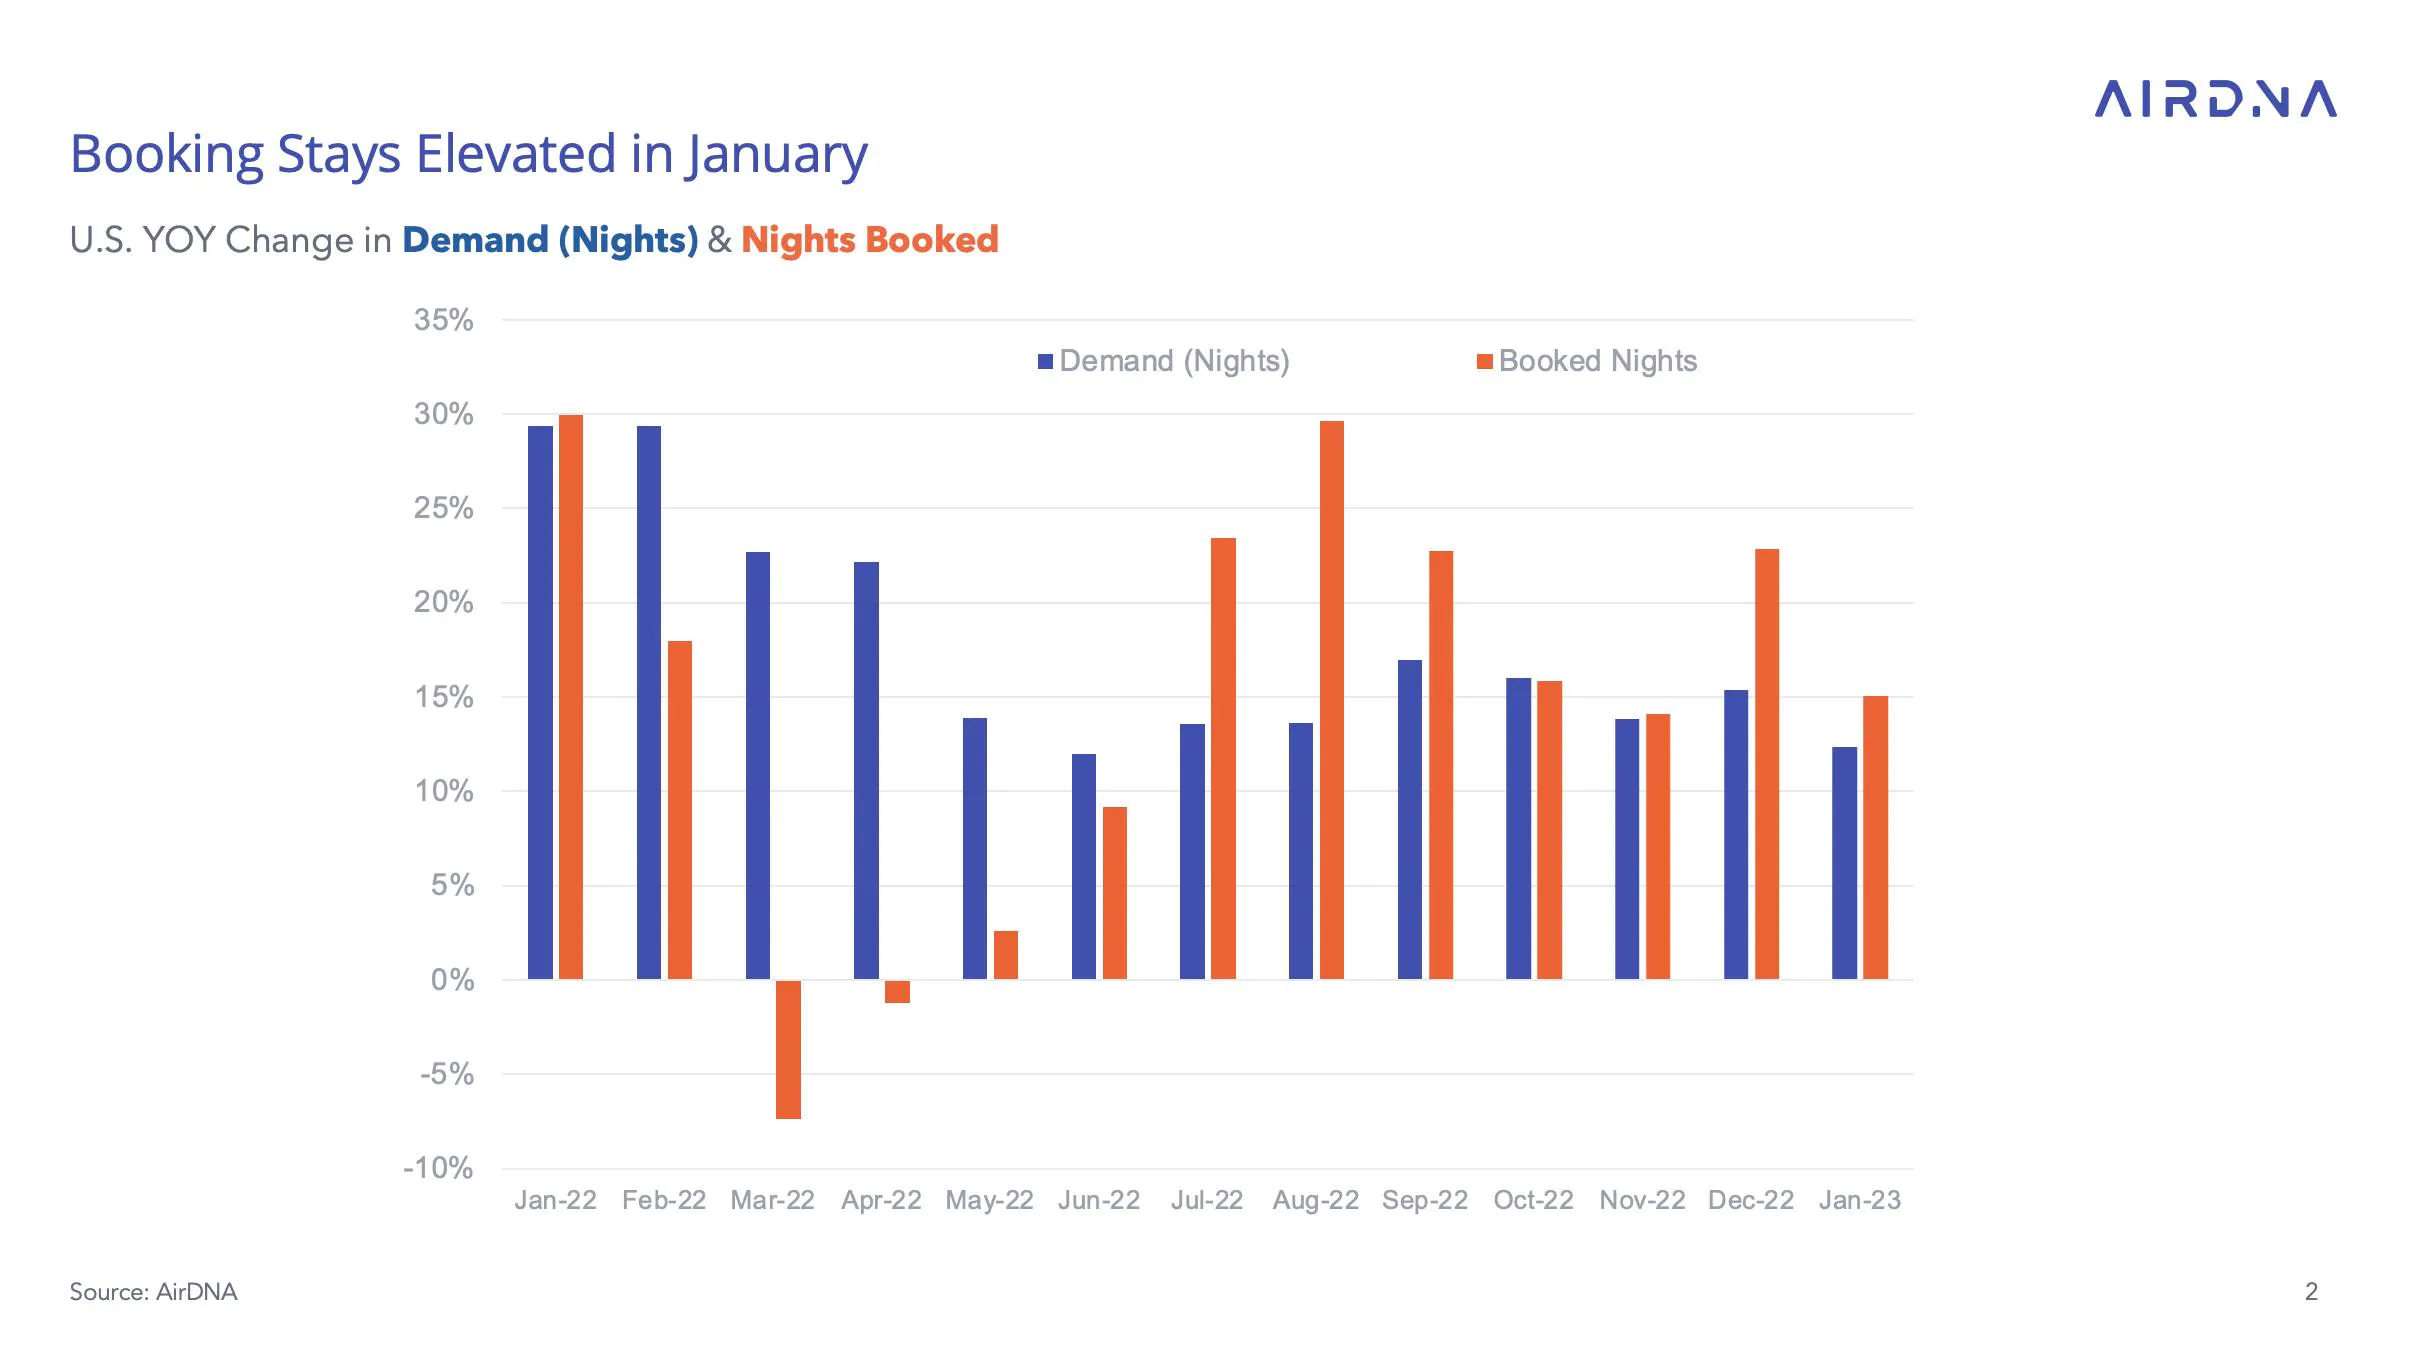
Uncertainty about the imminent downturn in the U.S. economy and the aftermath of a strong holiday season could not halt short-term rental (STR) momentum in January 2023, with available listings up 21.7% year over year (YoY) and nights stayed (demand) growing 12.4% YoY. Although YoY occupancy change has been negative since Februaryof 2022, the proportionate decline in both supply and demand in January led to occupancy only 4.2% lower than in 2022. This was the same YoY difference seen in December. The largest decline in occupancy was seen in June 2022, at 10.9%, and was 6.1% as recently as November.
At a Glance: Key U.S. Short-Term Rental Performance Metrics for January 2023:
- RevPAR fell by 0.5% YoY to $180.58
- Available listings reached 1.4 million – up 21.7% YoY
- Total demand (nights) rose 12.4% YoY
- Occupancy declined 4.2% YoY to 45.78%, down 1.5% vs. 2019
- Average daily rates rose 3.8% YoY to $308.30
- Nights booked are up 15.0% YoY
Average daily rate (ADR) growth also clung closely to December levels, slowing very slightly to 3.8% YoY in January from 2.9% in December. January had some of the slowest ADR gain since 2019, and ADR has decelerated despite inflation remaining in excess of 6% through at least January, according to estimates by the Bureau of Labor Statistics (BLS). On the other hand, recent economic news has been positive, with the January jobs report showing an astonishing 517,000 jobs added, unemployment reaching lows not seen since the middle of last century, and real personal income growth accelerating in the fourth quarter. Although the Federal Reserve has signaled that it will continue raising rates for the time being, the most recent increase of 25 bps was smaller than previous hikes and may represent a slowing of monetary tightening.
The change in timbre of economic news may help explain continued strength in bookings. While January demand growth remained strong, the rate of new bookings, while declining slightly from December levels, remained at 15.0% (down from 22.9% in December) and in excess of demand for the second month in a row.
Booking rates, in combination with forward booking levels, are a leading indicator of future demand performance.
- Demand nights are the nights stayed during a given month.
- Nights booked are reservations made during a given month for any future date.
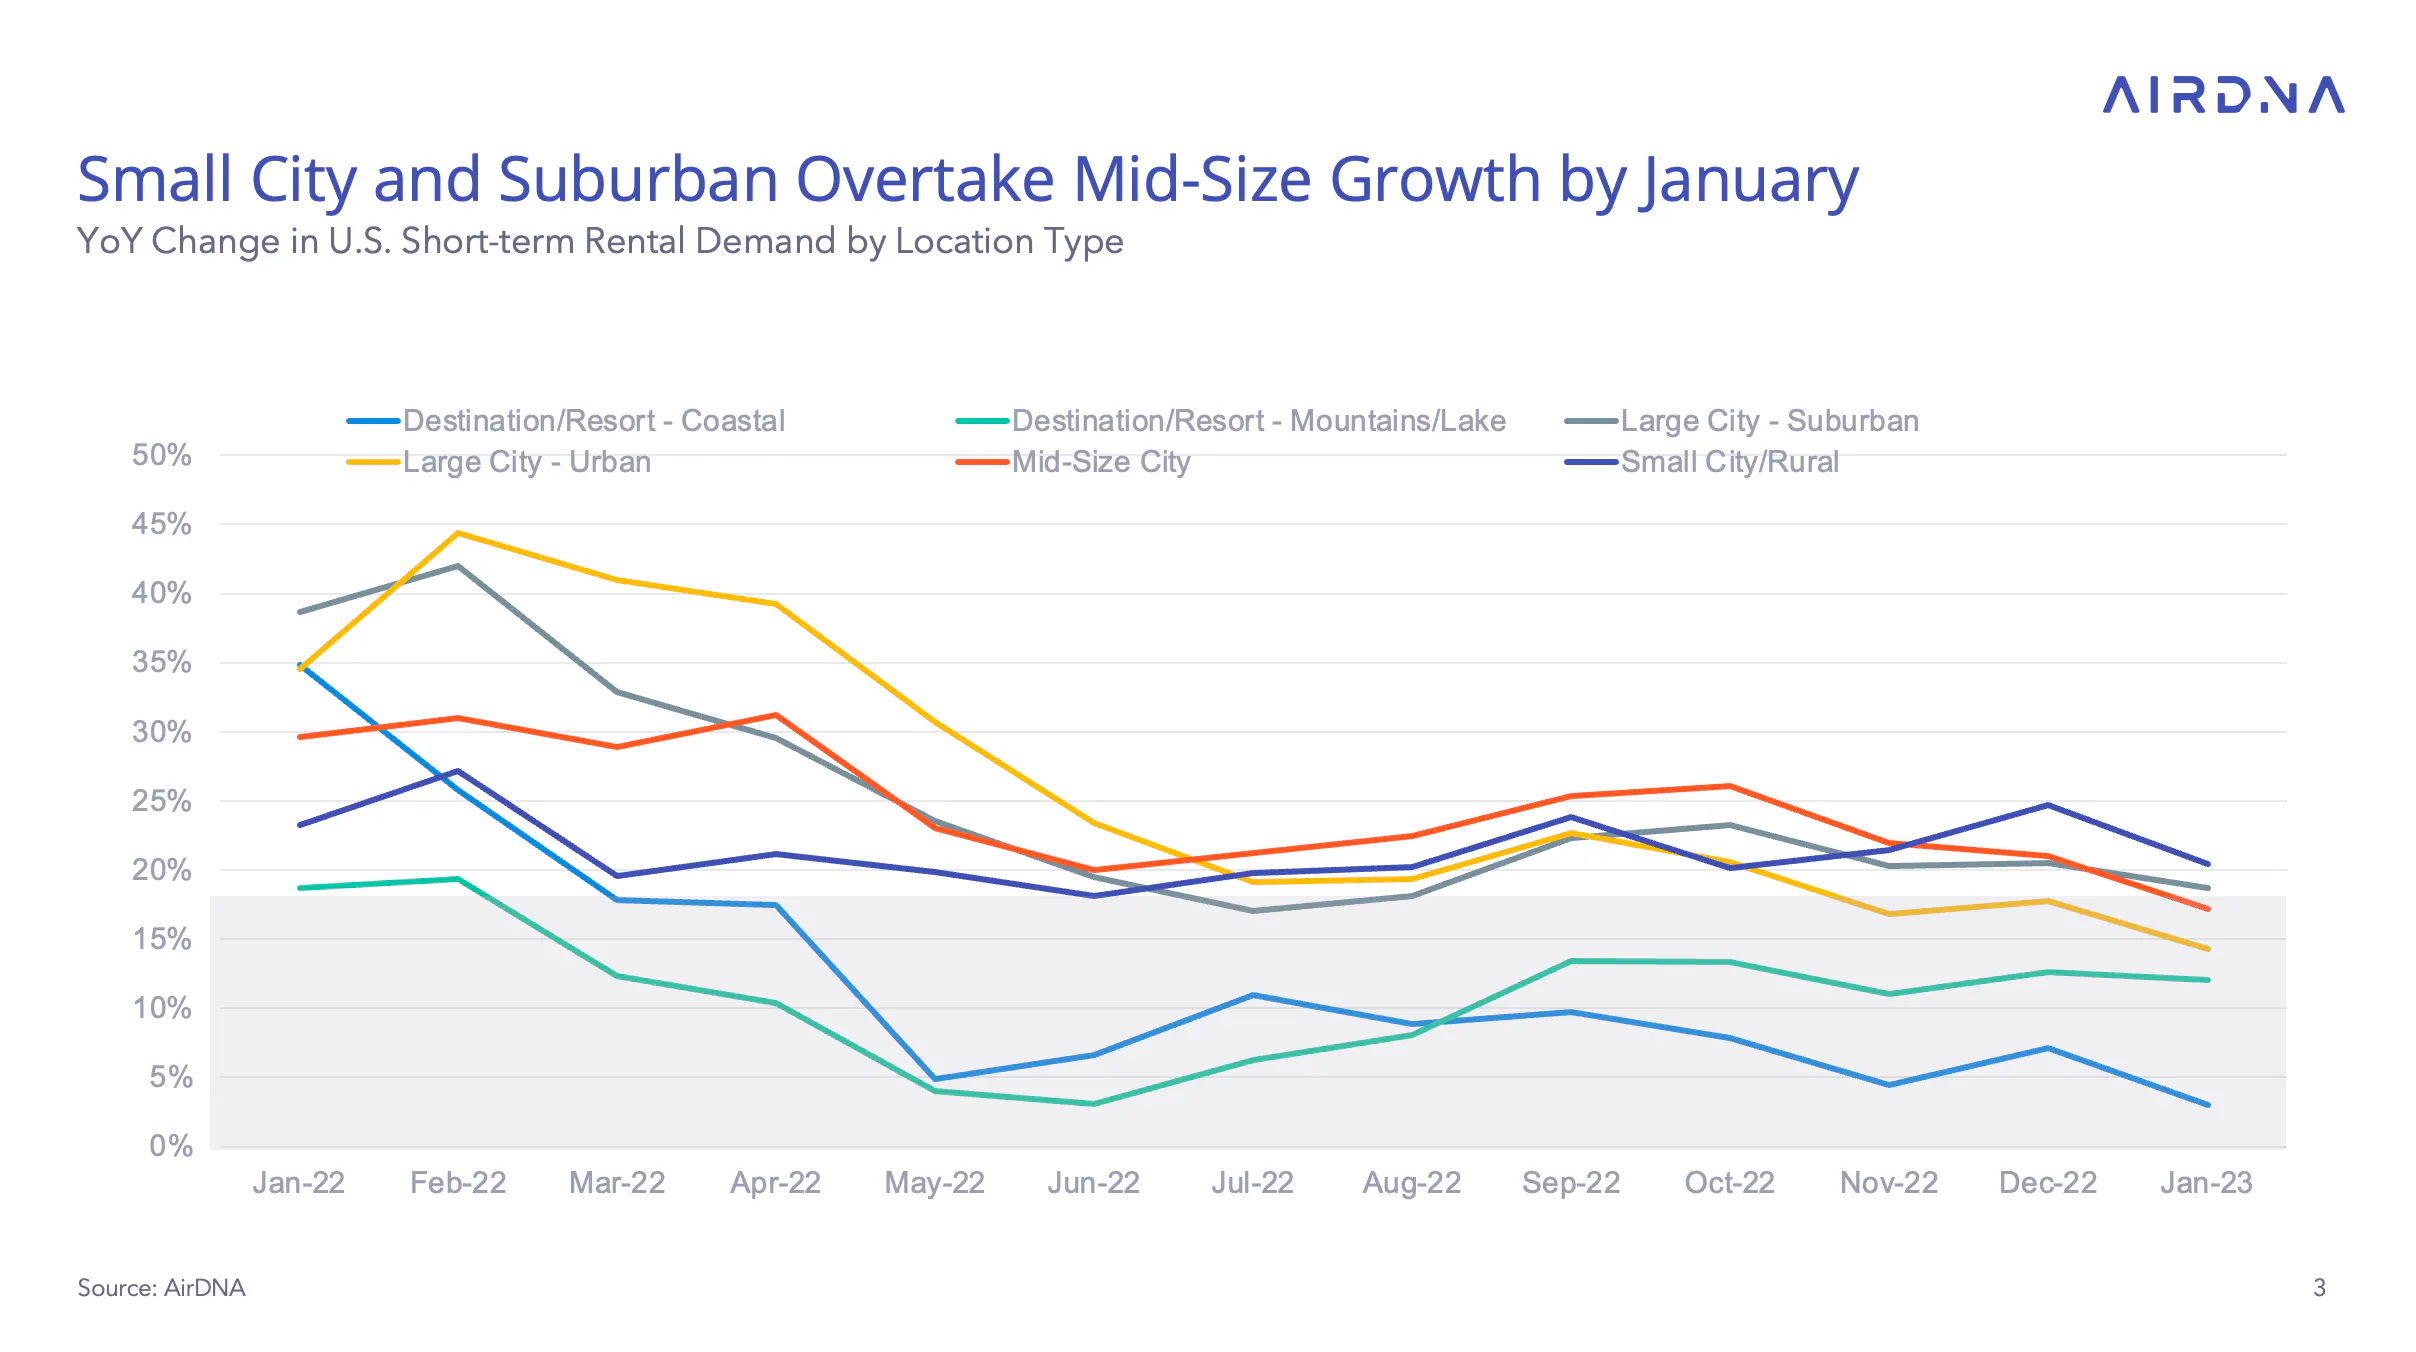
Turning to location types, demand growth has clustered into three groups over the past two to three months. Small city, suburban, and mid-sized cities have the highest growth rates, around 20% YOY growth. Mid-sized cities had the highest growth over the past summer and fall, but in December, both small city and suburban locations had slightly faster growth.
The middle tier, centered around 12-15% growth YoY, is made of urban and mountain locations. Mountain locations had the slowest growth in the beginning of the year, while urban locations had the highest. In both cases, the pattern was a function of year-prior performance, as urban locations lagged while mountain locations surged ahead quickly in 2021. Similarly, coastal locations experienced quick and aggressive increases in demand and now are finding it difficult to attract more guests as capacity reaches its limits. Coastal locations had YoY demand growth of 3% on average in January.
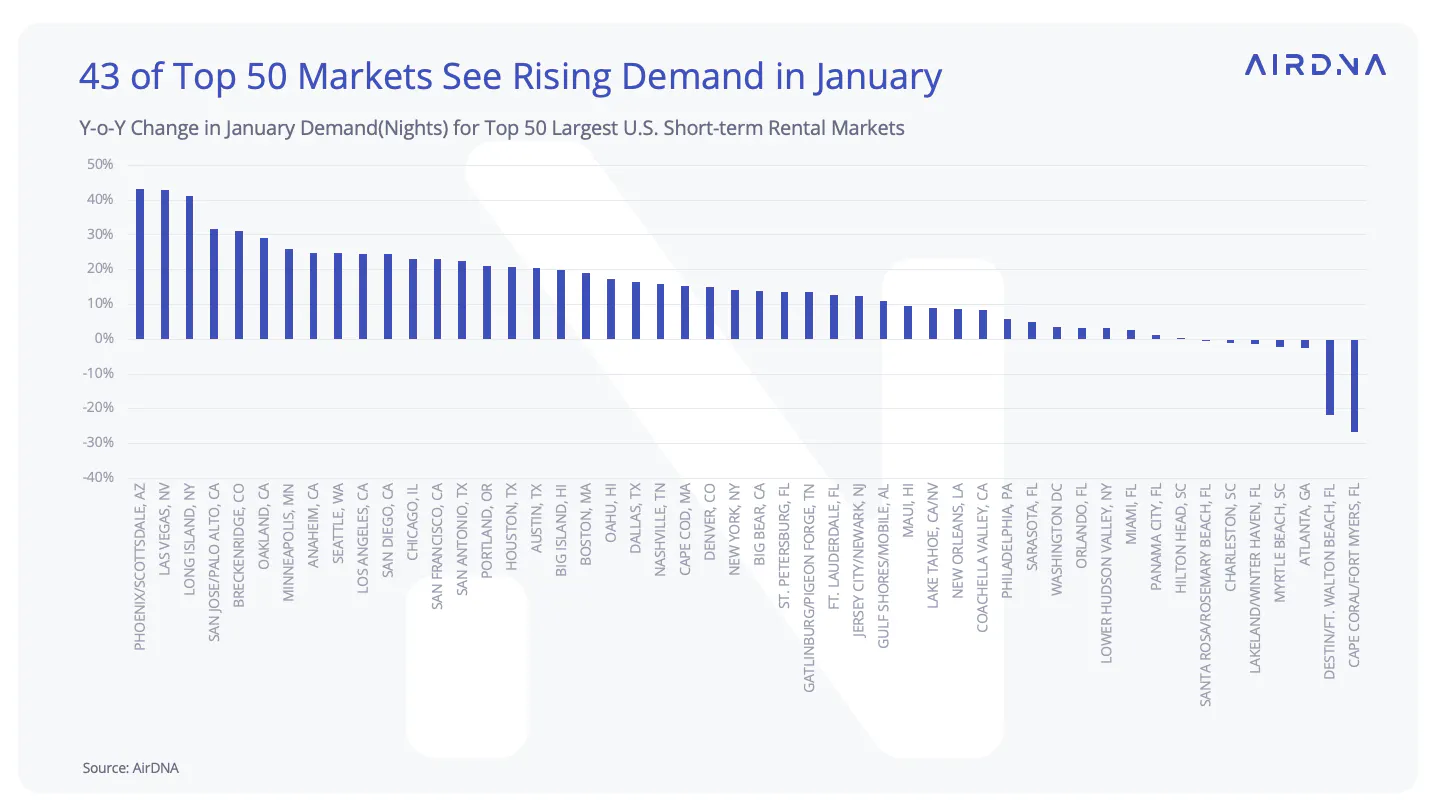
Accordingly, when looking at the top 50 metros, many of the cities at the bottom of the distribution of demand growth are Florida beach locations. Cape Coral is still recovering from Hurricane Ian, but the Destin/Fort Walton market is experiencing a downturn as a result of a difficult comparison with an exceptional 2021/2022 winter season that saw demand nearly double in January 2022. Similarly, several other famous beaches are seeing meager gains.
The top two metros for growth—Phoenix/Scottsdale and Las Vegas—are in the Southwest. Phoenix/Scottsdale, in particular, has experienced continuous strong growth since the beginning of 2021, and with the metro hosting the Super Bowl in February, and the highest demand month usually occurring in March, demand growth will almost certainly reach new heights in the months to come as well. Many other Western metros are represented near the top as well. Long Island, including the Hamptons, is the sole east coast metro in the top 10, and while it has not yet recovered to its pre-pandemic heights, currently it is undergoing an unprecedentedly strong shoulder season, as its proximity to urban centers and relative affordability make it an attractive drive-to refuge.
Where December saw across-the-board ADR growth declines, January is more mixed. Mountain and suburban locations saw notable month-over-month increases in ADR growth rates, although mountain ADR growth, at a little less than 2.5%, was still the lowest of the locations. Suburban locations increased ADR growth from 3.4% in December to 5.7% in January. Mid-sized cities saw the highest ADR growth at 7.4%, up from 6.9% in December. Coastal locations saw large declines in ADR growth compared to December, down to around 3% from 6% the month previous.
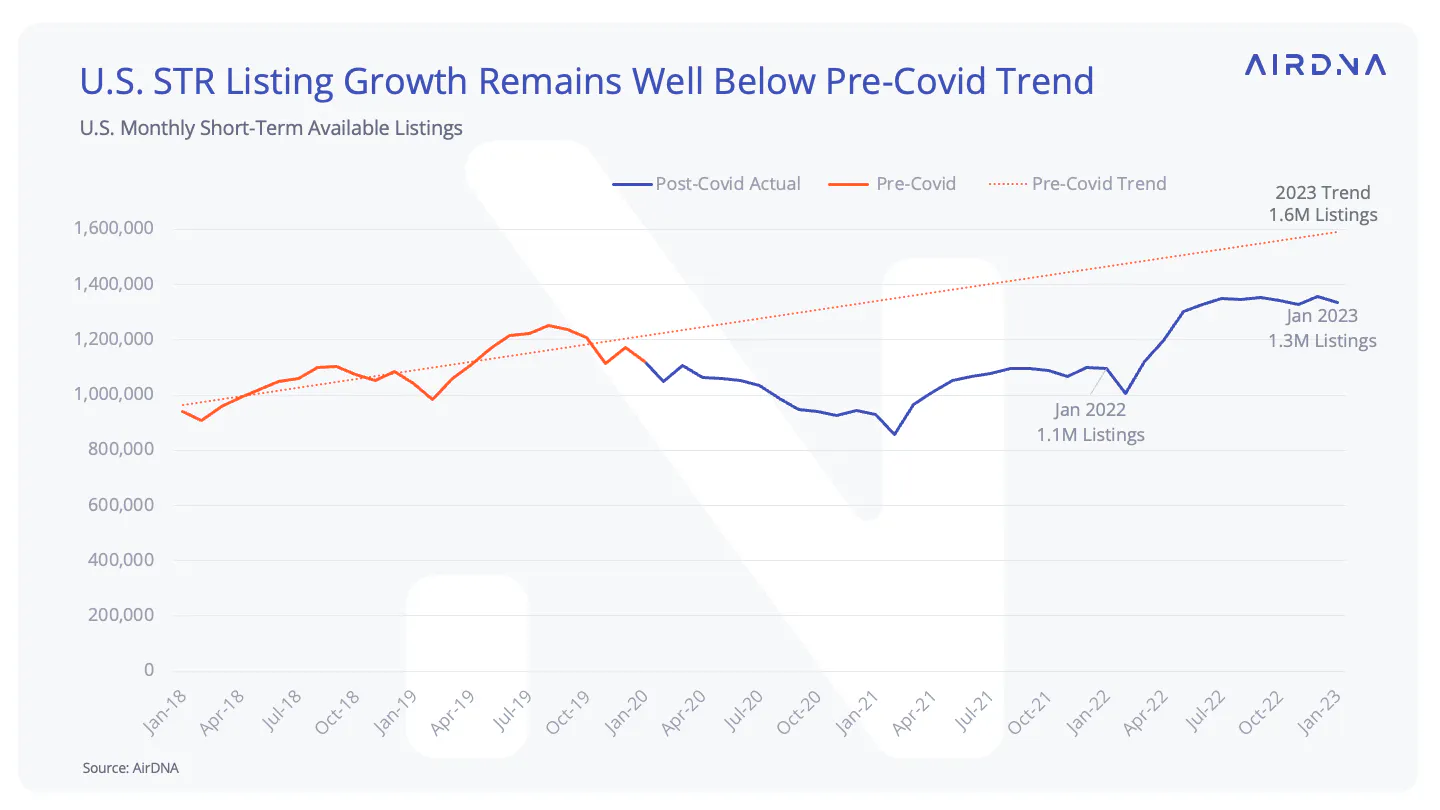
Supply in the STR market has reacted to the interest rate increases mostly by staying still. After tremendous and rapid growth in the beginning of 2022, supply growth began to slow almost immediately after the Federal Funds rate more than doubled in May and, since July, has hovered around 1.35 million available monthly listings. AirDNA’s forecast released at the beginning of 2023 calls for 9% supply growth for the entire year, and staying at the current level with no additional growth in listings throughout 2023 would accomplish about 7% growth because of comparisons with early 2022. Implicit in our forecast, then, is some additional supply.
Even though the first half of 2022 had a rapid increase in the number of available listings, taking a longer-term view reveals that supply is still well below where we might have expected it to be, had the pandemic not occurred. 2020 and 2021 represented a dramatic downward turn in the trajectory of new listing growth and available listings. Current available listings are about a quarter of a million shy of trending supply growth prior to February 2020.
There is some suggestive evidence for forthcoming supply increases in new listings. New listings, which had been trending downward since May of 2022, reversed course sharply in January, increasing by about 4,000 listings, or 6%, compared to December. While high in level terms for the month of January, when looking at new listings as a percentage of total available listings, the figure is fairly typical, falling in the middle of figures from the past five years.
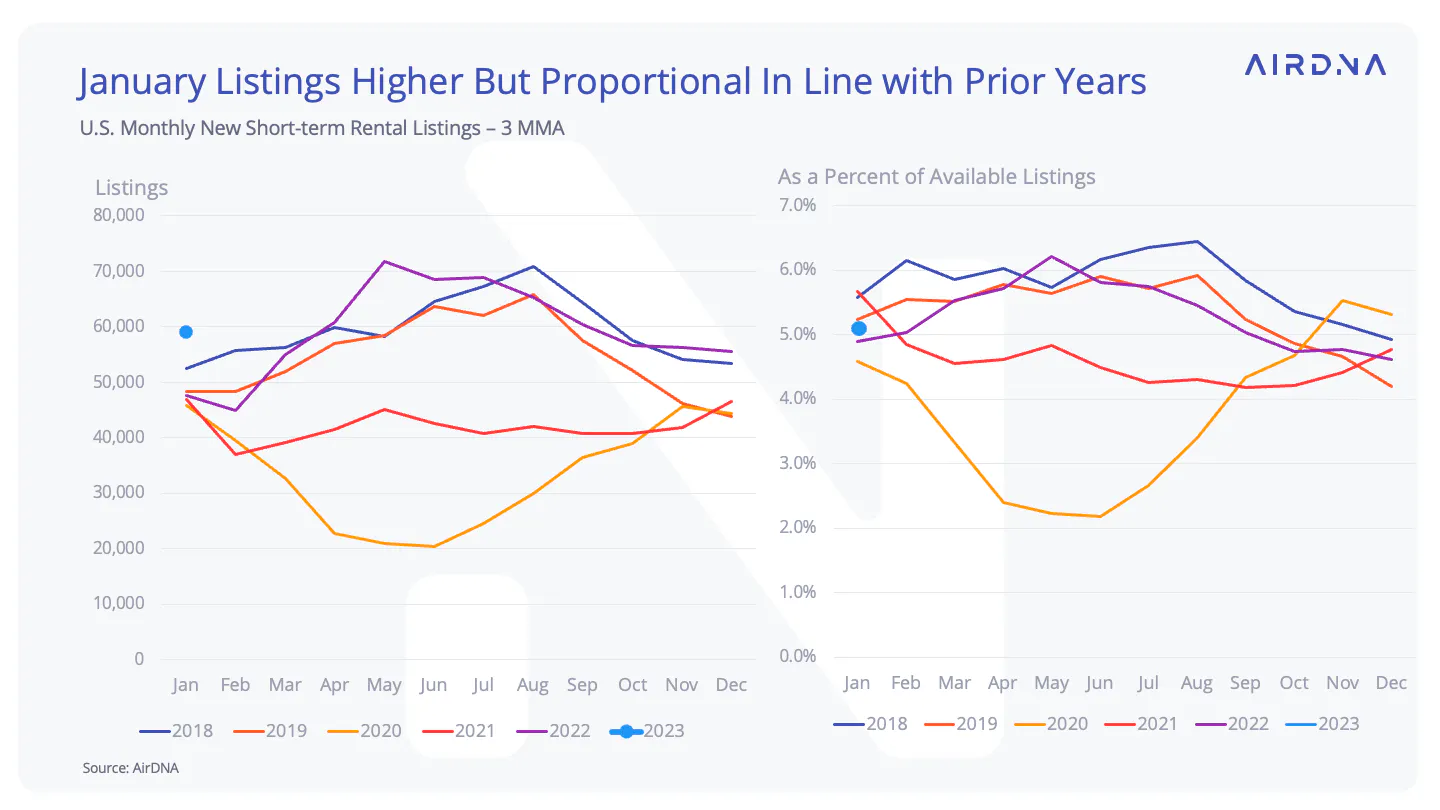
The continuing inertia from the rapid supply buildup in 2022 will create some difficulties for occupancy, even in a strong demand environment. When looking at the top 50 markets, 22 had YOY increases to occupancy in January, 22 had declines, and six had occupancy that was more or less unchanged. While several of the top occupancy gainers were markets that are notoriously difficult to increase supply in, such as Hawaii, others, such as Breckenridge and Long Island, have seen both supply and demand grow but have increased demand even more quickly. Nationally, occupancy was slightly down, -1.3% YOY, and we expect occupancy for the U.S. in 2023 to be slightly lower than in 2022 or 2021.
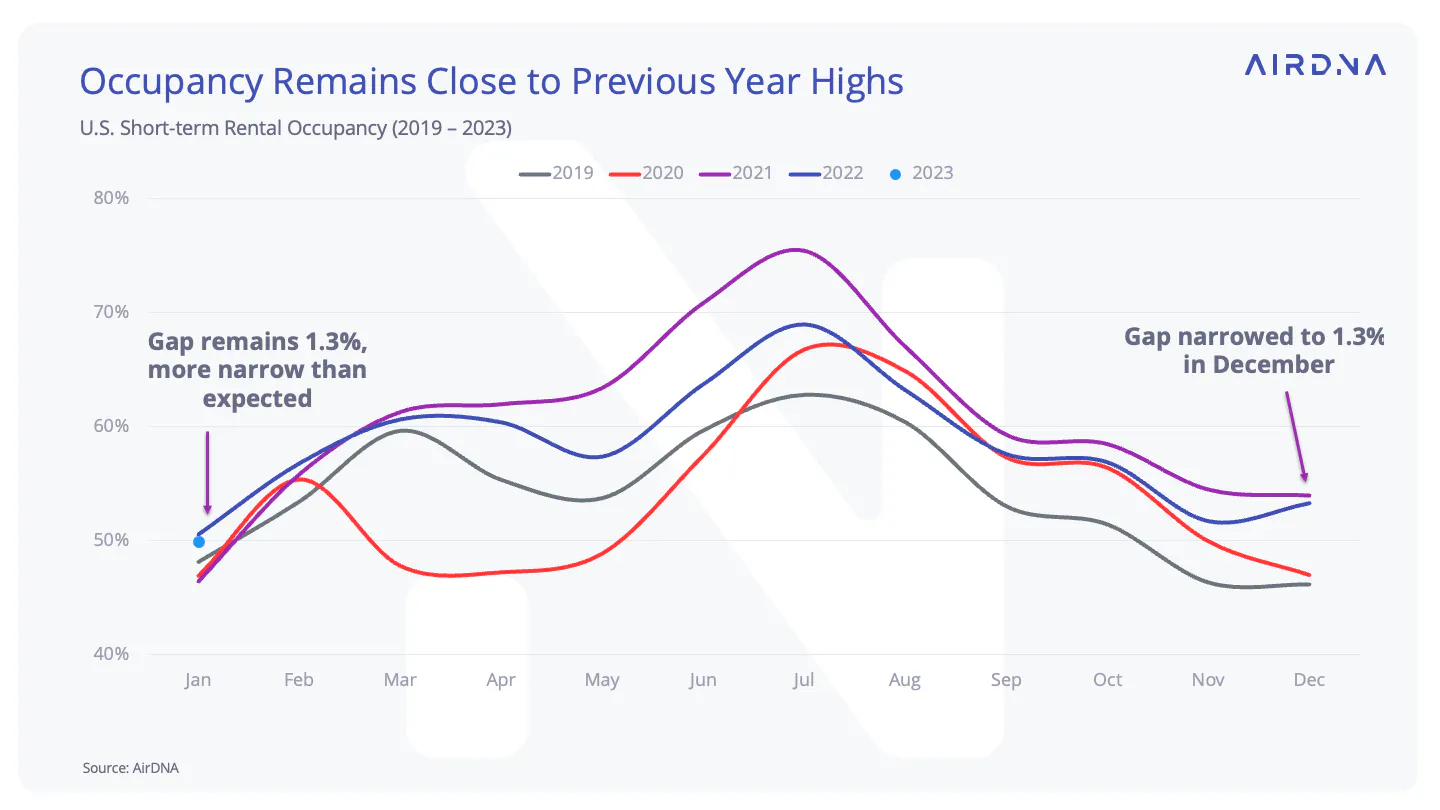
A declining occupancy market means that hosts and operators looking for gains in revenue per available listing (RevPAL) may have to rely more heavily on rate. Past RevPAL growth has been composed of a mix of contributions from occupancy and rate; however, after February 2022, occupancy losses have been a drag on RevPAL growth. The past two months have seen ADR deceleration to below the inflation rate, and hosts often find difficulty in raising rates while occupancy declines. One strategy would be to differentiate a listing as much as possible so as to not compete on price as intensely.
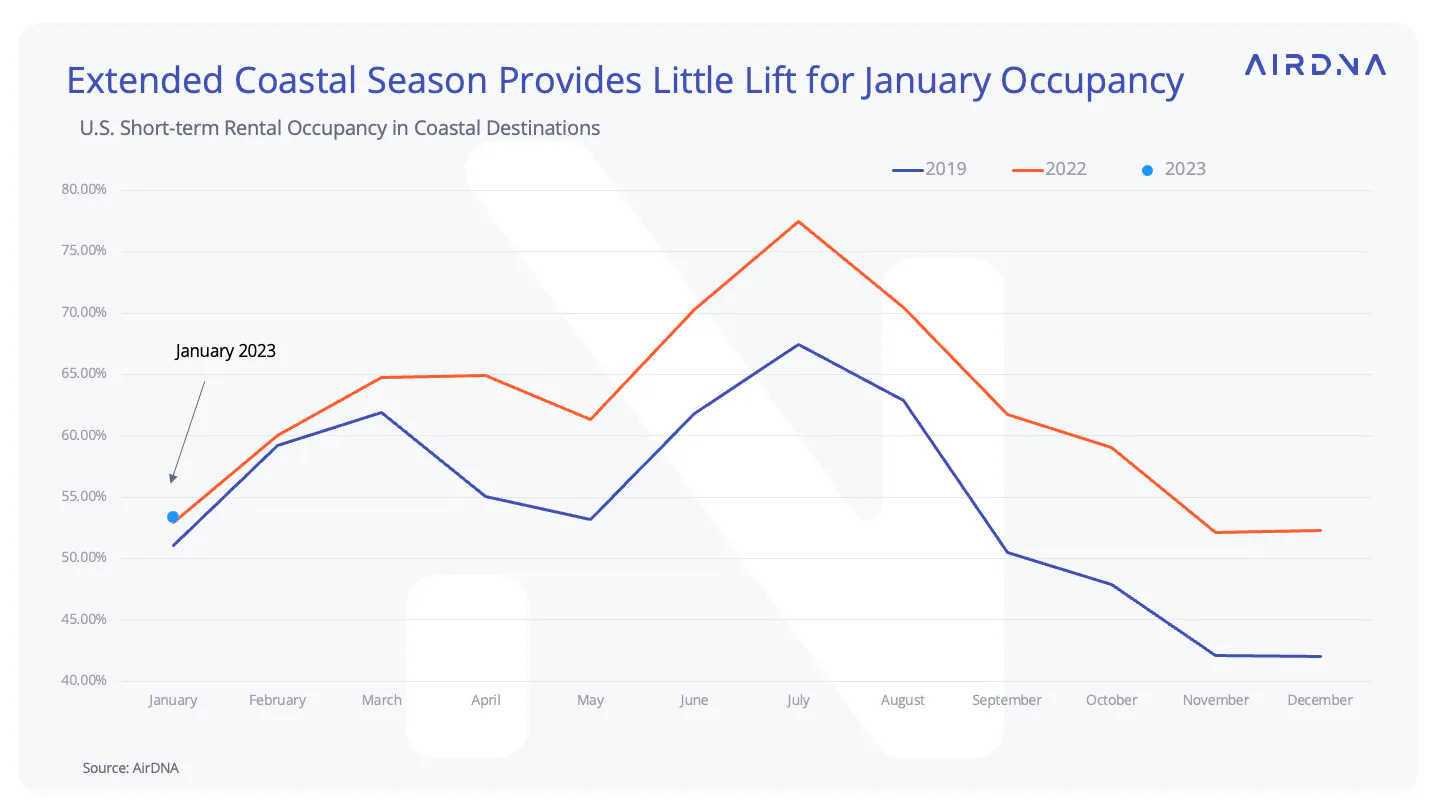
When comparing coastal occupancy in 2022 to pre-pandemic levels in 2019, this recent fall and winter enjoyed proportionately higher occupancy rates compared to 2019. Although most of the year had higher occupancy than in 2019, the lift intensified as the travel season extended for many into September through the rest of the year. However, January 2023 occupancy landed about where it was in both 2019 and 2022, and the usual lift we see between December and January was essentially smoothed out by the extended season.
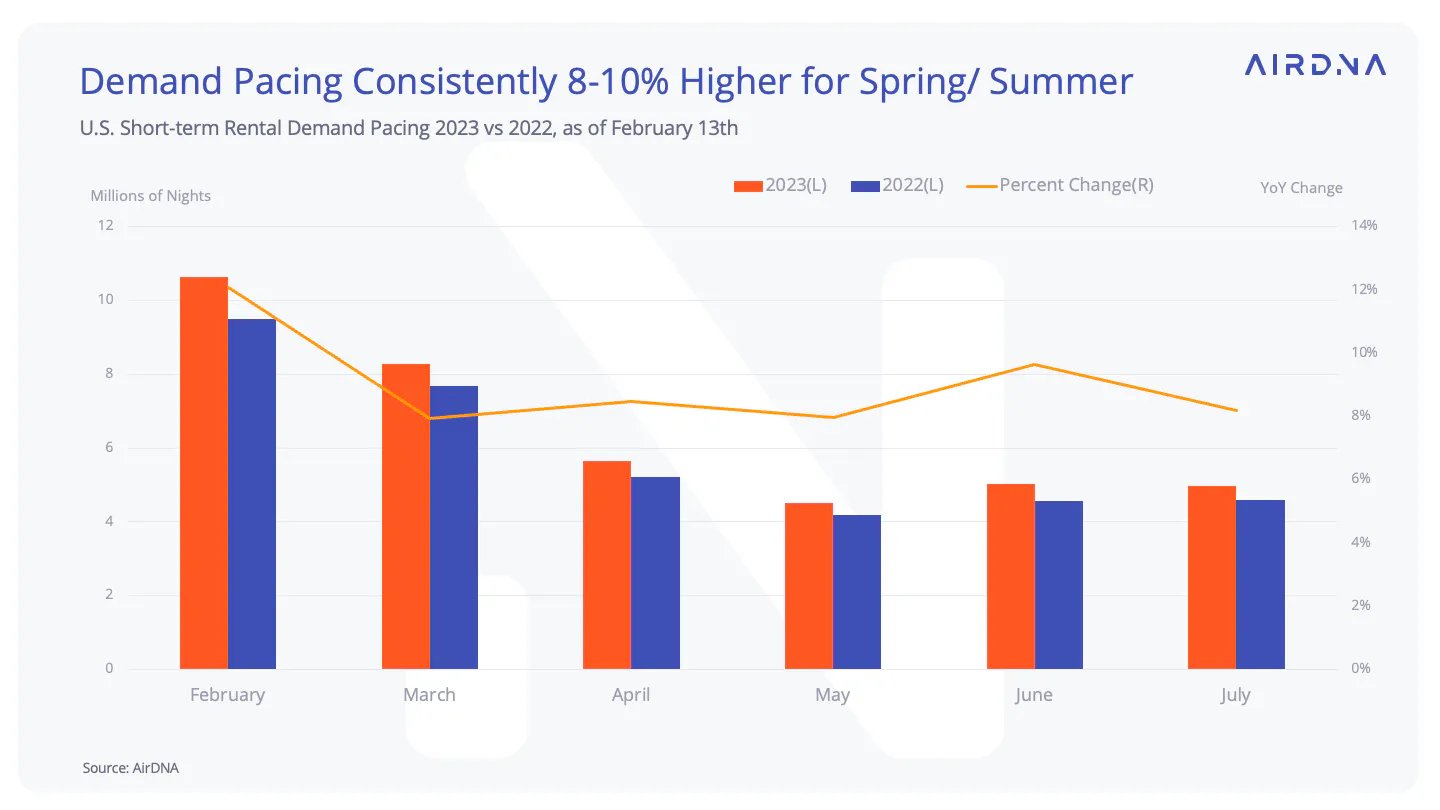
Looking ahead to pacing, one-month ahead pacing has noticeably picked up from January to about 12% higher for the month of February compared to the same time last year. January saw one-month-ahead pacing of about 8%. For the next five months after February, future demand is currently between 8-10% higher YOY, giving credence to the idea that economic anxieties are not standing in the way of Americans’ travel plans. Rates, while not growing exorbitantly, are seeing consistent gains between 3-5% over this same period and are in line with expectations for slowing inflation in 2023.
In summary, January was a slight pause that let the STR market catch its breath after a breakneck holiday season. While demand growth slowed slightly from December, so did supply, and occupancy remained only 1.3% lower than a year ago. ADR, generally close to its lowest in January, had results that were mixed across locations but increasing in aggregate.
Meanwhile, forward-looking measures suggest continued strength as travel remains a priority to U.S. consumers, even as economic signals are ambiguous at best. Our baseline expectations at the beginning of the year were that demand would grow at about 5.5% for 2023. After two months of exceptional performance and forward booking rates in excess of 8% YoY for the next six months, the likelihood of the upside scenario is on the rise.
As part of our ongoing commitment to accuracy, we continuously implement data methodology improvements, leading to updates to some of the information in this report as of December 22, 2023. For further questions, please contact us.
ARTICLE SUMMARY
2023 started strongly for U.S. short-term rentals, with occupancy stabilizing just 4.2% lower than last year.
Scott Sage
Senior Vice President, Marketing & Customer Experience
Scott is an Airbnb Superhost and industry pro, having founded Home Base BnBs—a short term rental management company that scaled to 200+ units. Scott combines his experience and passion for hosting to empower AirDNA customers' success. When he's not thinking about STRs, he is hiking, playing basketball, or playing pickleball.
