

 Calculate Revenue
 Research Markets
 Find For Sale Properties
 Compare My Listing
 STR Revenue Calculator
 Custom Comp Sets
 Submarket Insights
 Custom Search Filters
 Rate Recommendations
 Performance Benchmarking
 Competitor Comparison
 Owner Contact Details
 Property-level performance data
 Tourism Insights
 Real Estate Investment Analytics
 About Us
 Sales
Sales Support
 Press
PressU.S. Market Review: November Fuels Optimism for Balanced Growth in 2024 | AirDNA
Published: December 21, 2023
Last updated: May 5, 2026

Jamie Lane
U.S. short-term rental (STR) demand accelerated for the third month in a row in November, and forward pacing suggests that travelers are already gearing up for a busy spring. Although down from performance highs seen in the past few years, the November boost in performance has produced occupancy essentially equal to pre-pandemic levels, and the year ahead promises a measured and balanced STR market.
An important driver of accelerating travel demand is the improving economic outlook. The U.S. consumer entered the holiday season with a November inflation rate of 3.1%, according to the Bureau of Labor Statistics (BLS) CPI. This was less than half the rate a year prio, at 7.1%, and the second consecutive month of declining inflation after a slight acceleration in August.
Meanwhile, average hourly earnings continue growing faster than inflation at 4.0%, as they have since May of this year. Although prices for many goods remain high, increasing purchasing power increased consumer confidence in November after falling for three months beginning in August, according to the Conference Board’s survey.
November was also a strong month for the labor market, with 199,000 jobs added, according to BLS estimates. This drove down unemployment to 3.7% in November, from 3.9% the month previous. Against the backdrop of slowing inflation and wage growth, low unemployment and confidence on the rise, the Federal Reserve also announced in December that rate increases have likely ended and that cuts that could lower borrowing costs for individuals and businesses were being considered in the next year.
At a Glance: Key Performance Metrics for November 2023
- RevPAR declined 4.3% YOY to $143.75
- Available listings reached 1.6 million, up 17.4% YOY
- Total demand (nights) rose 8.0% YOY
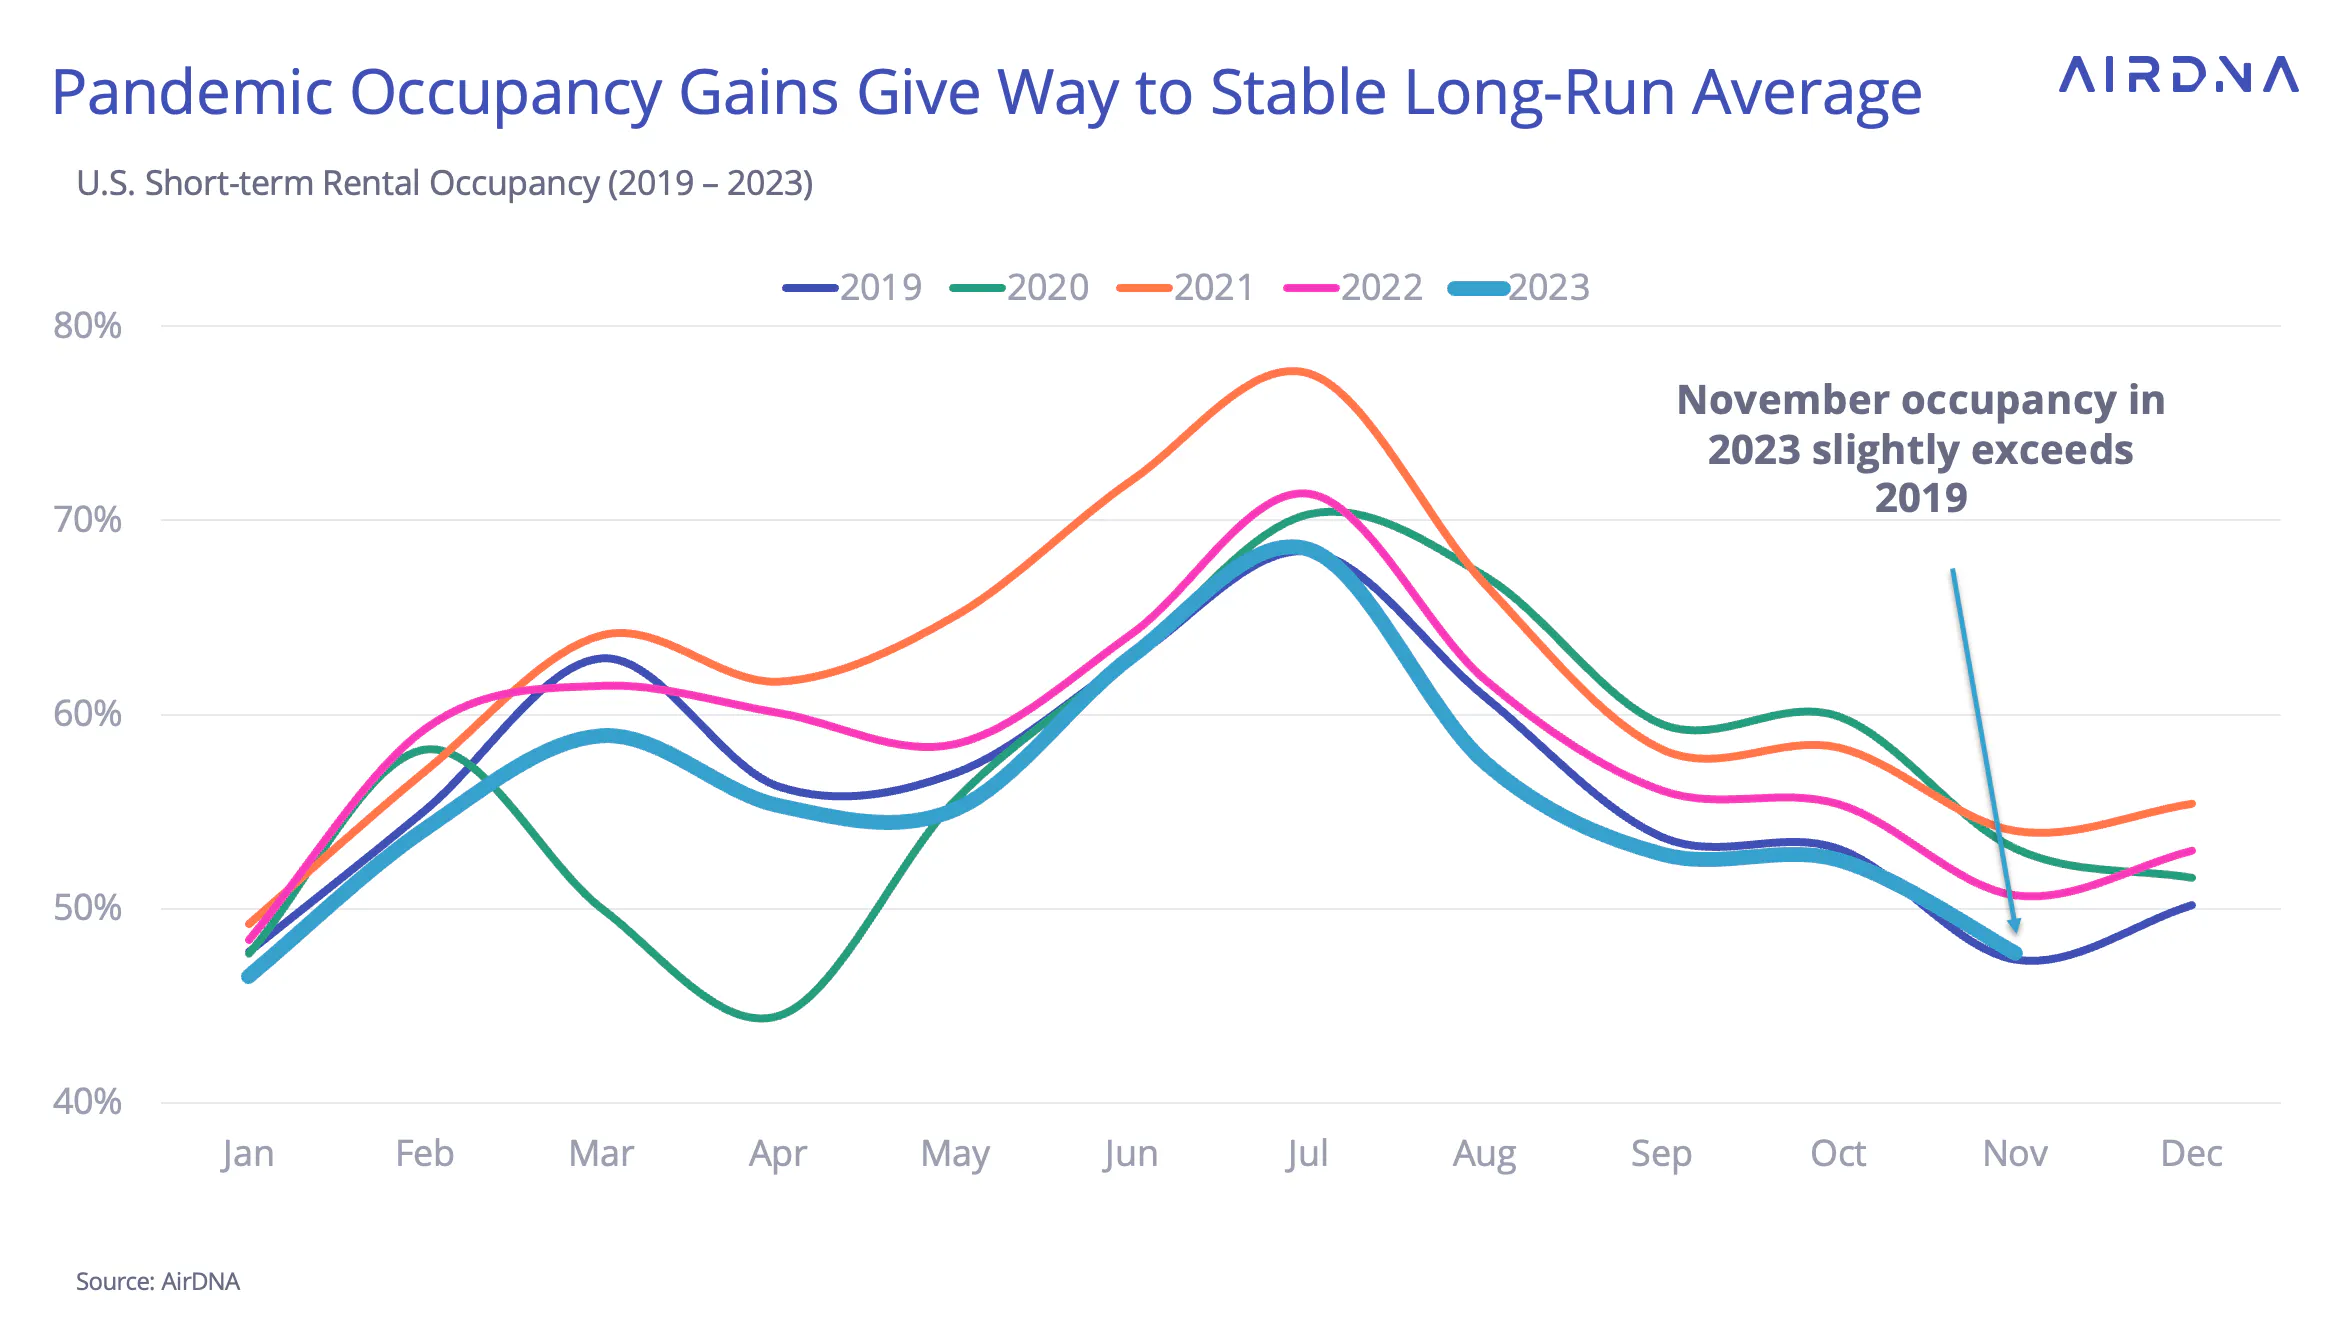
- Occupancy was 5.9% lower YOY at 47.7% (+0.6% vs. 2019)
- Average daily rates (ADRs) grew 1.7% YOY to $301.23
- Nights booked increased 13.6% YOY
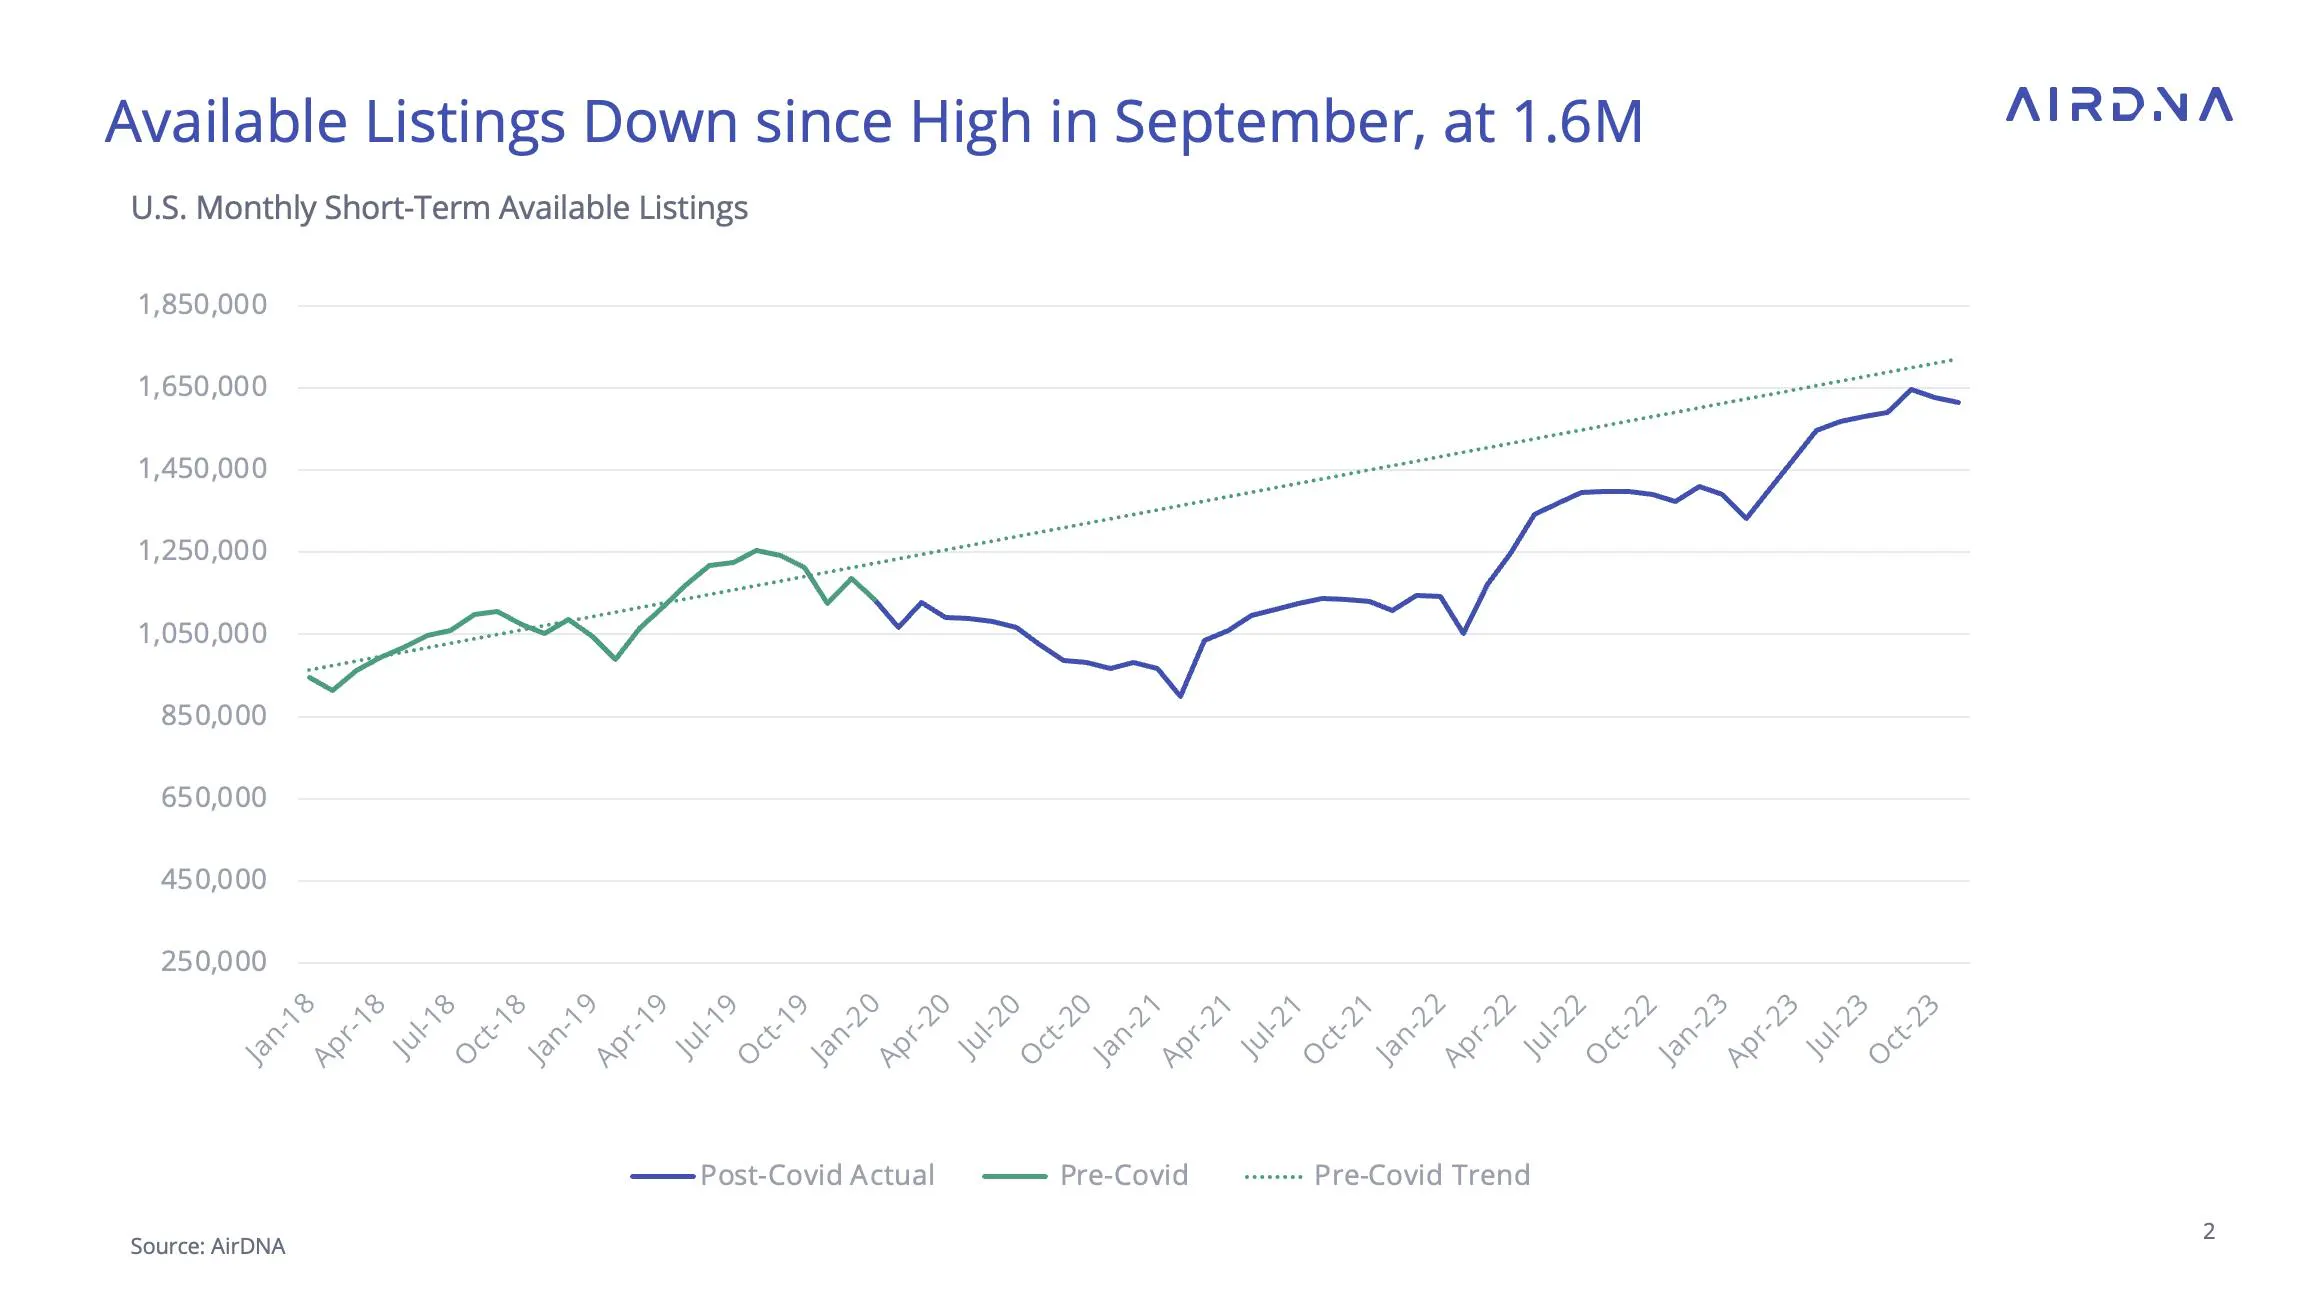
Supply growth has been a dominant theme for the past two years as hosts scrambled to take advantage of the higher-than-usual performance that characterized the STR market since Covid restrictions were loosened in 2021. Still, available listings fell slightly in both October and November to 1.61 million available listings, down from a high of 1.65 million listings in September. This represents the smallest gap yet recorded between current available listings and the pre-Covid linear trend since the pandemic.
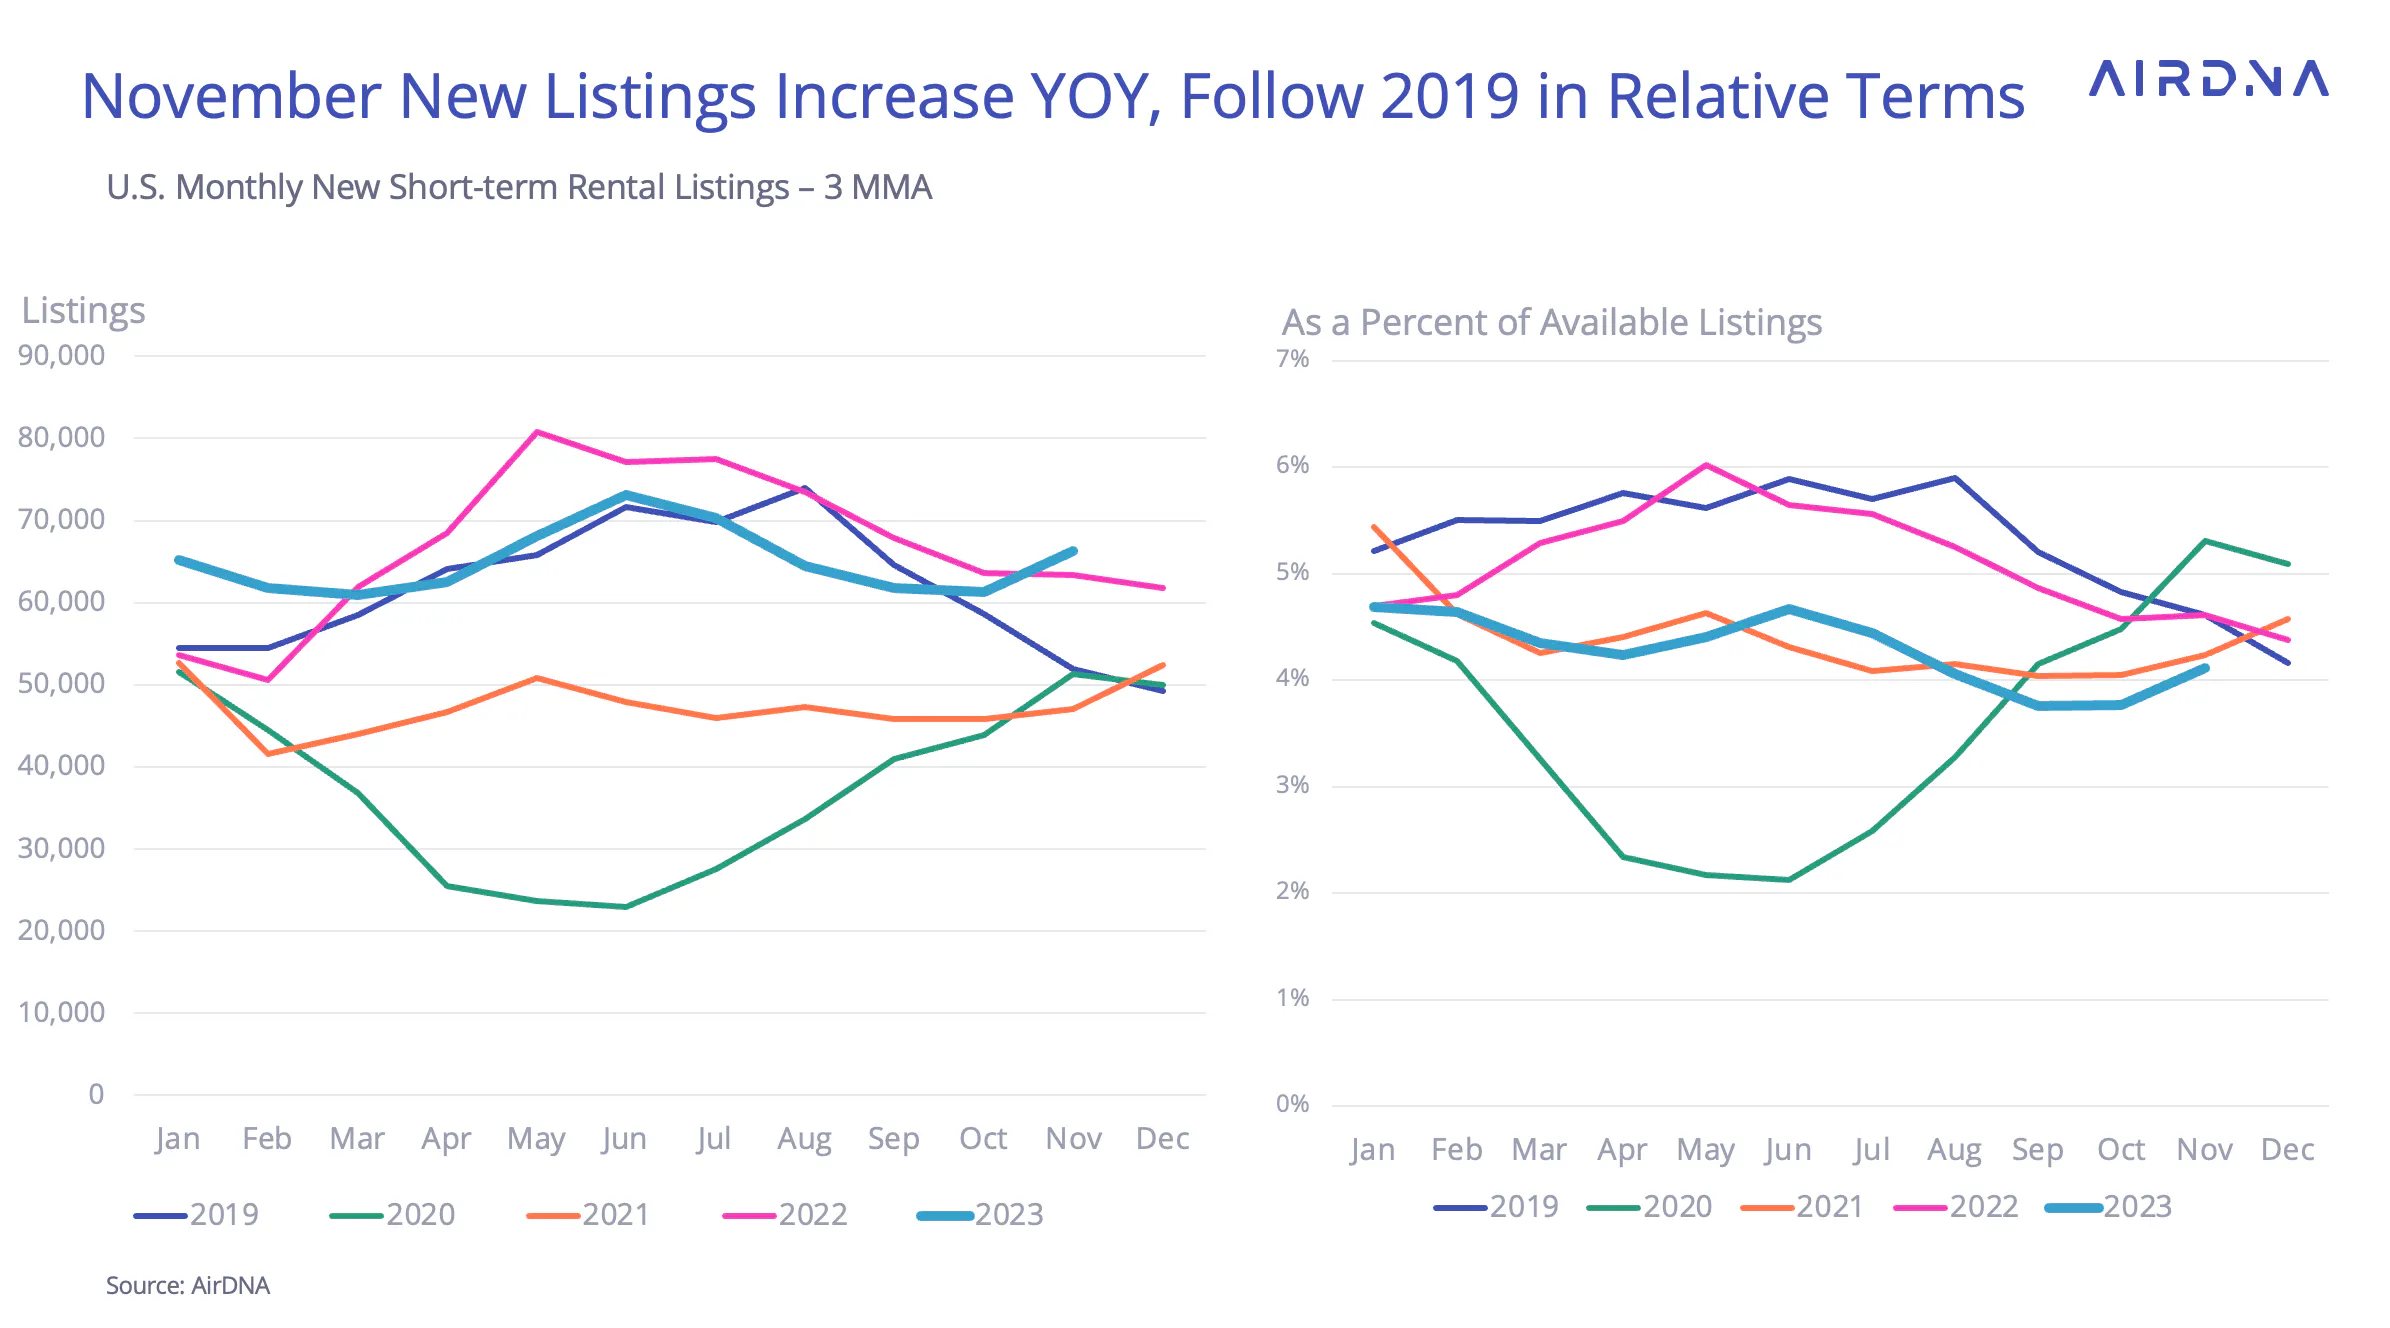
Fears that supply may reaccelerate have been mitigated by a decline in new listings since the frenetic pace of additions in 2022; however, new listings, based on a three-month moving average, were higher in November 2023 than the same month last year for the first time since February. Less alarmingly, new listings as a percent of available listings in November were well below the levels seen in either 2019 or 2022, and have resembled the pattern seen in 2021 most closely this year.
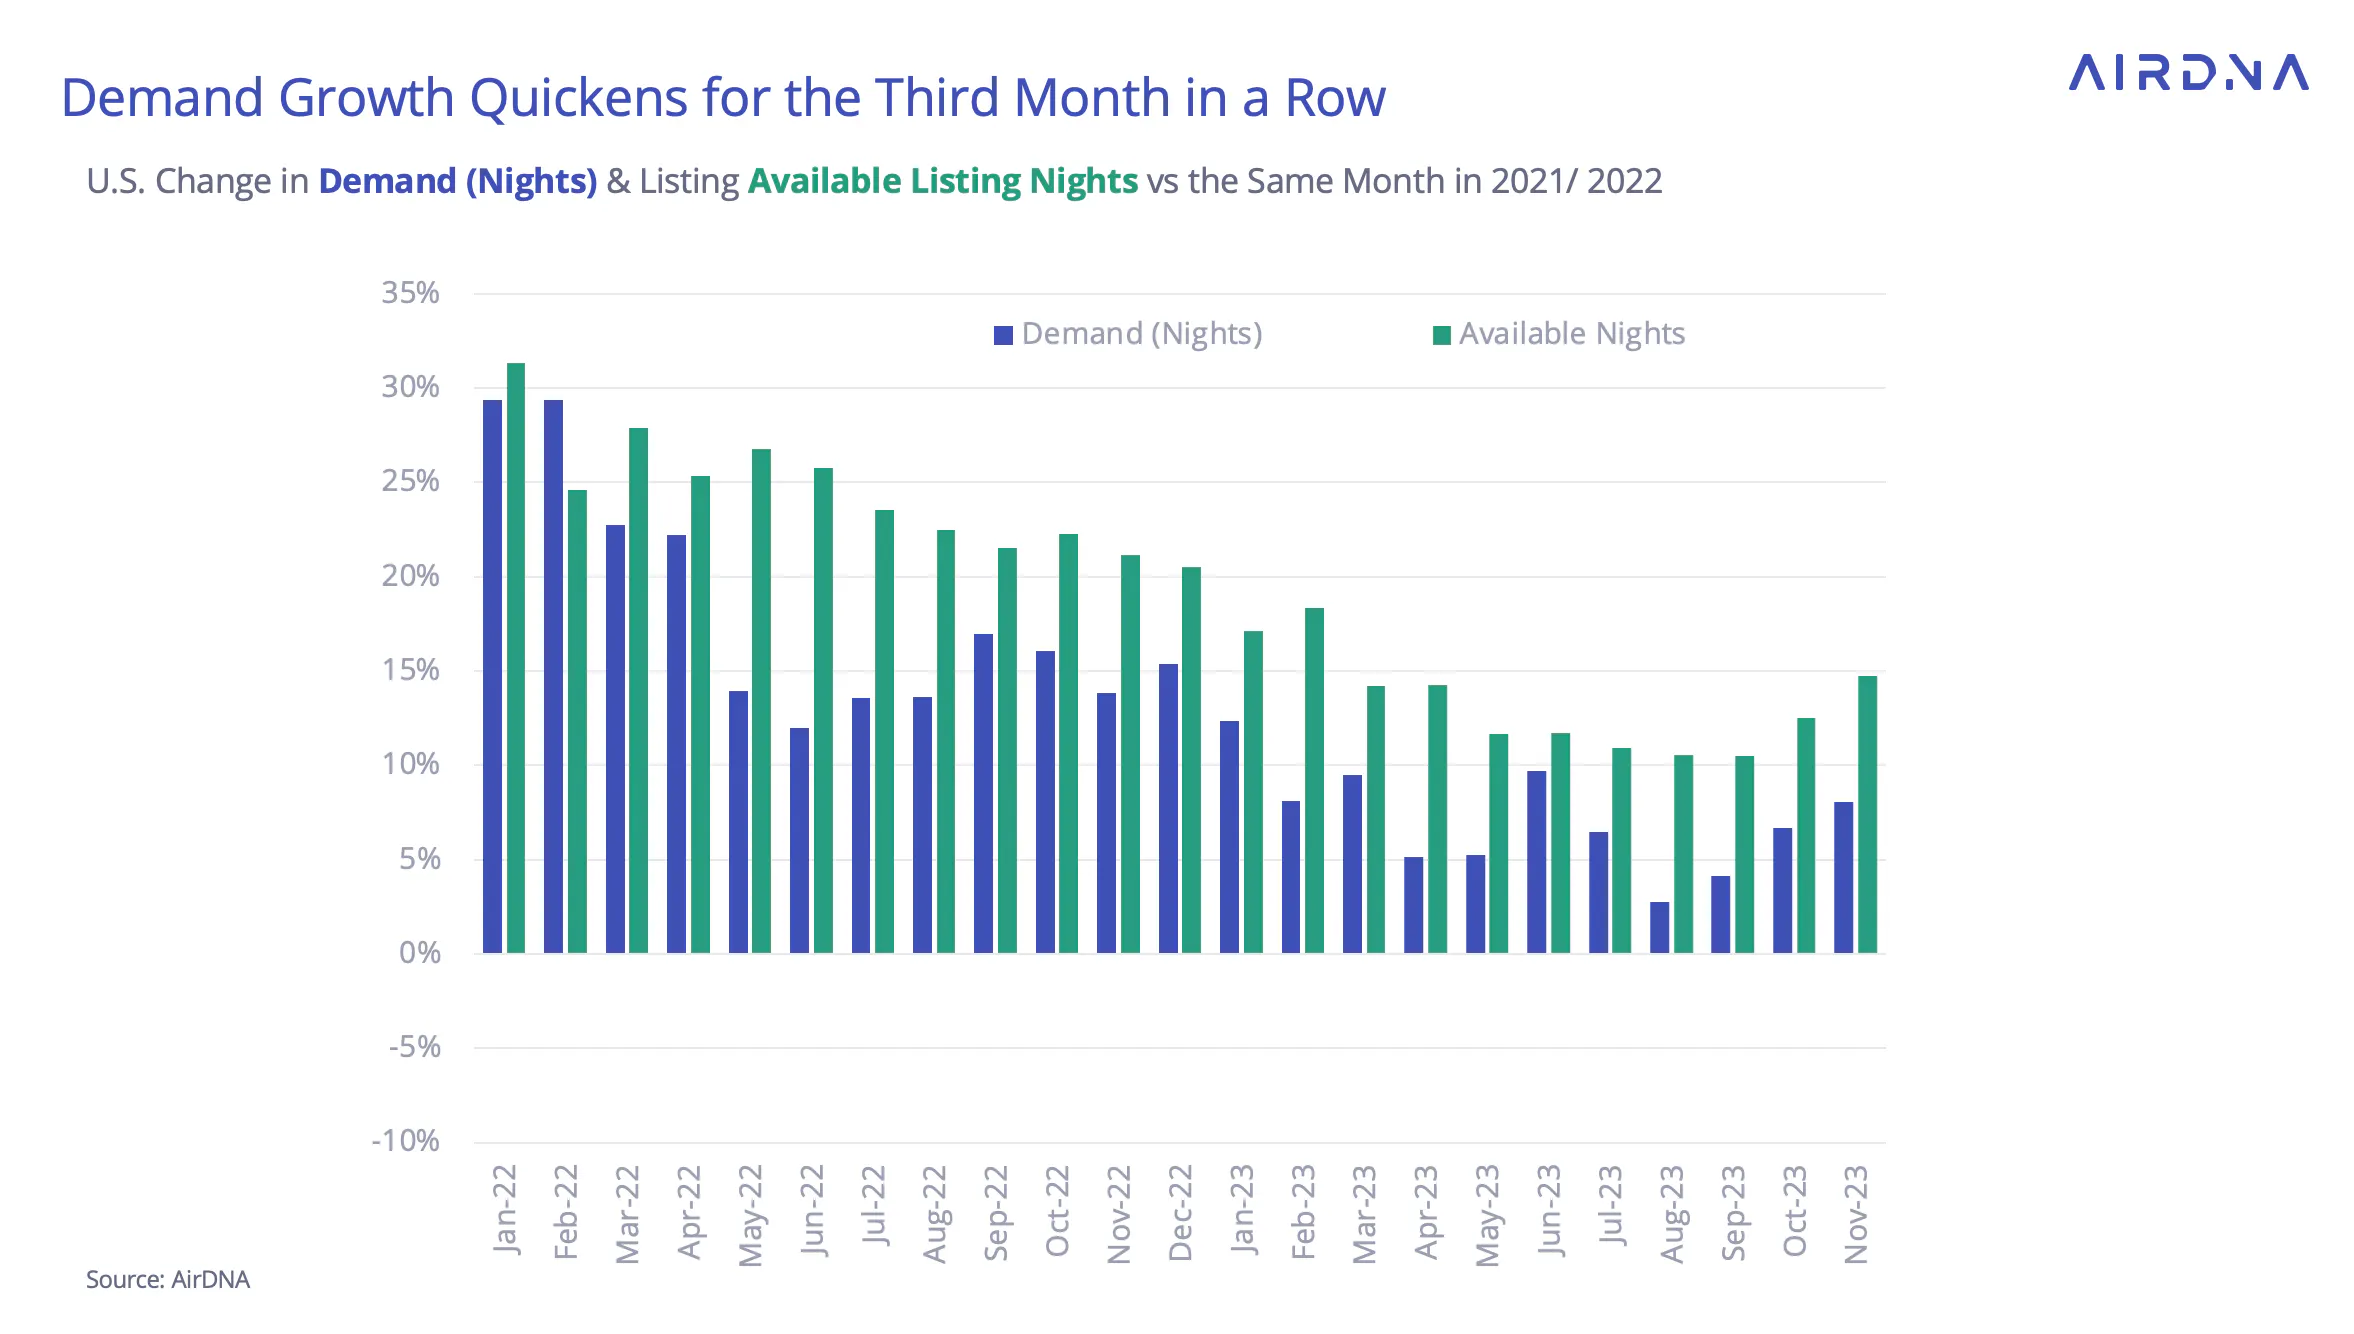
Demand has accelerated for the third month in a row in November, which has helped maintain property-level performance in the presence of higher supply. A sweltering August heat wave along with some unfortunate natural disasters may have accelerated an existing trend of interest in shoulder season travel, the period after the high summer season but before the usual annual aggregate low in February. Supply has accelerated its growth as well during the past two months, and the reinvigoration of the STR market after two years of slowing growth rates is well underway.
Balanced Growth in U.S. Market
The combination of recent supply and demand developments has established a pattern of balanced supply and demand. The first half of 2023 had slightly weaker occupancy than the 2019 pre-pandemic baseline, but after August, the two became much more closely aligned. November occupancy this year has even surpassed 2019 levels (by a slim margin of 0.6%) even as new listings have accelerated.
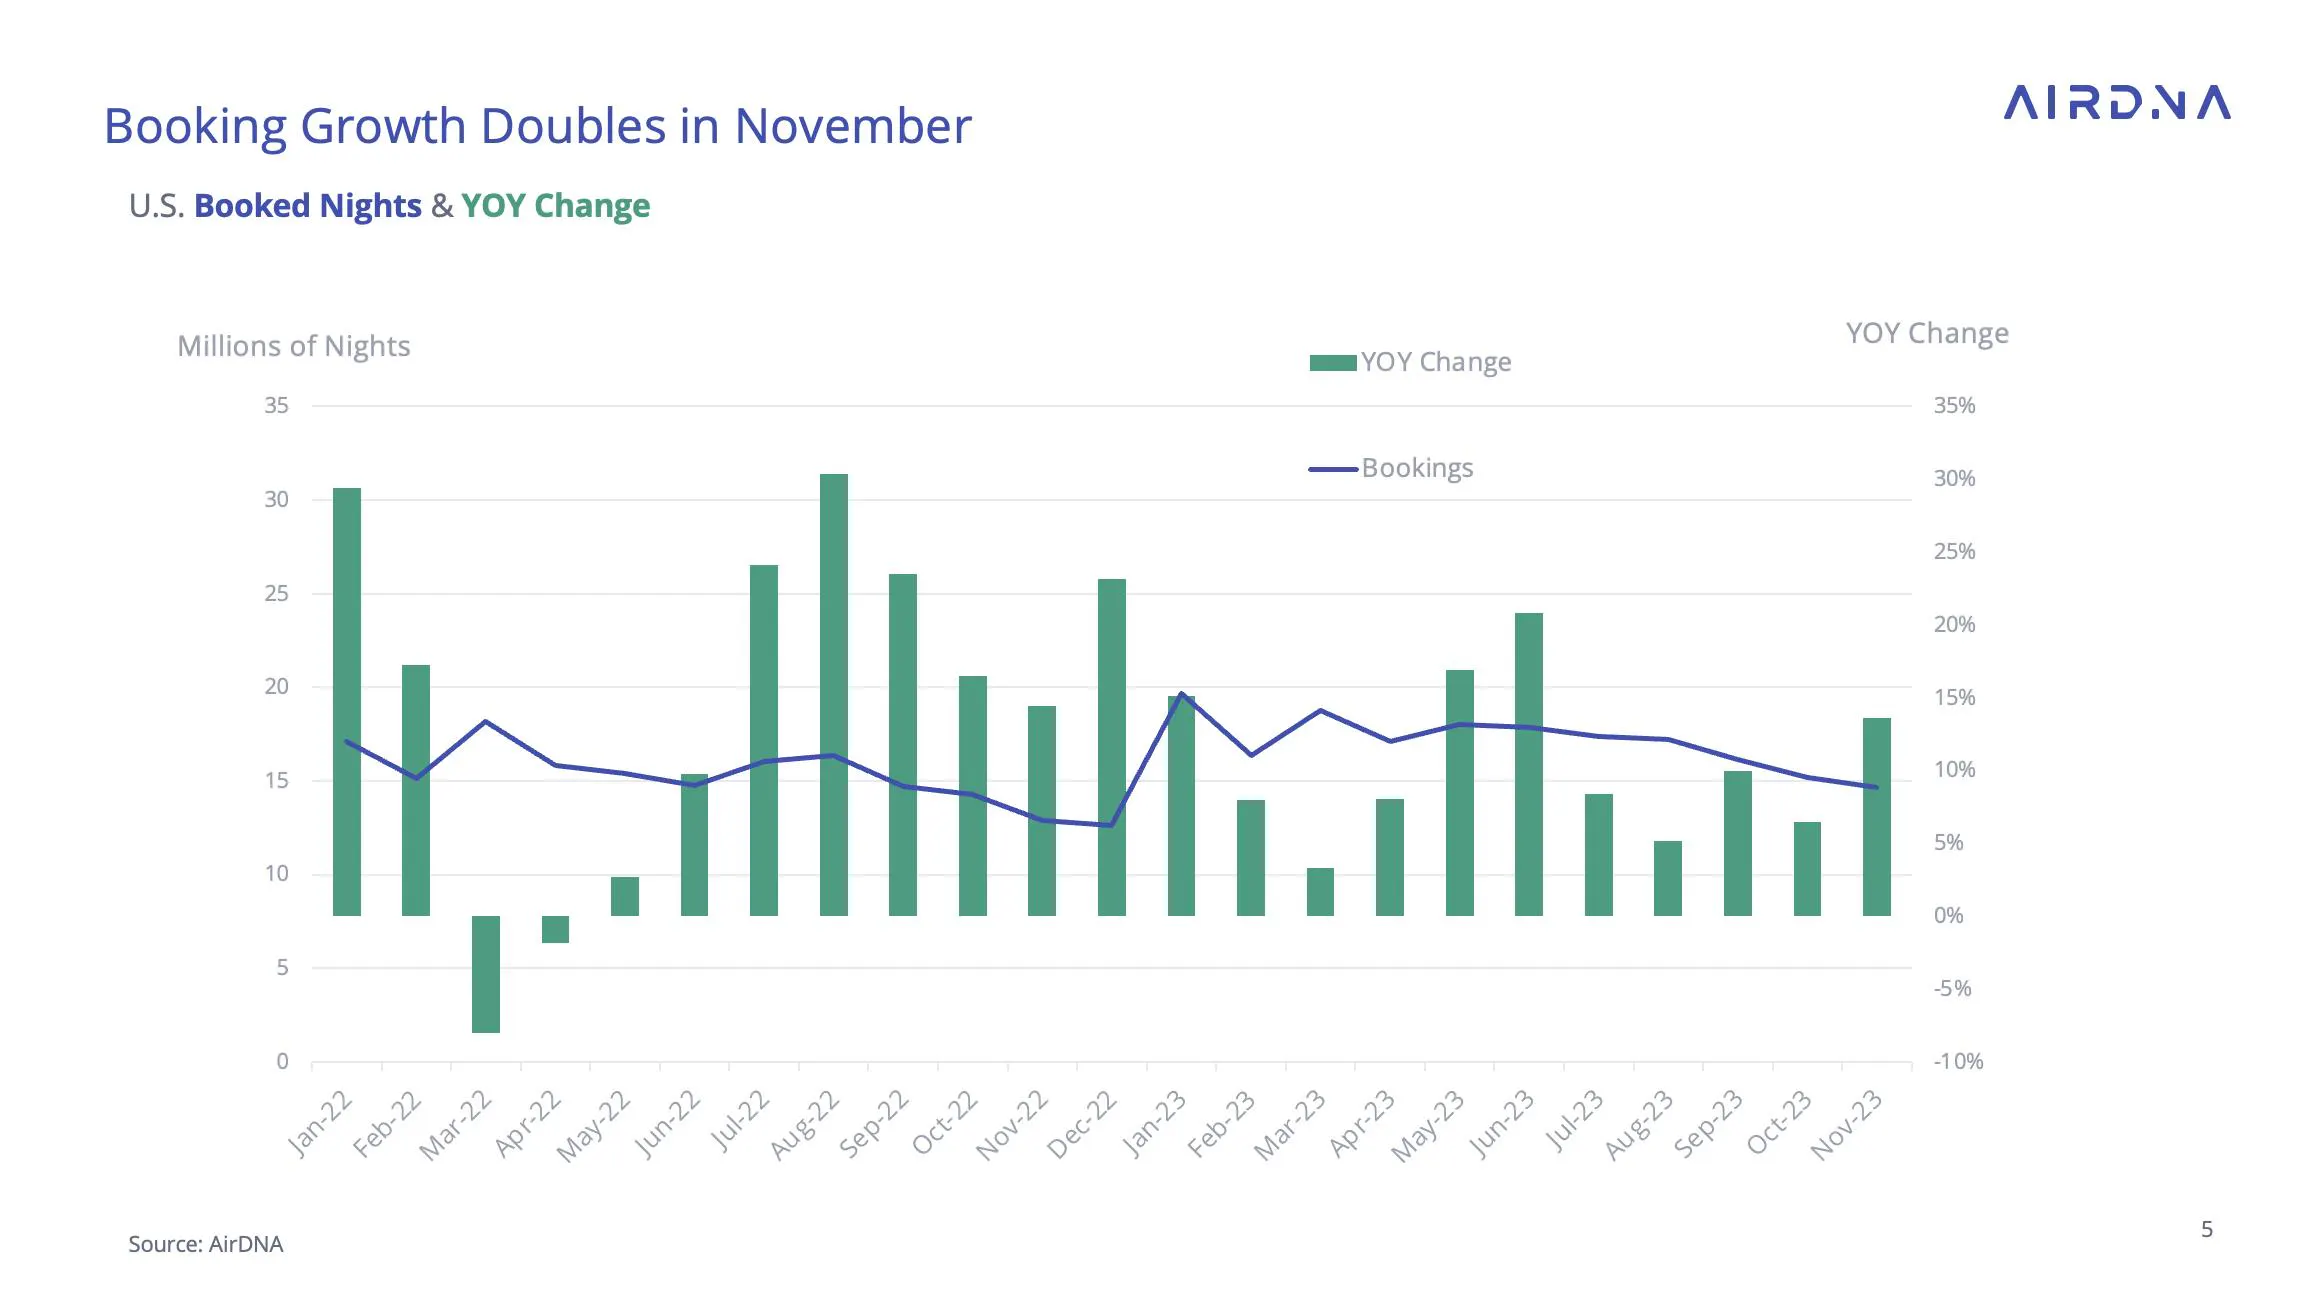
Bookings, a leading indicator for demand, jumped in November, leading to their highest YOY growth rate since June. This portends well for holiday travel, and there could be potential to see benefits in the spring shoulder season as well. There is usually a higher number of bookings in January than the months before it as attention is turned to the new year ahead. Whether or not January 2024 booking growth can follow November’s performance is a highly anticipated indicator.
A popular theory of hospitality markets, the “natural occupancy” theory, states that there is a level of occupancy which the market will settle into over a long enough period and that increasing or decreasing the occupancy from there is brought about by shocks to the system. In this case, pent-up demand and slow supply recovery led to extreme occupancy in 2021. As new supply enters the market to take advantage of the high performance, the occupancy sinks back to its natural level. This theory appears to fit the observed behavior of the STR market very well, and barring a slight over-correction in the beginning of the year, occupancy has settled back into its long-run level.
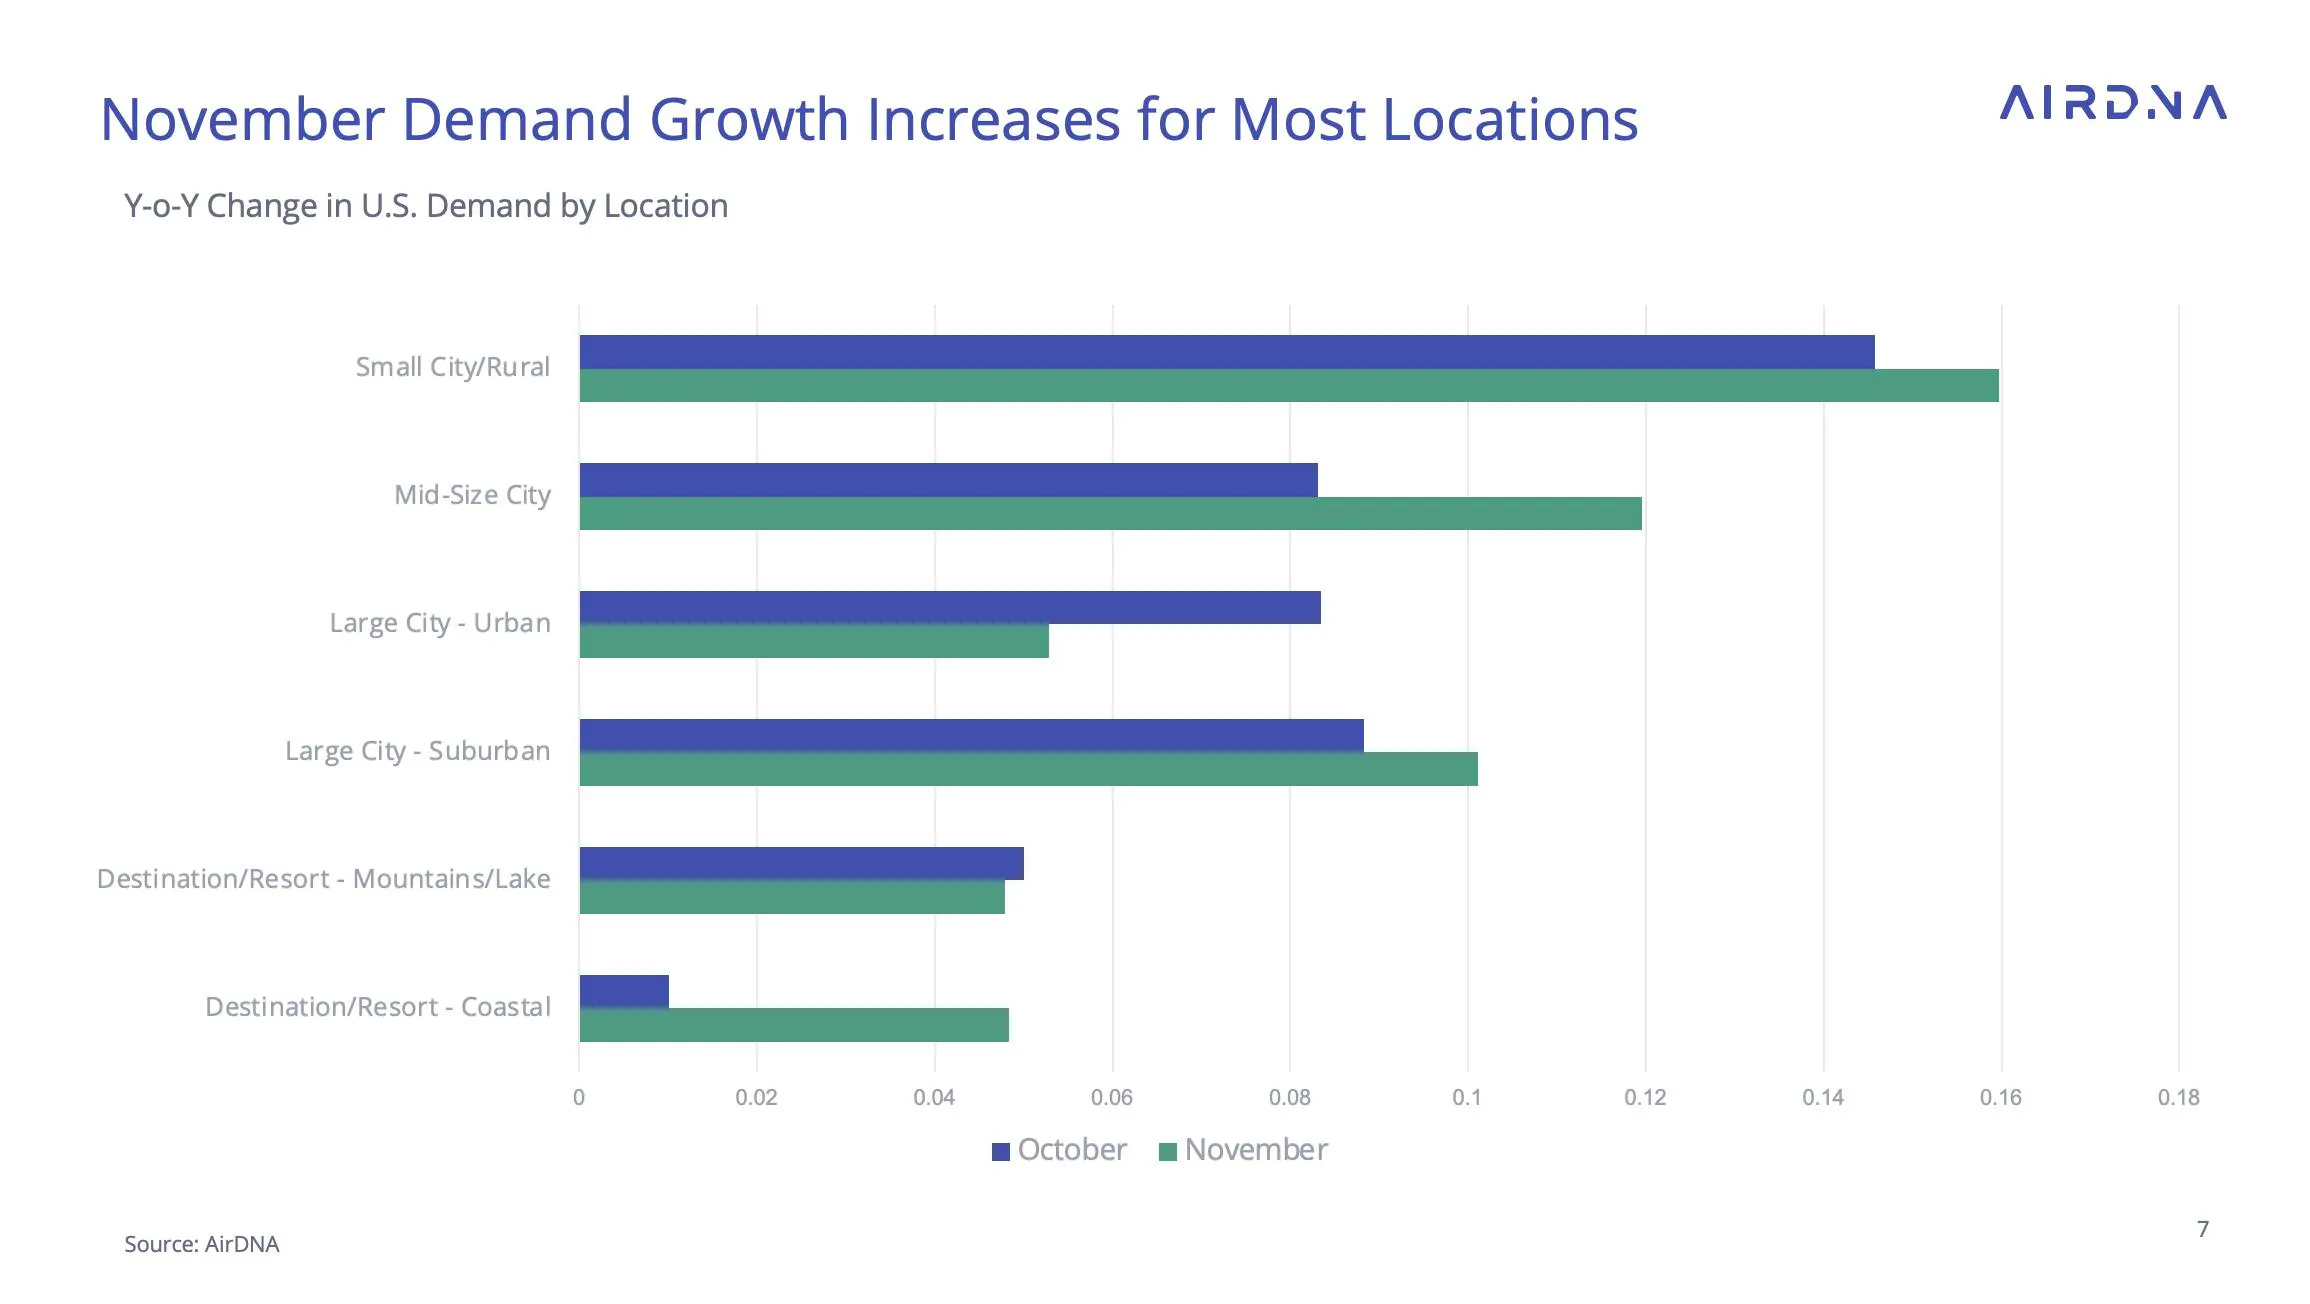
Turning to locations, demand growth accelerated in small city/rural, mid-size city, suburban and coastal locations but slowed significantly in urban. Mountain/lake markets also slowed slightly. For much of 2022 and early 2023, urban locations had growth rates among the highest of the locations. It has steadily diminished its demand growth but still remains just barely ahead of the resort locations. Perhaps due to competition from overseas destinations and cruises, stiff price increases in 2022, or simply full locales, coastal and mountain resorts have had the most sluggish growth rate of 2023.
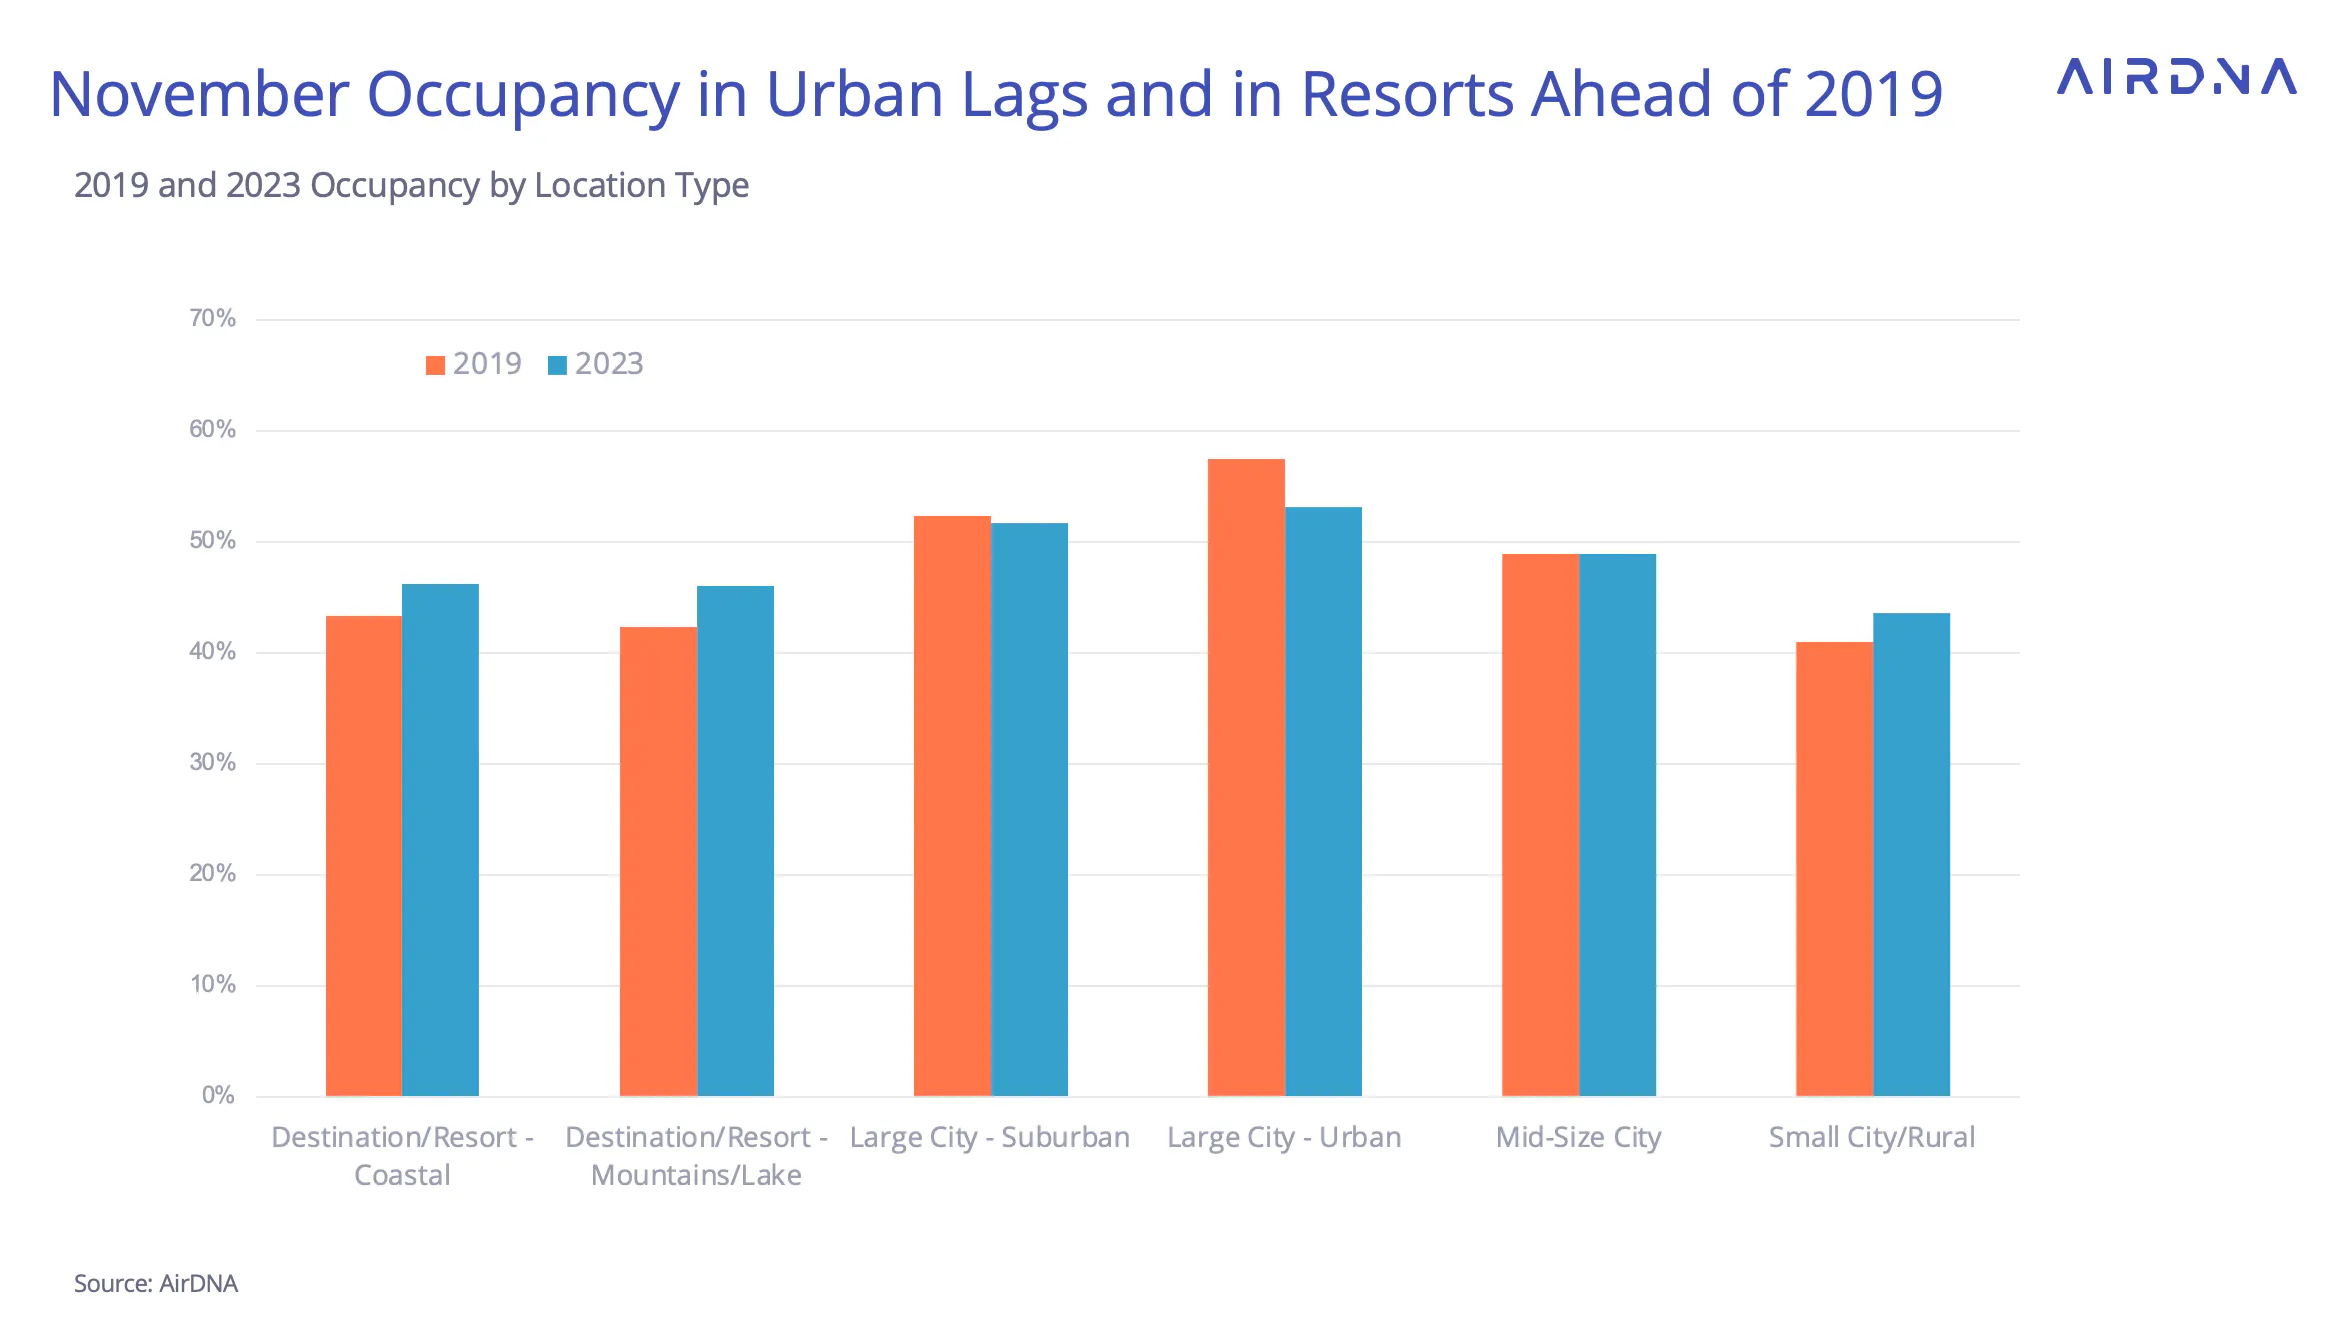
On the other hand, coastal/mountain locations may have had difficulty growing demand in 2023 because of their past success. Occupancies in these two location types are still meaningfully higher than prior to the pandemic, and with difficulty developing along coasts and rugged mountains combined with the highly seasonal nature of demand in these markets, faster demand growth may not be difficult or less than optimal.
Urban locations’ occupancy still lags behind 2019 levels. Nevertheless, urban occupancy is still the highest of all location types. Conversely, small city/ rural locations, which have consistently led the locations in demand growth, still retain the lowest occupancy levels. Regulations that have the effect of dampening supply in urban areas was a trend which may continue shifting development interest to less populous areas. Potentially, this shift could nudge occupancies among locations closer to 2019 levels.
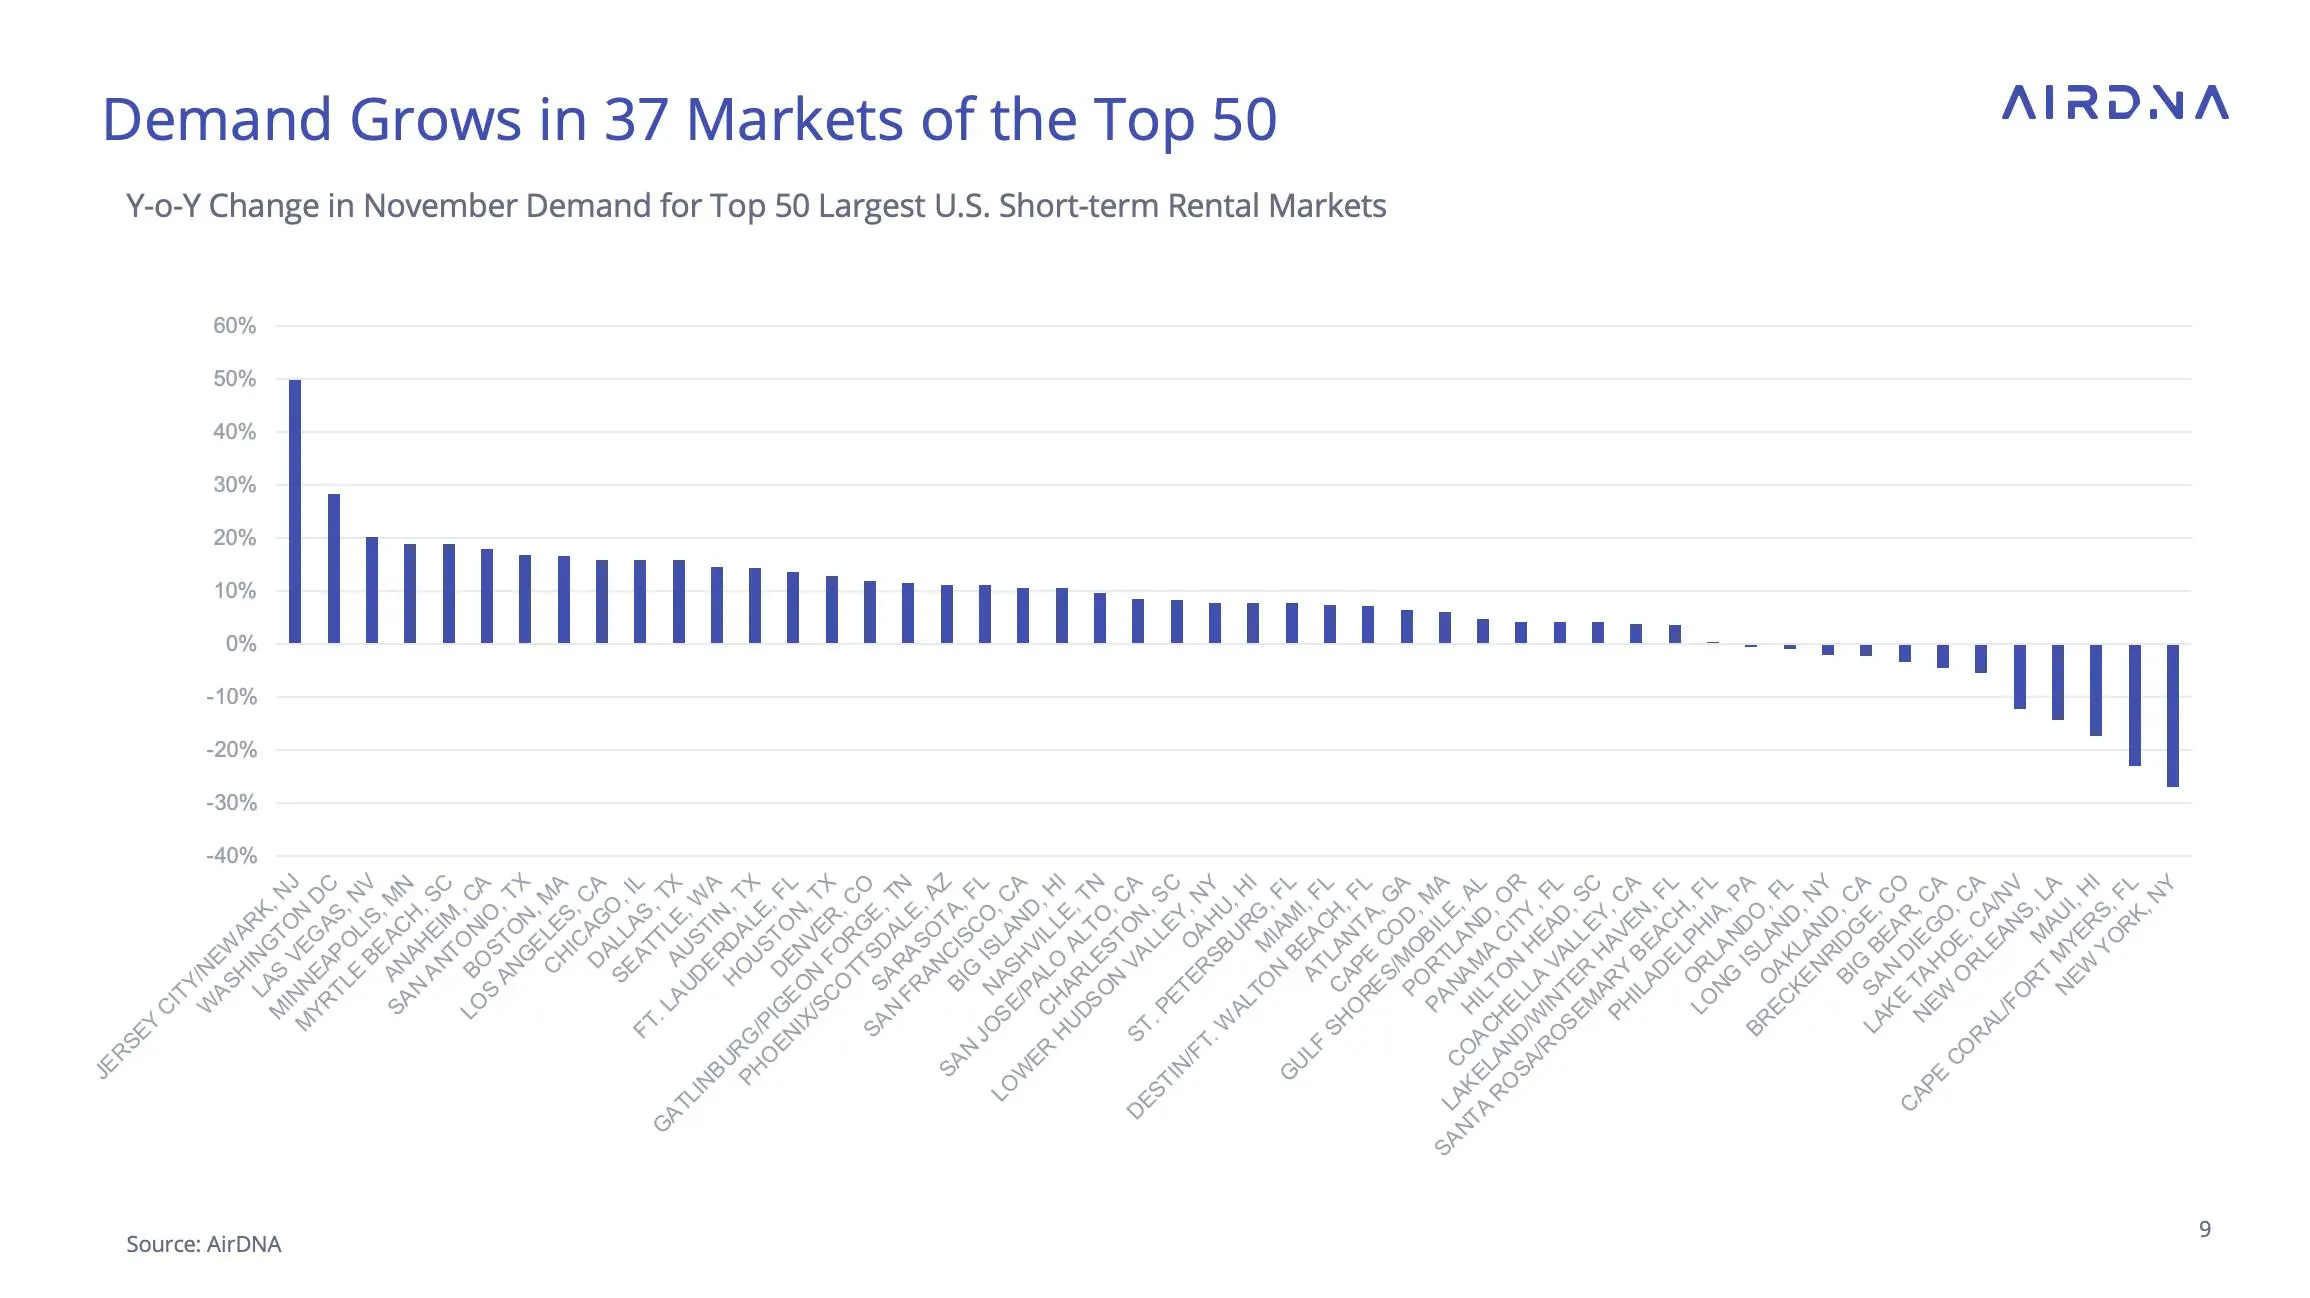
Examining market demand reveals that renewed regulation enforcement in New York is already having a substitution effect, albeit one urban market for another. Jersey City/ Newark easily won the top spot for demand growth with nearly 50% more nights stayed in November compared to last year. Washington DC (+28.2%) had the second-highest growth rate.
Although an off-year for Federal elections, high-stakes primary elections and efforts to head a government shutdown seem to have kept the Capitol busy. Las Vegas(20.1%) rounded out the top three demand locations with the Las Vegas Grand Prix and recently opened Sphere attracting global crowds.
Demand Setbacks and Optimistic Pacing in U.S. Travel Markets
The three lowest-performing demand growth markets each had a significant event that detracted from demand. New York (-27.0) stepped up enforcement of STR, sharply contracting the availability of rentals for less than 30 days. Cape Coral/ Ft. Myers (-23.0%) is still recovering from Hurricane, a deadly storm which more than a year ago caused extensive damage. Maui (-17.3%) continues to recover from recent wildfires. In each of these cases, demand for travel remains strong, but supply constraints limit how much of it can be accommodated.
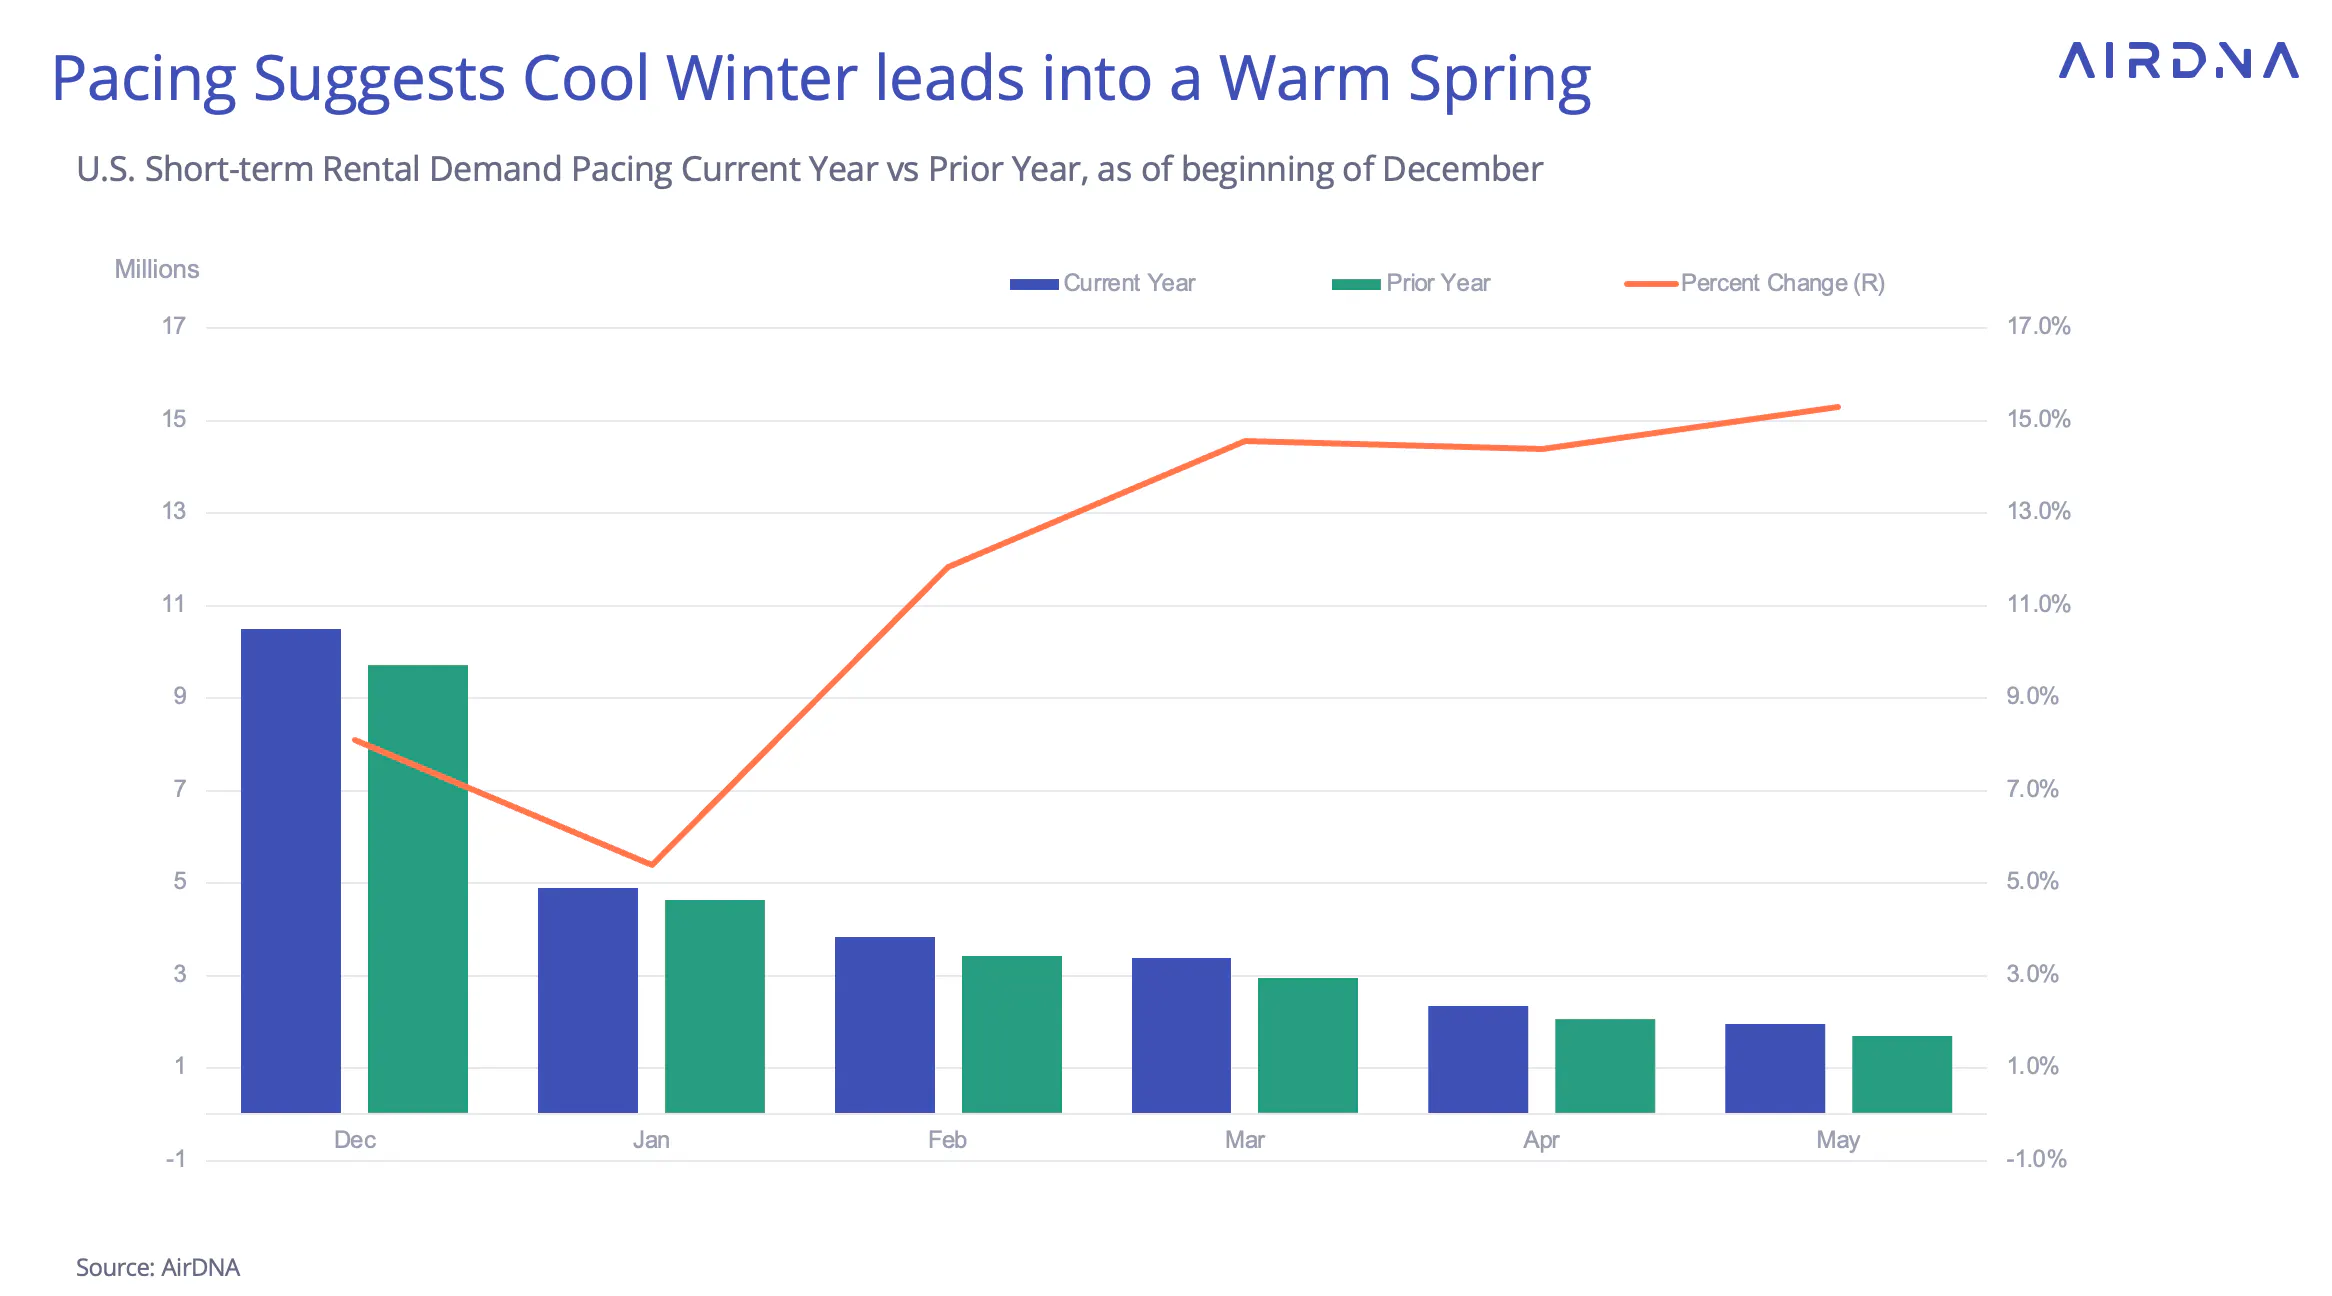
Turning to demand pacing, recent activity suggests that newly optimistic consumers are already beginning to plan ahead for travel in the New Year. While pacing for December and January are up by 8.1% and 5.4%, respectively, months after that are pacing between 12-15% higher than in the same period a year prior.
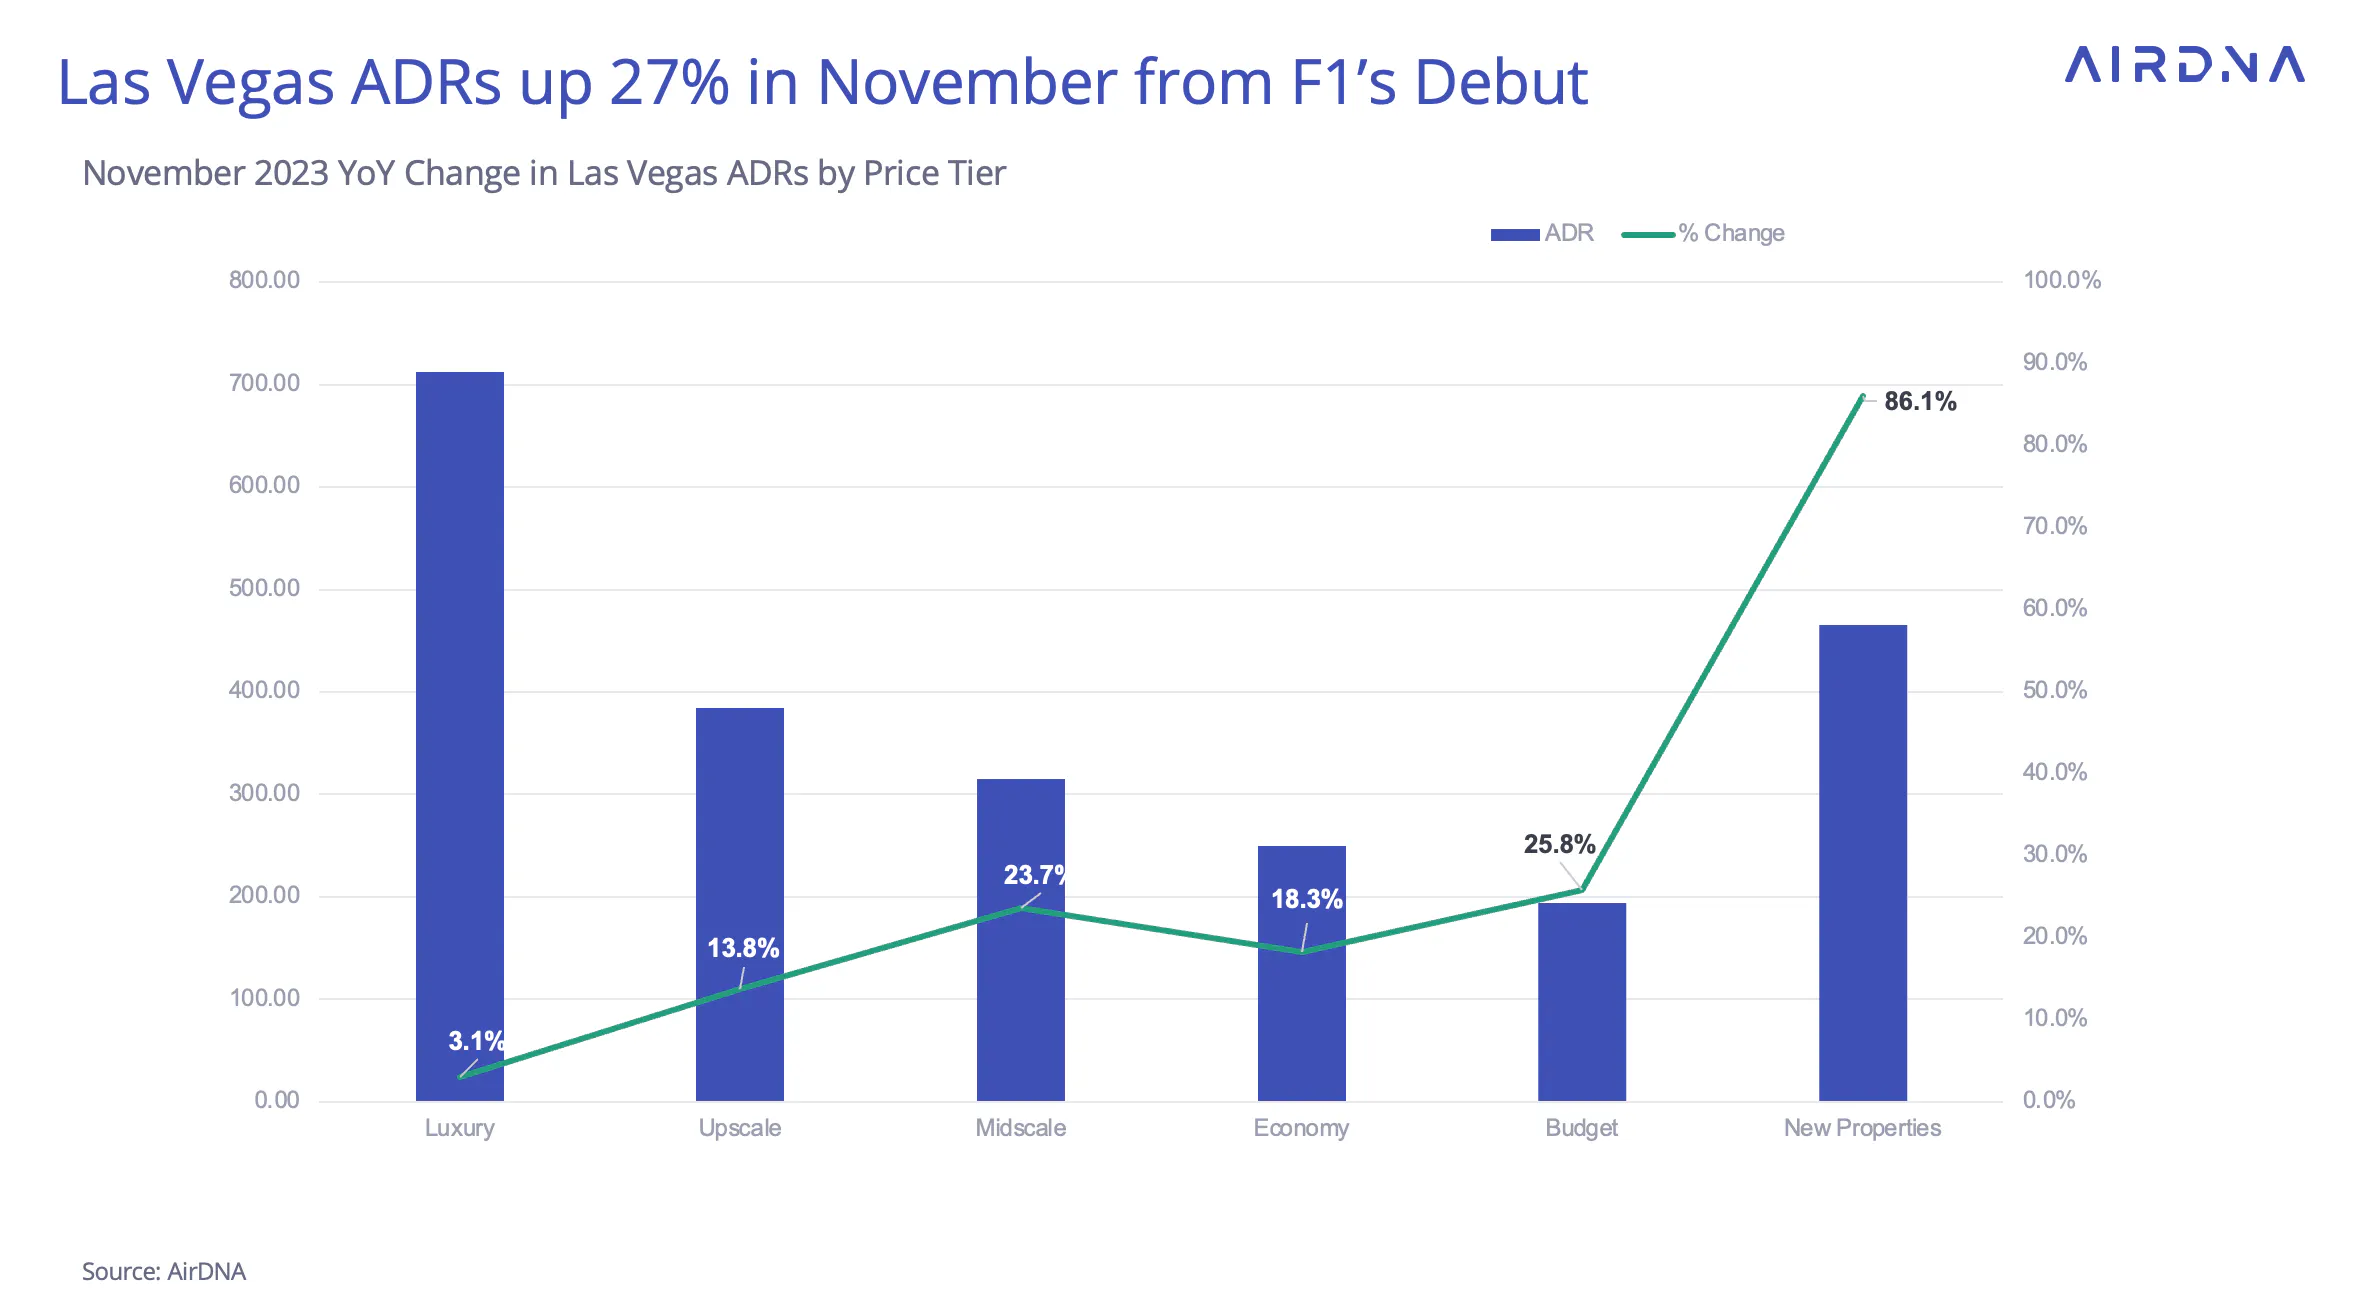
The Las Vegas Grand Prix brought more than just demand growth to the market in November, rates in the Las Vegas market also saw significant growth. Although the audience of the Grand Prix was expected to be spendier than the average traveler, the impact of the rate increases across price tiers showed a similar pattern to the nation of rate compression. This means that higher-priced tiers such as Luxury(+3.1%) were not able to raise rates as much as the lower tiers, such as Budget(+25.8%) on a percentage basis.
This causes the prices paid in all tiers to become closer. On the other hand, new listings in Las Vegas saw the highest ADR growth of all, at 86.1%, suggesting that operators intended to capitalize on the demand from the Grand Prix.
Find For-Sale Properties for Your STR Investment with AirDNA

Check out for-sale properties with our revenue projections that will help you make smarter, faster investment decisions.
ARTICLE SUMMARY
The U.S. short-term rental market continued its upward trend in November, marking the third consecutive month of increased demand. Despite a moderate decline from previous highs, the market shows resilience, achieving occupancy levels comparable to those before the pandemic, with positive indicators for the upcoming year.
Jamie Lane
AirDNA Chief Economist
He is responsible for data analysis, thought leadership, and leveraging advanced analytical techniques to provide new insights into short-term rental market trends. Native to Atlanta and an Airbnb host himself, Jamie enjoys cycling, mountain biking, backpacking, running, and playing in a dart league in his free time.
