

 Calculate Revenue
 Research Markets
 Find For Sale Properties
 Compare My Listing
 STR Revenue Calculator
 Custom Comp Sets
 Submarket Insights
 Custom Search Filters
 Rate Recommendations
 Performance Benchmarking
 Competitor Comparison
 Owner Contact Details
 Property-level performance data
 Tourism Insights
 Real Estate Investment Analytics
 About Us
 Sales
Sales Support
 Press
PressEuropean Market Review: Strong July Demand Meets First ADR Decline in 20 Months
Published: August 22, 2024
Last updated: February 26, 2025

Linda Rollins
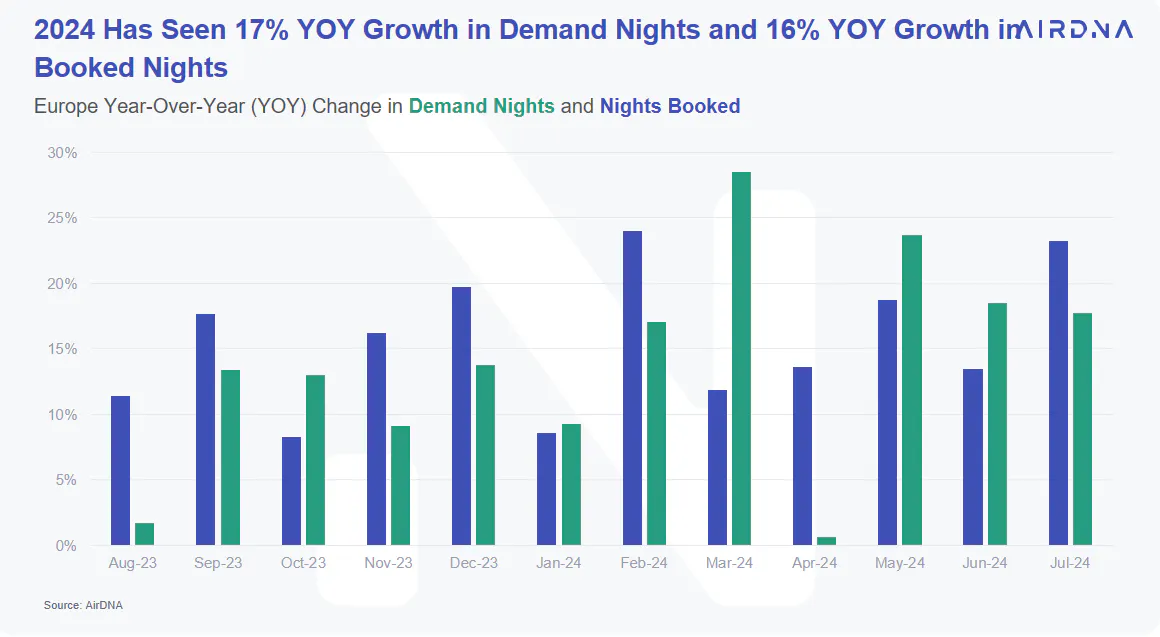
Summer travel demand showed no signs of slowdown in July. Total demand nights for the European continent reached 57.6M nights, up 17.7% year-over-year (YOY). July is typically the month when supply peaks in Europe.
Available listings last month hit a new record high of 4M in Europe, up 15% YOY and 5% from June. Demand resilience kept occupancy positive, and last month’s occupancy averaged 68% across the European continent, up 0.3% YOY.
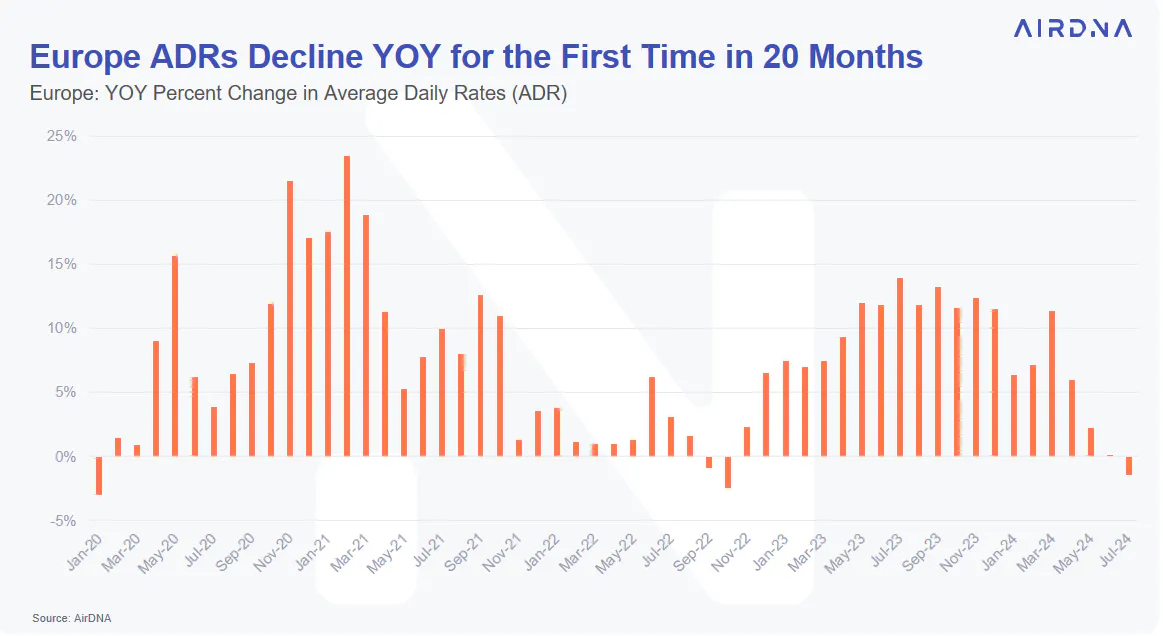
Despite the strength of supply, demand, and occupancy, last month was also the first month that Europe saw YOY Average Daily Rate (ADR) decline in 20 months. After nearly two years of consistent YOY ADR growth, ADRs last month were down 1.5% YOY. Negative ADR growth also turned RevPAR growth negative. RevPARs across Europe were down 1.2% YOY.
Smart investments happen here.
Make hosting and investing a breeze with the right data. You'll have every insight you need, all in one place, always up-to-date.
At a Glance: July STR Performance in Europe
- Available listings totaled 4M, up 15% year-over-year (YOY)
- Demand reached 57.6M, an increase of 17.7% YOY
- Average daily rates (ADR) averaged €174, down 1.5% YOY
- Average occupancy was 68%, up 0.3% YOY and down 2.8% compared to 2019
- Revenue per Available Rental (RevPAR) decreased 1.2% YOY to €119
- Booked nights increased 23.2% YOY

The State of the European Economy
In its June macroeconomic projections report, the European Central Bank’s (ECB) updated forecasts for inflation, GDP, and employment growth, reflected optimism about the future of the European economy. In March, the ECB forecasted 0.6% GDP growth for the European economy in 2024, but in its most recent forecast, the central bank revised its projection by 0.3 percentage points to 0.9%. Higher-than-expected growth in net trade and strong consumer spending in the first quarter of 2024 both contributed to the ECB’s upward revision.
The ECB maintains that a strong labor market and declining inflation will enable private consumption growth to be the most significant driver of GDP growth in 2024. Employment is expected to grow 0.8% in 2024 and another 0.4% in 2025. Inflation, which stood at 2.5% in June, is expected to hover around 2.5% for the remainder of the year and decline to 2.2% in 2025. With resilience in the labor market and an expected increase of 1.9% in household disposable incomes this year, the ECB predicts that private consumption will grow by 1.2% in 2024 and 1.7% in 2025.
As for interest rates and the housing economy, the ECB noted that high interest rates continue to have a negative impact on economic growth and home purchases but that the impact will start to ease in the second half of the year as financing conditions improve. The ECB announced its first interest rate cut in June. The current key bank rate stands at 3.75% and there is high expectation that more cuts are coming.
Growth in short-term rental demand and bookings thus far in 2024 aligns with the ECB’s projections of increased consumer spending. Short-term rental bookings and stays have been at all-time highs this year and growth has not slowed. Year to date, short-term rental bookings have been up 16% YOY and stays have been up 17% YOY.
European ADR Growth Has Slowed in 2024
Over the last five years, Europe has consistently seen YOY ADR growth. ADR growth in 2020 and 2021 was largely driven by rising home prices and limited short-term rental supply recovery in the face of high STR demand. In 2022 and 2023, inflation and persistent STR demand growth led to an increase in ADRs. However, since the first quarter of this year, we’ve seen ADR growth slow significantly as supply growth has been chipping away at the pricing power of hosts. Last month, ADRs in Europe were down YOY for the first time since fall of 2022.
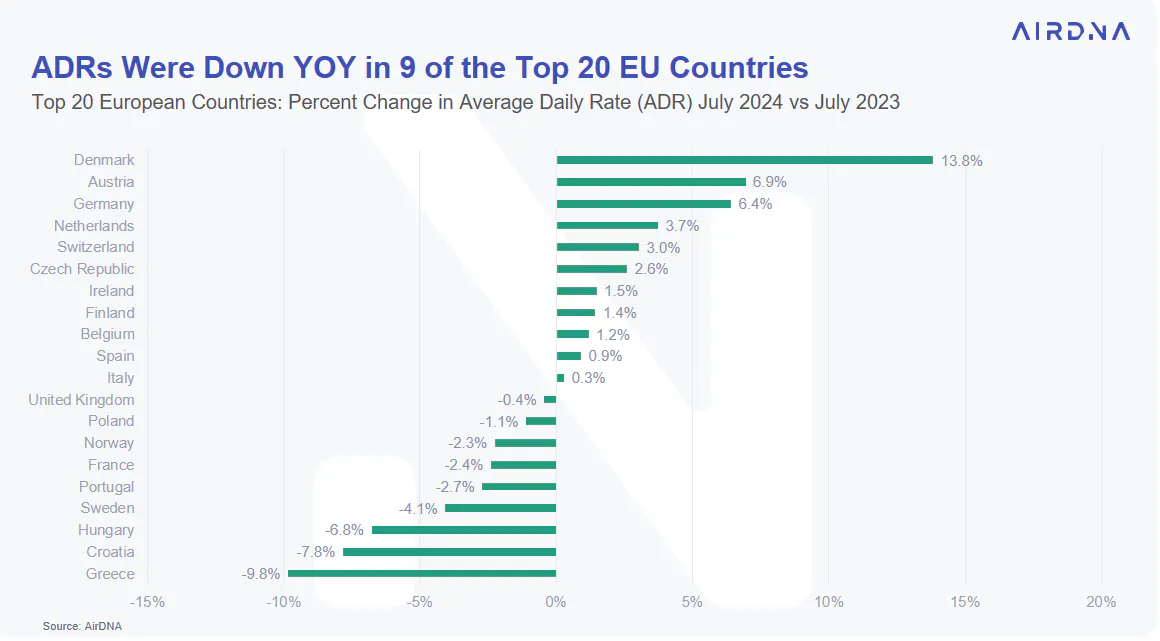
Not all European countries experienced a YOY ADR decline in July. Among the top 20 European countries, nine saw July ADRs decline. For countries like Norway, Sweden, and Greece, the YOY ADR decline has consistently coincided with occupancy declines, which resulted from supply growth far exceeding demand growth. ADRs have only begun to see a YOY decline this summer for other countries, such as Hungary, the UK, and France.
France ADRs Down 5% YOY Outside of Île-de-France
France is the most prominent country among the nine countries that experienced YOY ADR declines. As the largest STR market in Europe, making up nearly 25% of all European STR demand, the French market has a large influence on the overall performance of the European market.
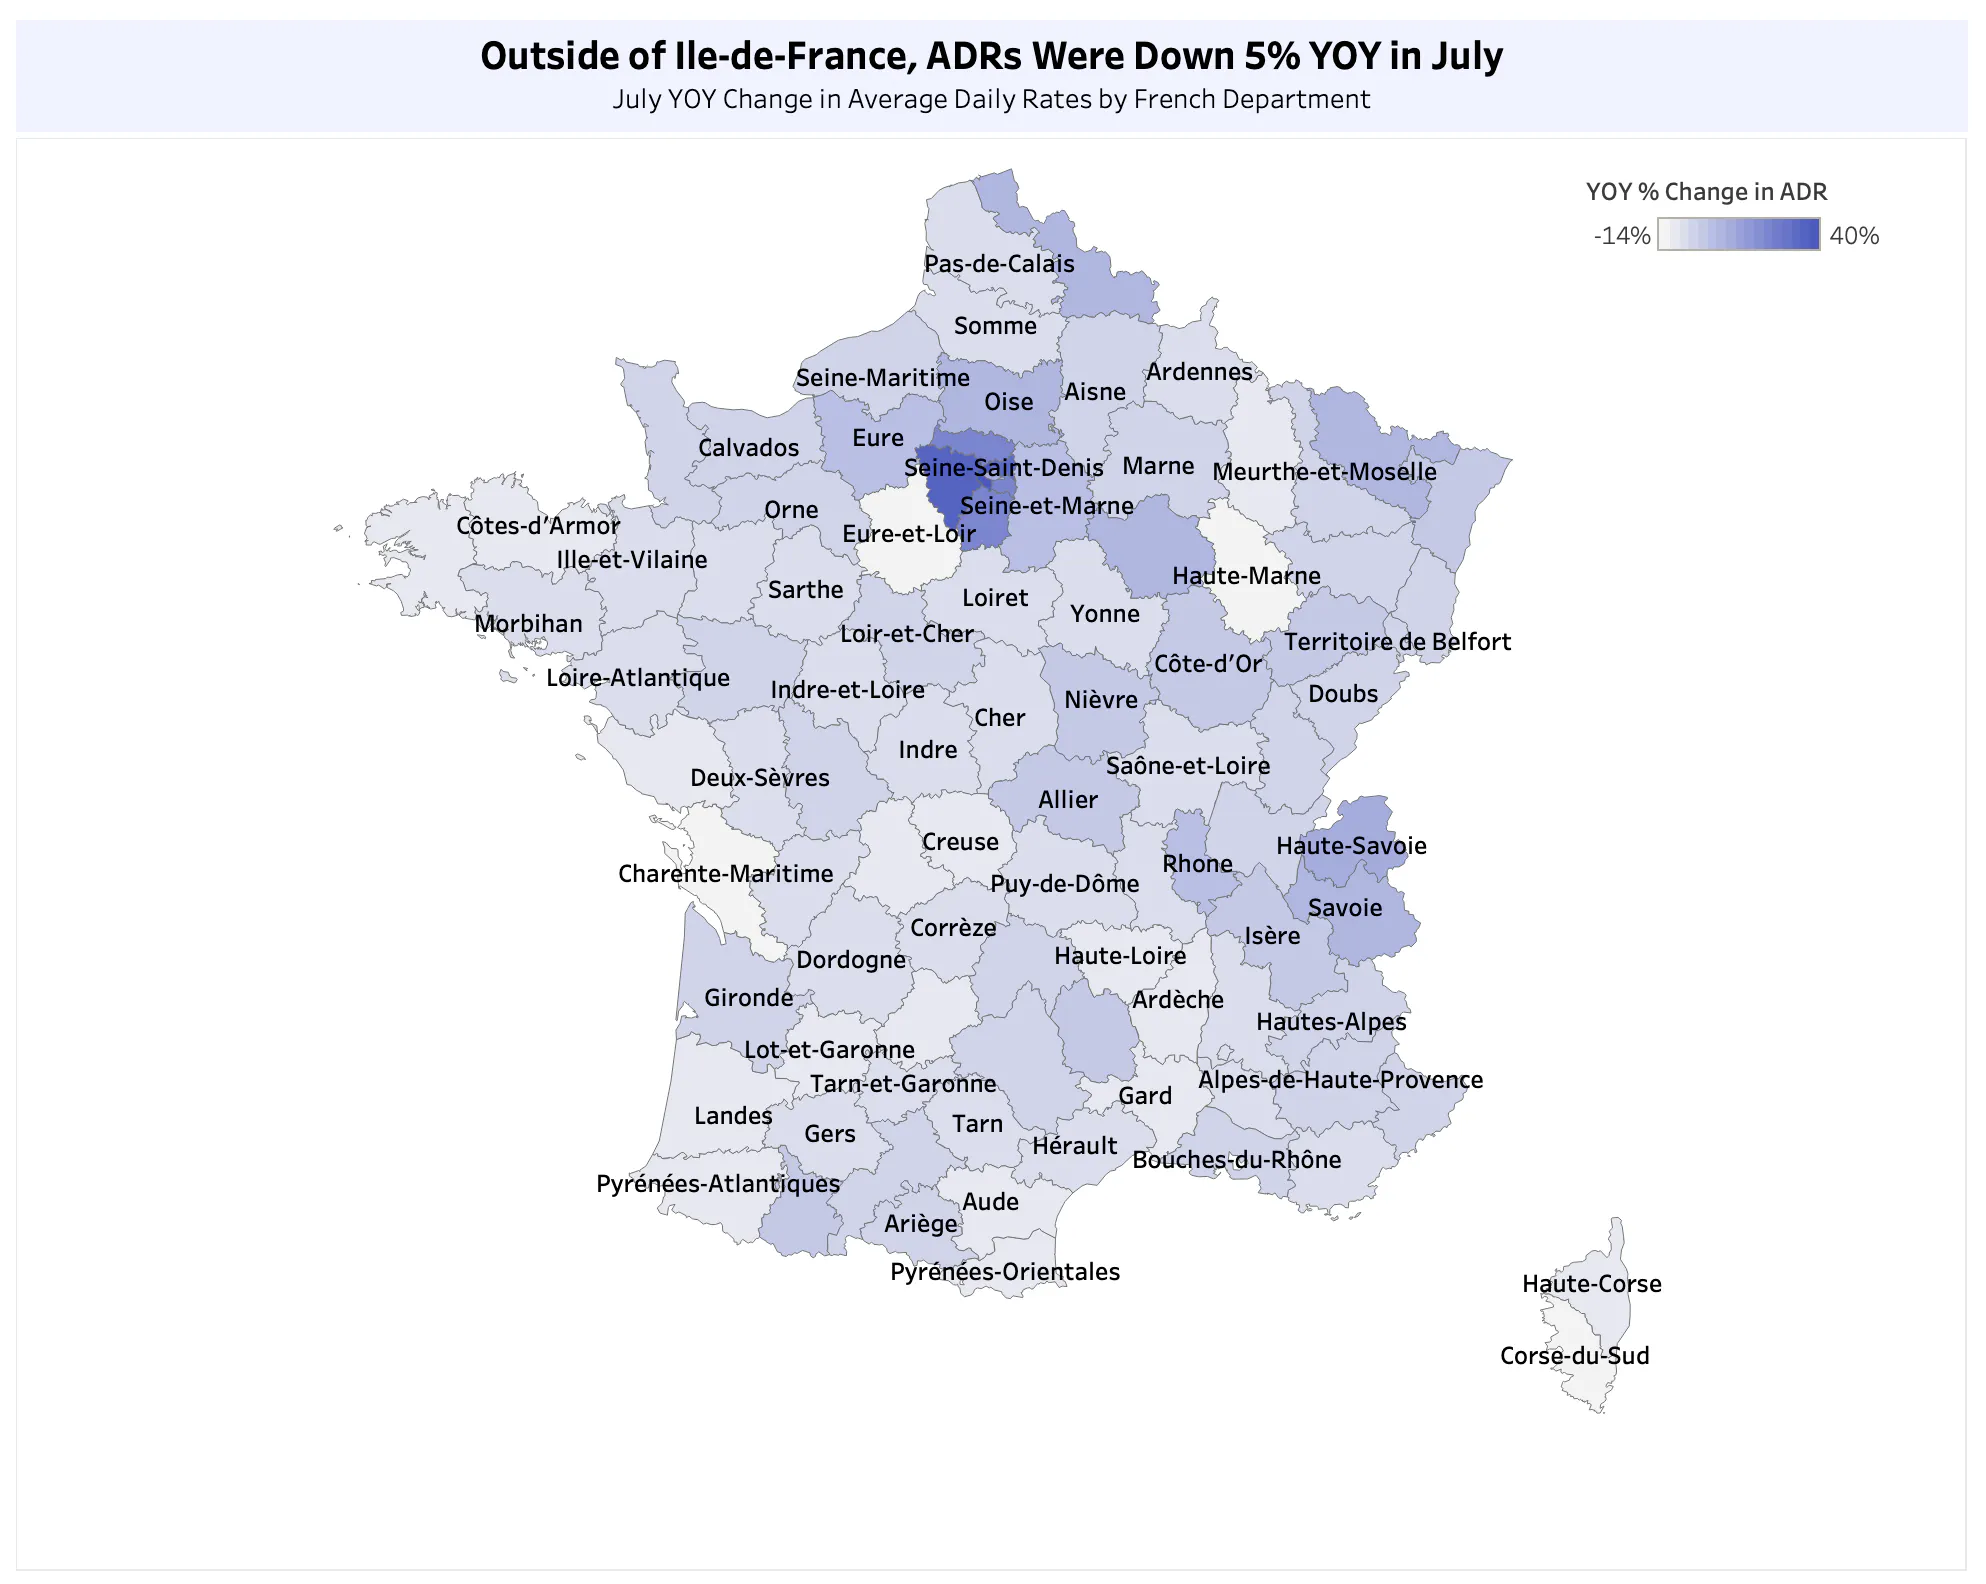
To separate the impact of the Paris Olympics on France's ADR performance in July, we looked at July's ADR performance for all 96 metropolitan French departments.
For the French department of Paris, YOY ADR growth for the month of July was 10%. However, the first three weeks of July saw significantly lower ADR growth (+6% YOY) than the last week of July when the city was hosting the Olympics (+21% YOY).
Similar to Paris, the Paris suburbs saw modest ADR growth for the first three weeks of July but enjoyed significant ADR boosts during the last week of July. Below is YOY ADR growth for the month of July for the 7 French departments surrounding Paris that hosted Olympic main events:
- Hauts-de-Seine (+40% YOY)
- Yvelines (+36% YOY)
- Seine-Saint-Denis (+32% YOY)
- Essonne (+24% YOY)
- Val-de-Marne (+23%)
- Val-d’Oise (+23%)
- Seine-et-Marne (+2%)
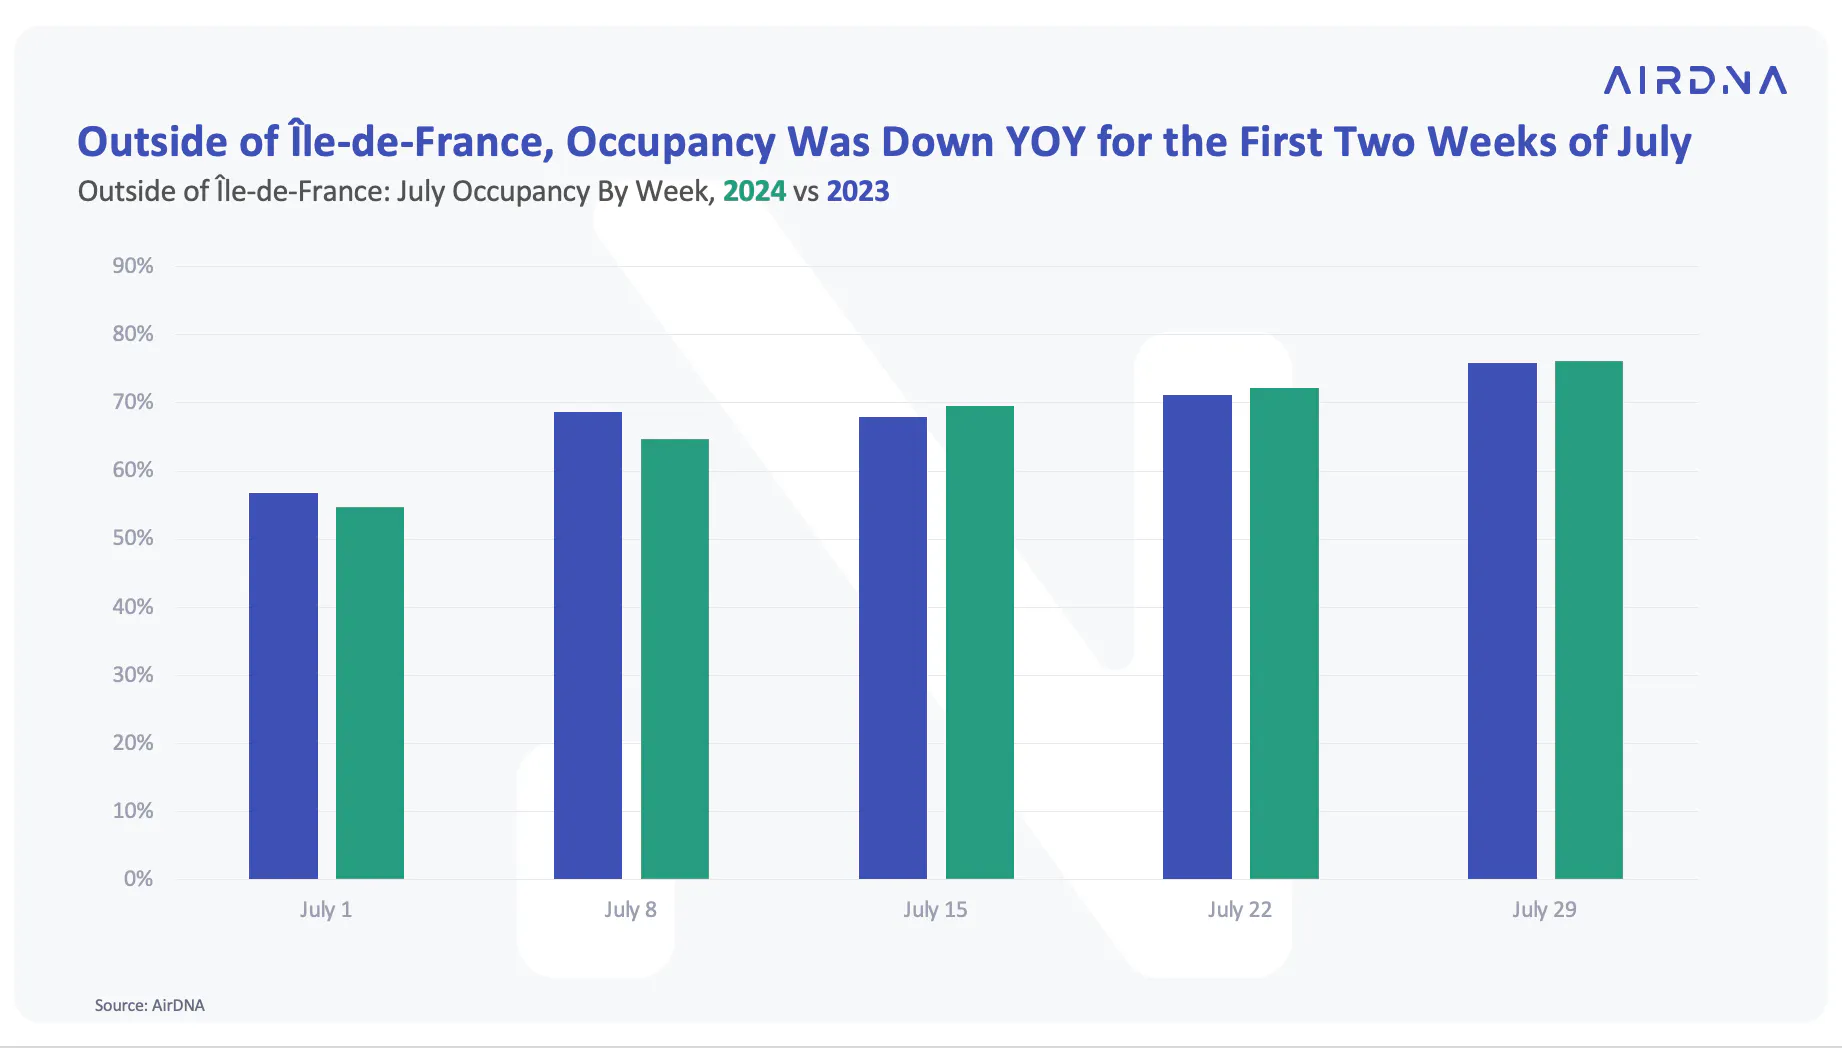
Outside of Île-de-France, July ADR performance was much weaker. ADRs for the 88 French departments outside Île-de-France were down 5% YOY for July. The French departments that saw the steepest YOY ADR declines in July were:
- Haute Marne (-14% YOY)
- Corse-du-Sud (-13% YOY)
- Eure-et-Loir (-11% YOY)
- Charente Maritime (-11% YOY)
- Lot-et-Garonne (-10% YOY)
For many of the French departments outside Île-de-France, declining ADRs corresponded with weak occupancy. Looking at occupancy by week, the first two weeks of July saw significant YOY occupancy declines due to low demand. Occupancy improved slightly during the last two weeks of July.
Try Our Vacation Rental Pricing Tool
Use Smart Rates™ to optimize your pricing strategy.

Paris Olympics Recap
With the Paris Olympics officially over, here’s a recap of the short-term rental industry’s gold medal performance in Paris.
Demand: 743K total nights were spent in the Paris metro area for the Paris Olympics, marking a staggering 90% YOY increase. Assuming each booked listing was at maximum occupancy, this means short-term rentals in the Paris metro area hosted nearly 700K guests and over 2.7M guest nights. We saw the greatest demand spikes on Olympic weekends and the average length of stay was about 3.5 nights.
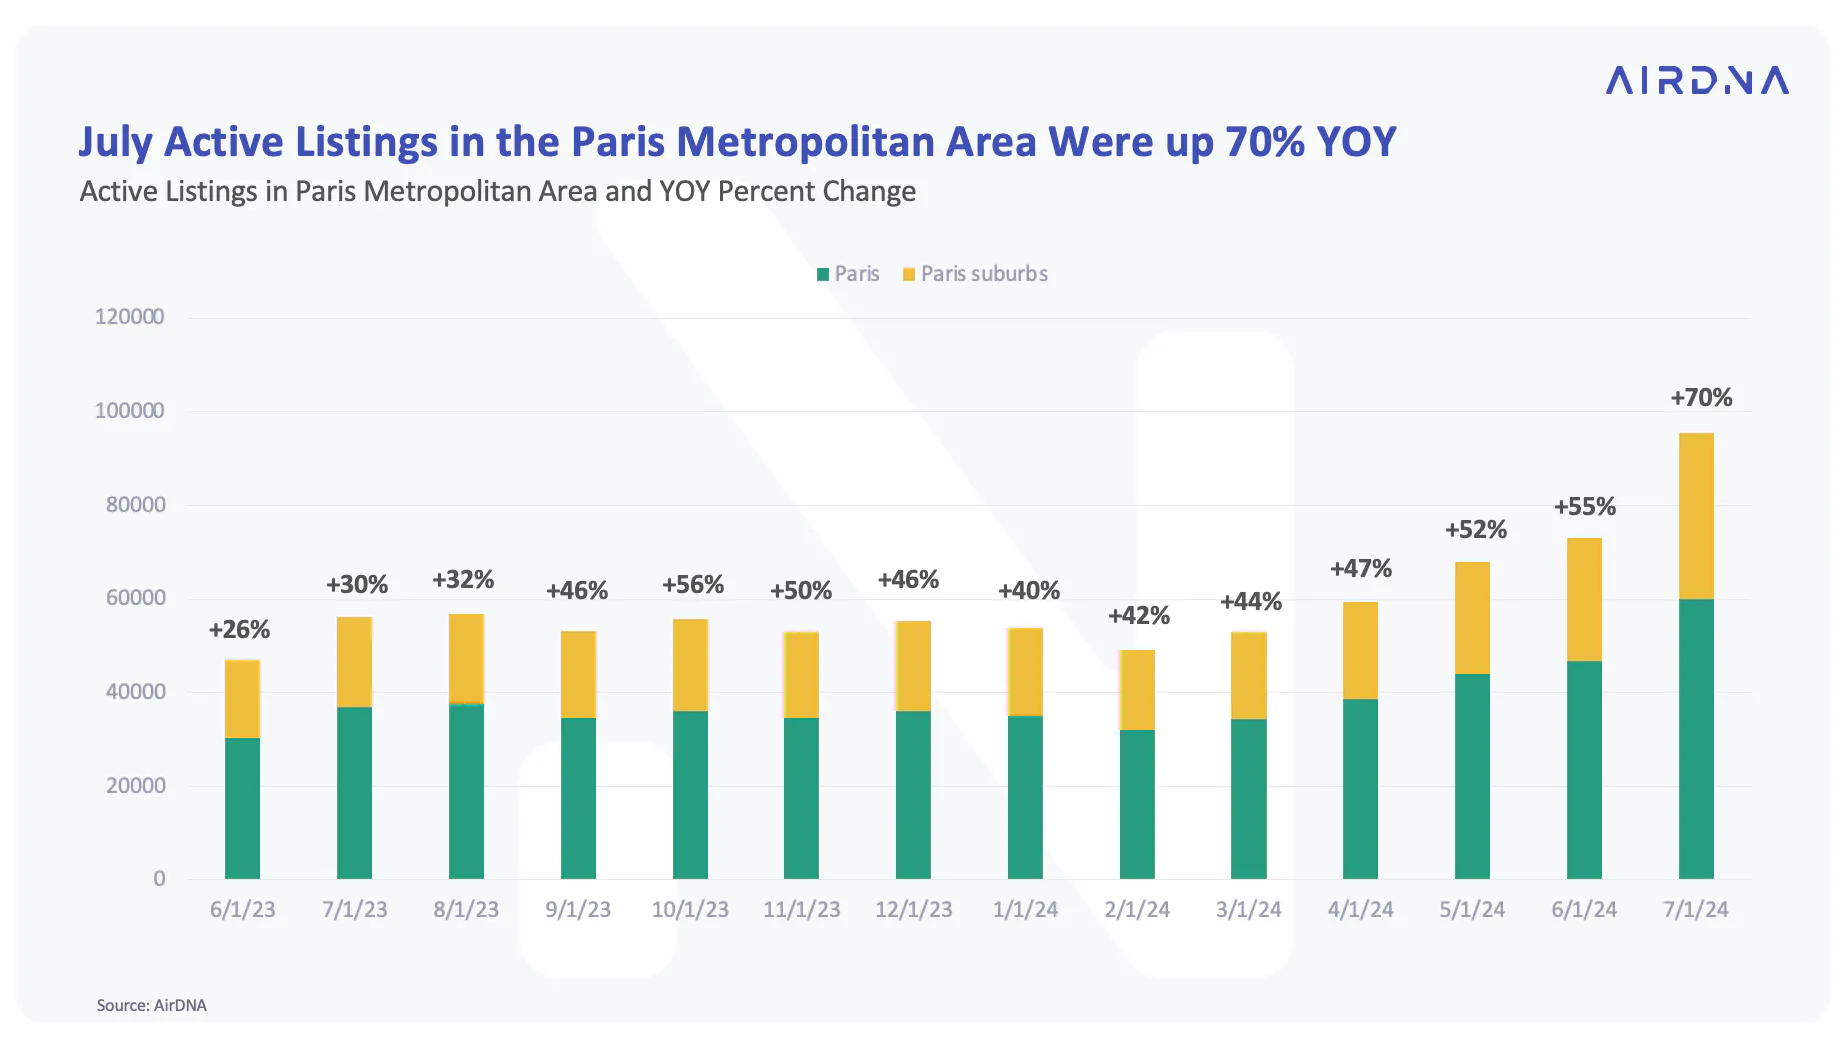
Supply: 95K STR listings were available in the Paris metro area for the Paris Olympics. Nearly 60K were within the city limits of Paris, while an additional 36K were available in the suburbs of Seine-Saint-Denis, Hauts-de-Seine, and Val-de-Marne. Listing growth saw the most momentum in May, June, and July. In total, listings in the Paris metro area provided 1.2M listing nights for the Paris Olympics, a 76% YOY increase.
It’s important to note that while available listings increased 76% YOY in July, the total number of active listings in Paris only increased 40% YOY. Due to STR regulations, Paris short-term rentals have a 120-day cap on the number of days they can operate, so not all active listings can be available all year long. The larger YOY change in available listings is the result of more hosts making their listings available this July than last July.
Occupancy: Despite immense supply growth, high demand for stays enabled YOY occupancy growth in the Paris metro area. The average occupancy rate for Paris during the Olympics was 62%, up from 60% in 2023. In the immediate suburbs surrounding Paris, average occupancy was 59%, up from 51% in 2023.
ADR: By encouraging Paris residents to list their properties, Airbnb succeeded in keeping rates affordable for those looking to stay in Paris for the Olympics. The average rate paid for Olympic stays in Paris was 290 €, while the average rate paid for Olympic stays in the suburbs of Seine-Saint-Denis, Hauts-de-Seine, and Val-de-Marne was 171 €.
Shrinking Lead Times in Europe
In its most recent earnings call, Airbnb highlighted shrinking lead times as a trend they are seeing in recent booking behavior. When we take a look at lead time trends in Europe since 2019, we can see that there has been a pretty significant decline in booking lead times in the last five years.
In 2019, prior to the pandemic, the median lead time for bookings in Europe was about 38 days. During COVID, lead times shrunk dramatically due to travel uncertainty. While lead times have bounced back from pandemic lows, the new normal for lead times remains starkly lower than it was in 2019. The median booking lead time in Europe over the last 12 months was 24 days, down 3 days from the previous year. Shrinking booking lead times is also a trend we’re seeing in the US.
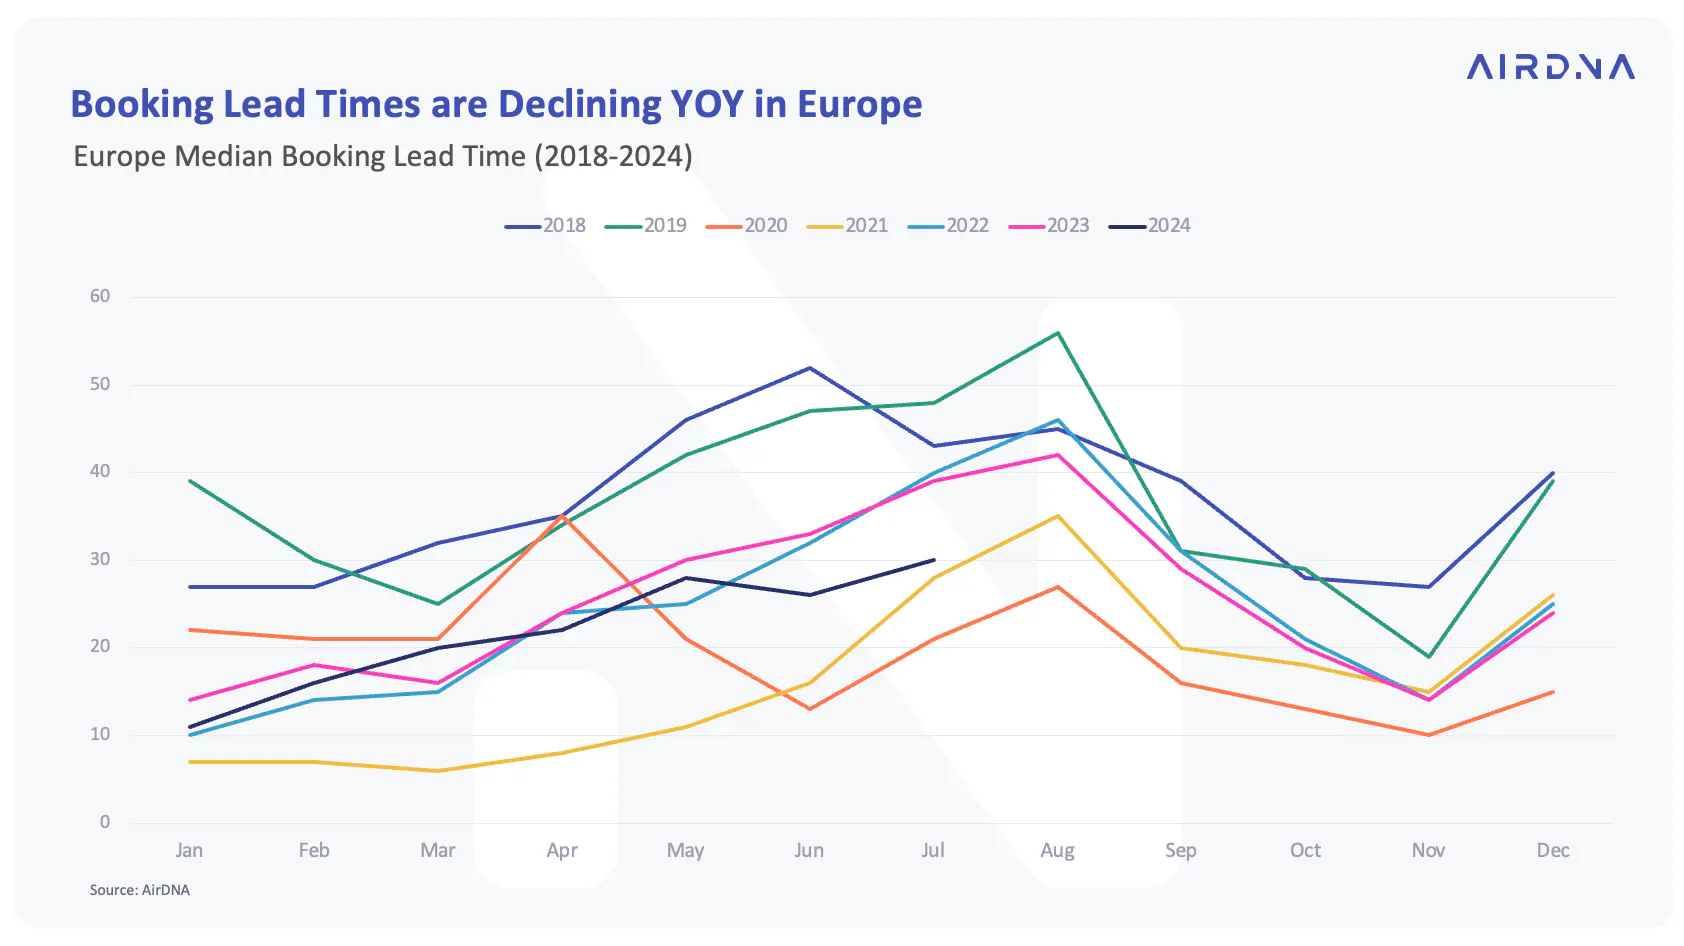
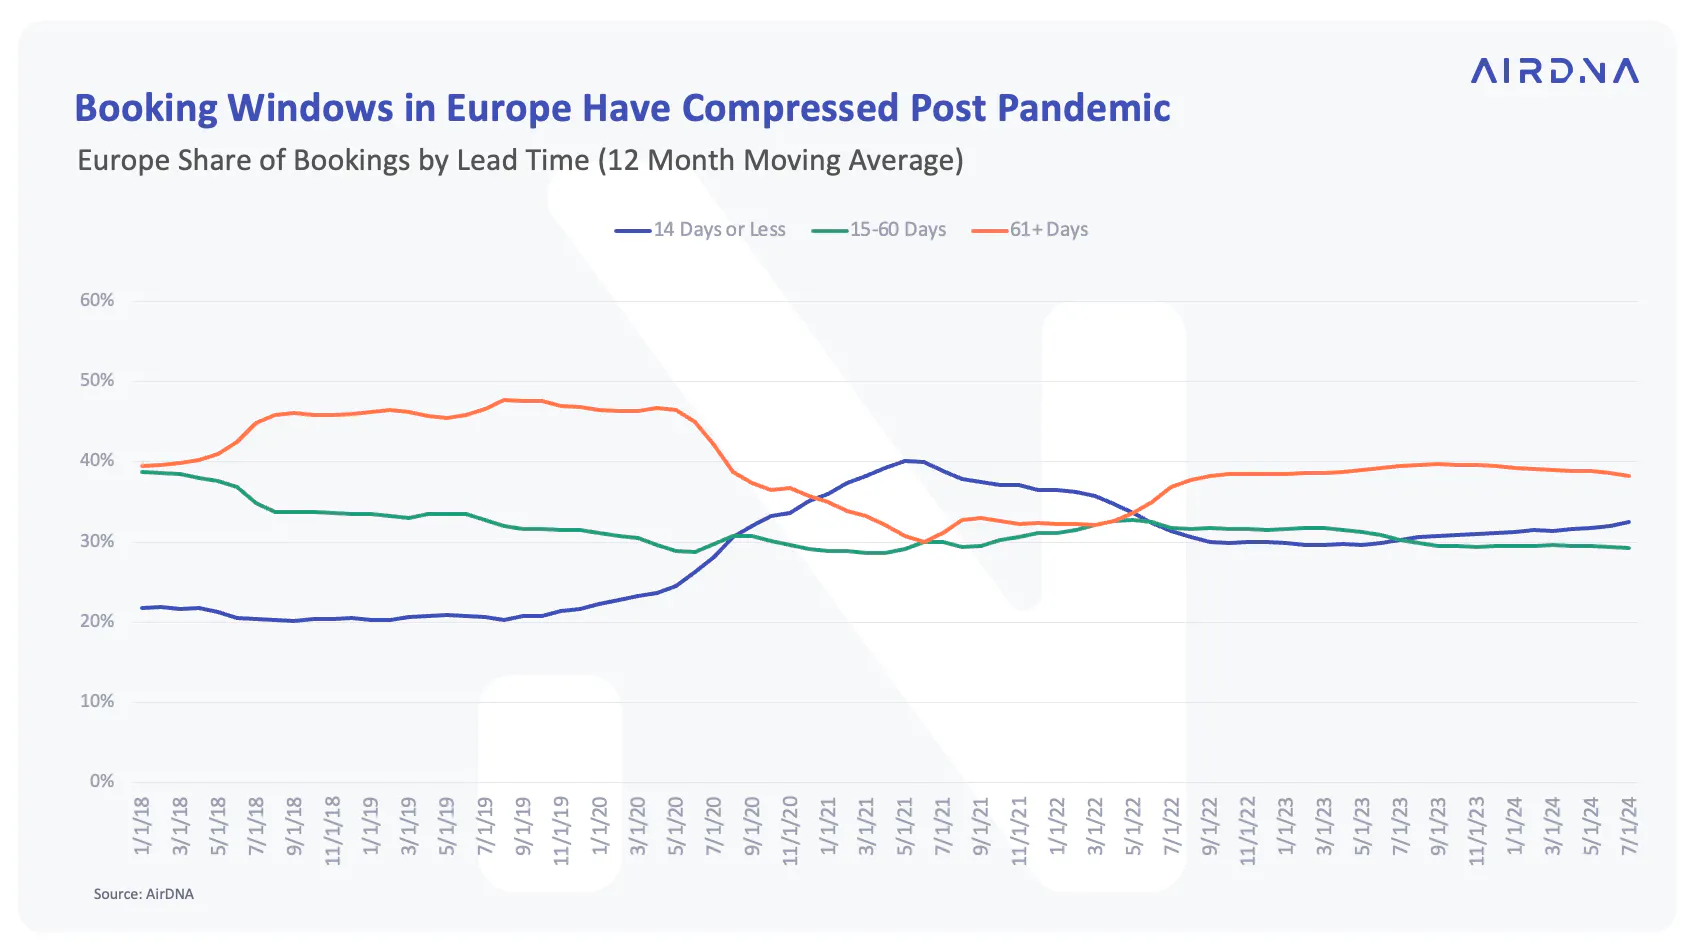
The compression we’re seeing in booking lead times comes from fewer guests booking stays far in advance as well as more guests booking stays at the last minute.
Over the past five years, we have observed a significant decrease in the percentage of stays booked more than 60 days in advance, as well as a notable increase in the percentage of stays booked less than 14 days beforehand. Trailing twelve-month (TTM) booking performance for July 2019 shows that 46% of stays were booked more than 60 days out and only 20% of stays were booked within 2 weeks of stay. However, when you look at trailing twelve-month booking performance for July 2024, the percentage of stays booked more than 60 days has fallen to 38% and stays booked within 2 weeks of arrival has increased to 32%.
Lead times can also vary by location. European cities tend to see longer lead times because they receive mostly foreign travelers who book their stays further in advance.
The median lead time for the 50 largest European cities over the last year has been 27 days. The median lead time for destinations outside of the 50 largest European cities has been 23 days over the last year.
However, for the top 50 largest European cities and those outside of them, the median lead time for bookings was 38 days in 2019, and we’ve seen that shrink dramatically as guests are waiting longer to book.
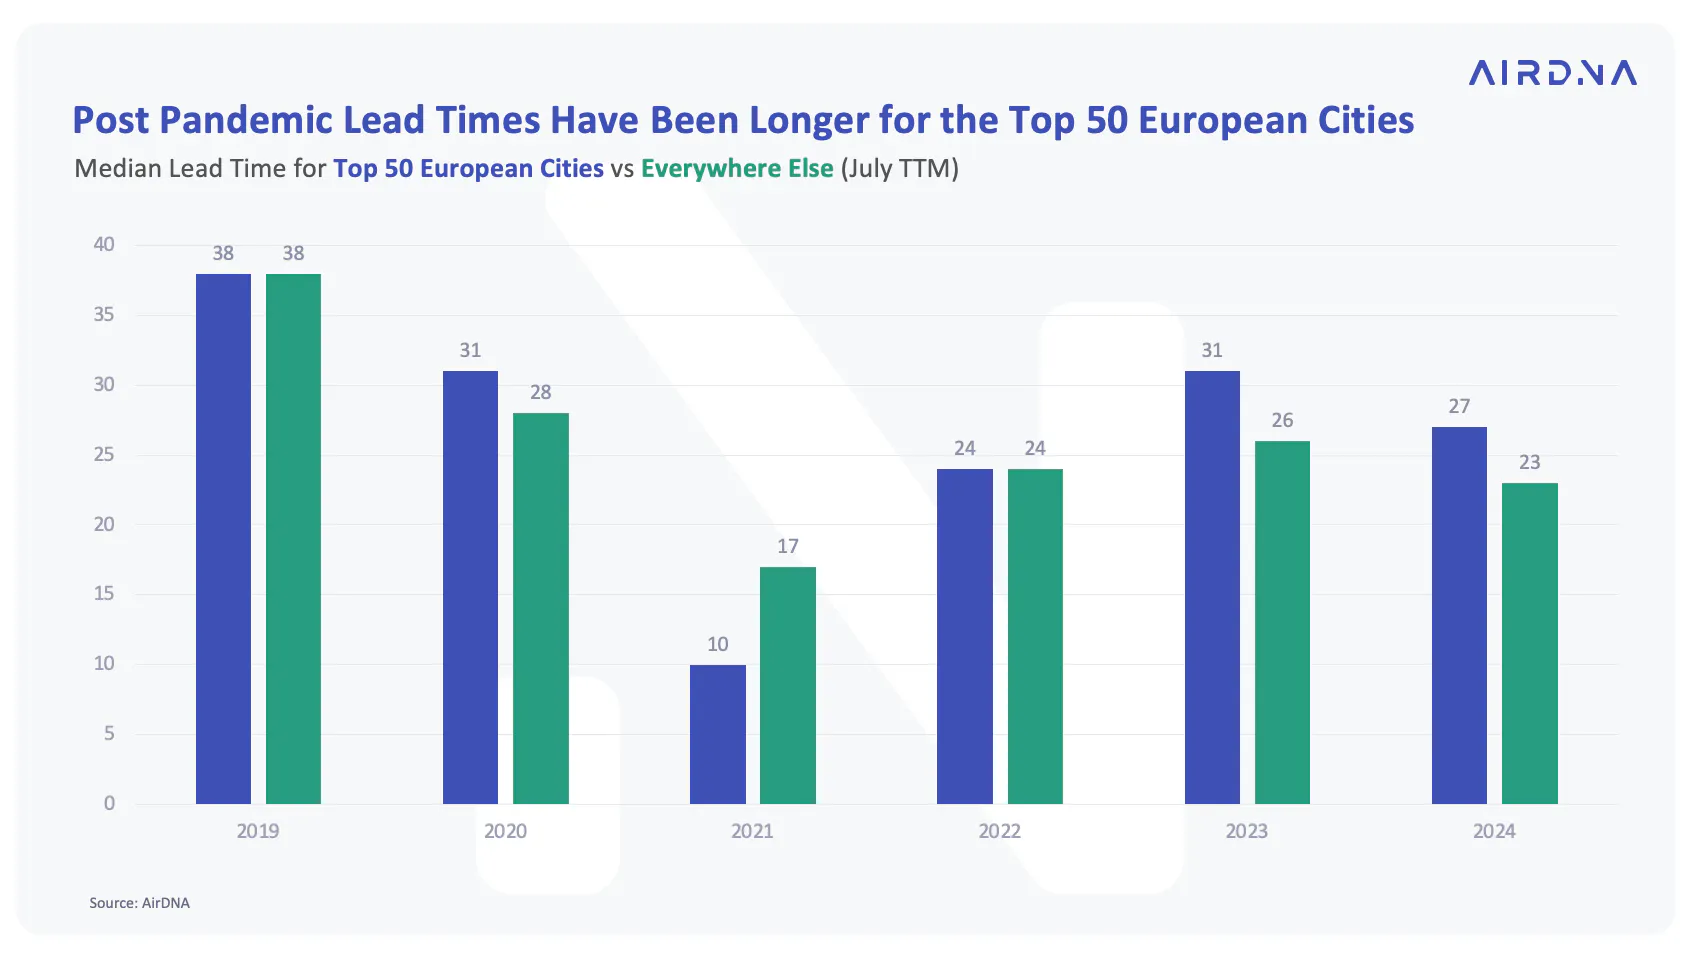
With current booking trends pointing to shorter lead times, hosts looking ahead at their fall and winter bookings might expect their calendars to take longer to fill up and more bookings to come in closer to the date of stay. This also means winter holiday bookings could come in slower than previous years.
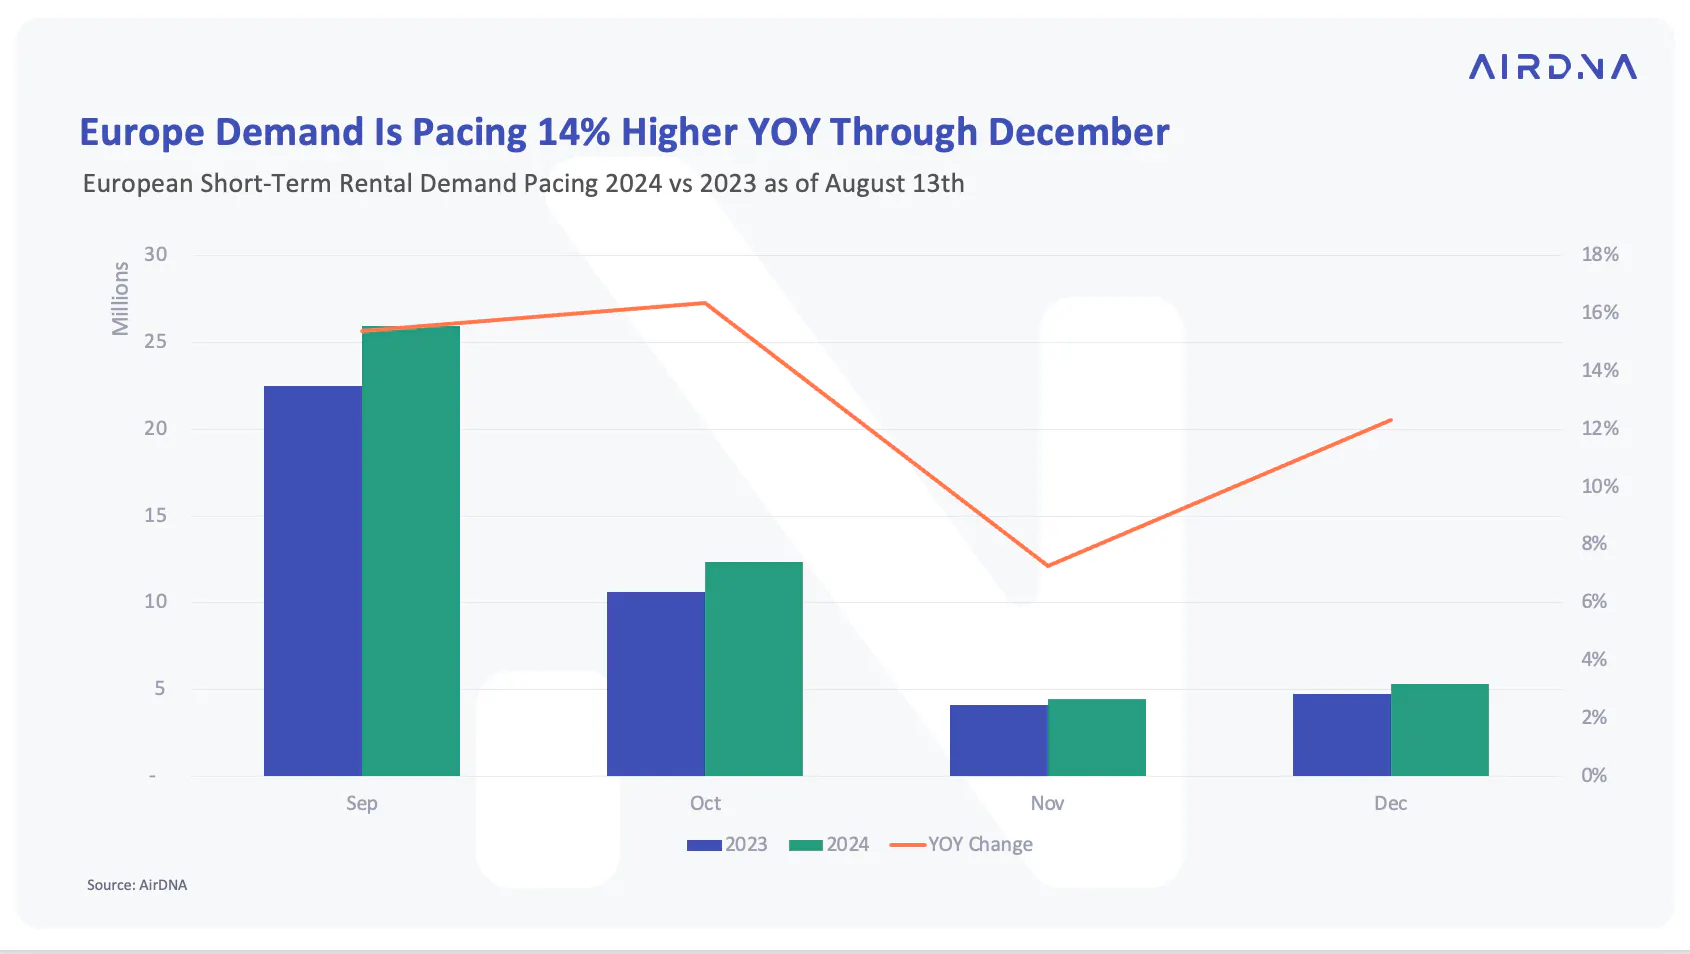
It’s important to note that shorter lead times don’t necessarily mean that overall bookings will be down. The current demand pacing for Europe is showing strong YOY booking growth from September through the end of the year. Europe's demand is up 14% YOY through December. The shoulder months of September and October are seeing 15% YOY demand growth, while November and December bookings also point to the likelihood that European STR demand will end on a high note this year.
ARTICLE SUMMARY
The European short-term rental market saw robust performance in July 2024, with demand reaching 57.6 million nights, up 17.7% year-over-year, despite experiencing its first Average Daily Rate (ADR) decline in 20 months. This report explores the current state of the European STR market, including economic factors influencing travel trends and the impact of the Paris Olympics.
Linda Rollins
Senior Research Analyst
Linda Rollins is a Senior Research Analyst at AirDNA and a self-managing short-term rental host, which means she understands the market as both an analyst and an operator. She writes research and blogs for AirDNA and for Adapt, its revenue management tool, making her work a go-to resource for investors trying to find and size up the right opportunities, and for operators looking to understand changing market dynamics and find concrete ways to improve occupancy, rates, and guest experience. Her data is regularly cited in major news outlets, and she has a knack for bringing both the numbers and the story behind them. In her free time, Linda enjoys spending time with her family, traveling, and looking for good eats.
