

 Calculate Revenue
 Research Markets
 Find For Sale Properties
 Compare My Listing
 STR Revenue Calculator
 Custom Comp Sets
 Submarket Insights
 Custom Search Filters
 Rate Recommendations
 Performance Benchmarking
 Competitor Comparison
 Owner Contact Details
 Property-level performance data
 Tourism Insights
 Real Estate Investment Analytics
 About Us
 Sales
Sales Support
 Press
PressWorld Cup Group Stage Recap: Strong Demand, Higher Rates, but More Listings Kept Occupancy in Check
Published: July 2, 2026

Linda Rollins
Key Takeaways
- Mexico’s host cities saw the strongest demand growth during the group stage, with visitors extending stays well beyond match days.
- Occupancy declined across most host markets as rapid supply growth outpaced the demand generated by the tournament.
- Hosts still benefited from substantial rate gains, especially in supply-constrained markets where booked rates climbed more than 60% year over year.
The 2026 FIFA World Cup has already delivered a major boost to short-term rental demand across North America. As the largest tournament in FIFA history, spanning 39 days and 16 host cities across the United States, Canada, and Mexico, the competition has brought millions of fans to the region and created significant opportunities for hosts.
While hotels have welcomed much of that demand, short-term rentals have played an important role in accommodating travelers, particularly in markets with more limited hotel supply. Demand increased across most host cities during the group stage, though the tournament’s impact varied considerably from one market to another.
AirDNA has been tracking short-term rental performance across Airbnb and Vrbo throughout the tournament. Now that the group stage has concluded, the data provides the first complete picture of how the tournament has impacted short-term rental markets and which host cities have benefited the most.
Mexico's Host Cities Led the Pack
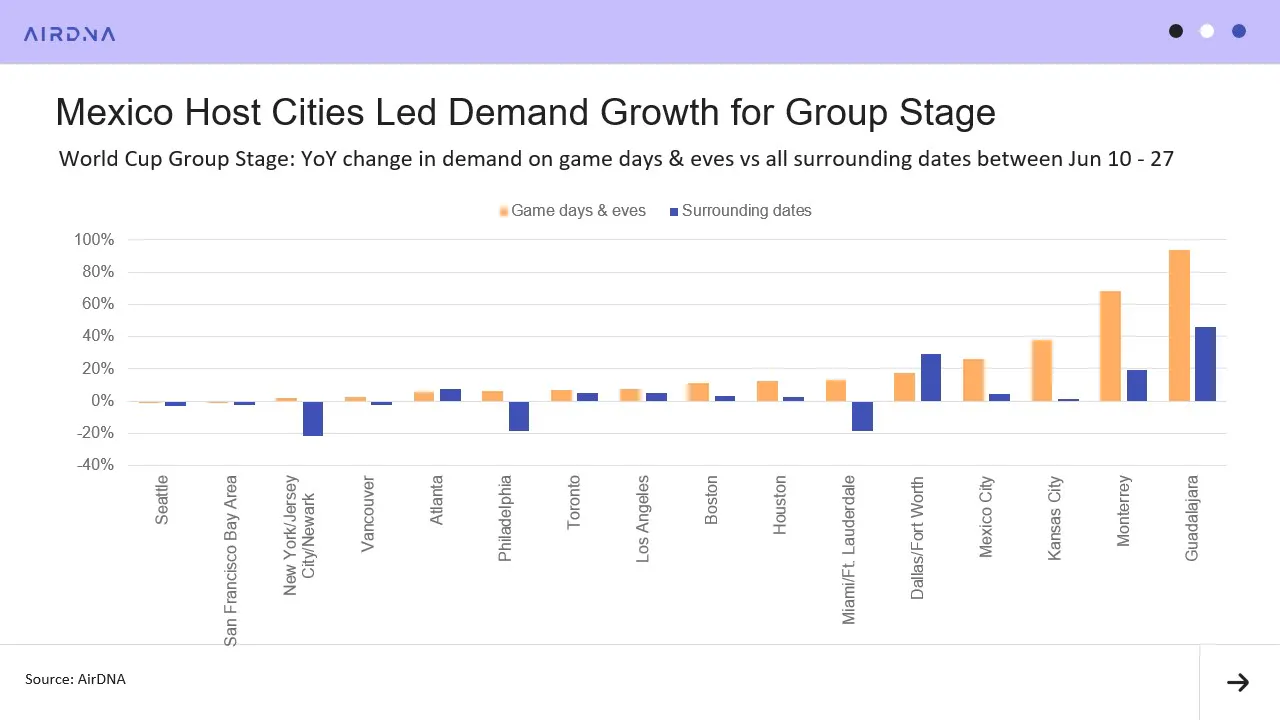
Overall, Mexico's host cities were the top demand performers of the group stage. On match days and eves, demand in Guadalajara was up 94% year-over-year (YoY). Monterrey demand was up 68% YoY, and in Mexico City, nights booked climbed 26% YoY.
And it wasn't only game days and eves that saw elevated demand. Outside of match days and eves, total demand nights were still up 46% YoY in Guadalajara and 20% YoY in Monterrey. Guests traveling to these cities extended their stays, driving strong gains across the entire group stage period.
That pattern didn't hold everywhere. In the U.S., Kansas City and Miami posted some of the largest demand gains on game days and eves, but those gains didn't carry over to surrounding dates. In Kansas City, demand on game days and eves rose 38% YoY, yet demand outside of those windows was up just 1% YoY. Miami saw a similar split: demand on game days and eves was up 13% YoY, while surrounding dates were down 18% YoY. The World Cup may have shifted normal travel demand away from surrounding dates and concentrated it on game days and eves.
Dallas and Atlanta were the only host cities where demand gains were stronger outside of game days and eves. Dallas saw an 18% YoY increase on match days and eves and a 29% YoY increase on surrounding dates. Atlanta demand was up 6% YoY on game days and eves, with demand on surrounding dates rising 8% YoY.
Not every host city came out ahead. Seattle and San Francisco both fell short, with demand on game days and eves down 1% YoY and surrounding dates down 2% to 3% YoY. The New York, Newark, and Jersey City markets (the latter two in New Jersey) were similarly lackluster, with combined demand up just 2% YoY on game days and eves and down 21% YoY on surrounding dates.
However, Jersey City and Newark did outperform New York. Demand in Jersey City and Newark was up 16% YoY on game days and eves and down 16% YoY outside of them. Demand in New York, by contrast, was down 5% YoY on game days and eves and down 25% YoY on surrounding dates, a sign that the World Cup may have actually deterred travelers who would normally have visited the city in June.
Why Demand Growth Didn't Move Occupancy
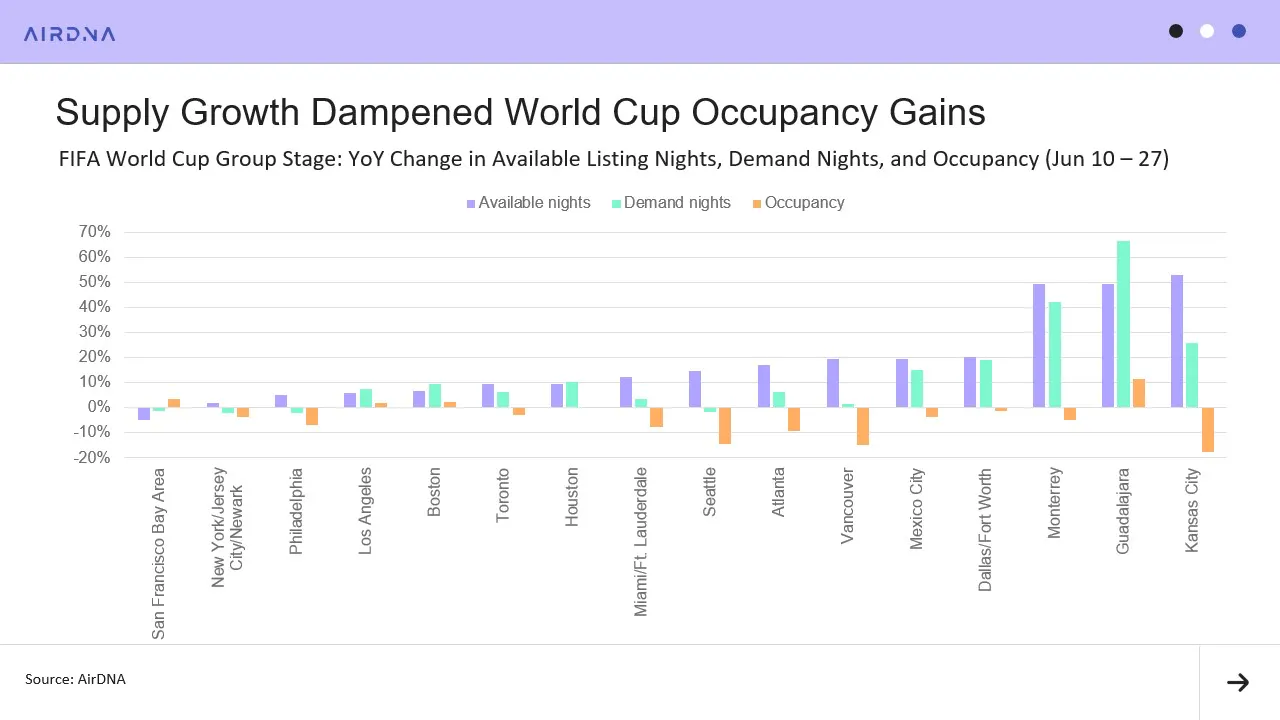
Across the full group stage period, the World Cup did little to lift occupancy. Robust supply growth across many host cities over the past year meant that 12 of the 16 markets saw occupancy decline YoY, as new listings outpaced the demand the tournament brought in.
The trend was most pronounced in Kansas City. Demand nights there were up 26% YoY during the group stage, but a 53% YoY surge in available supply nights pushed occupancy down 18% YoY. Seattle and Vancouver, Canada, told a similar story, with supply growth colliding with muted demand to produce YoY occupancy declines of roughly 15% in both markets.
Where Hosts Won on Price
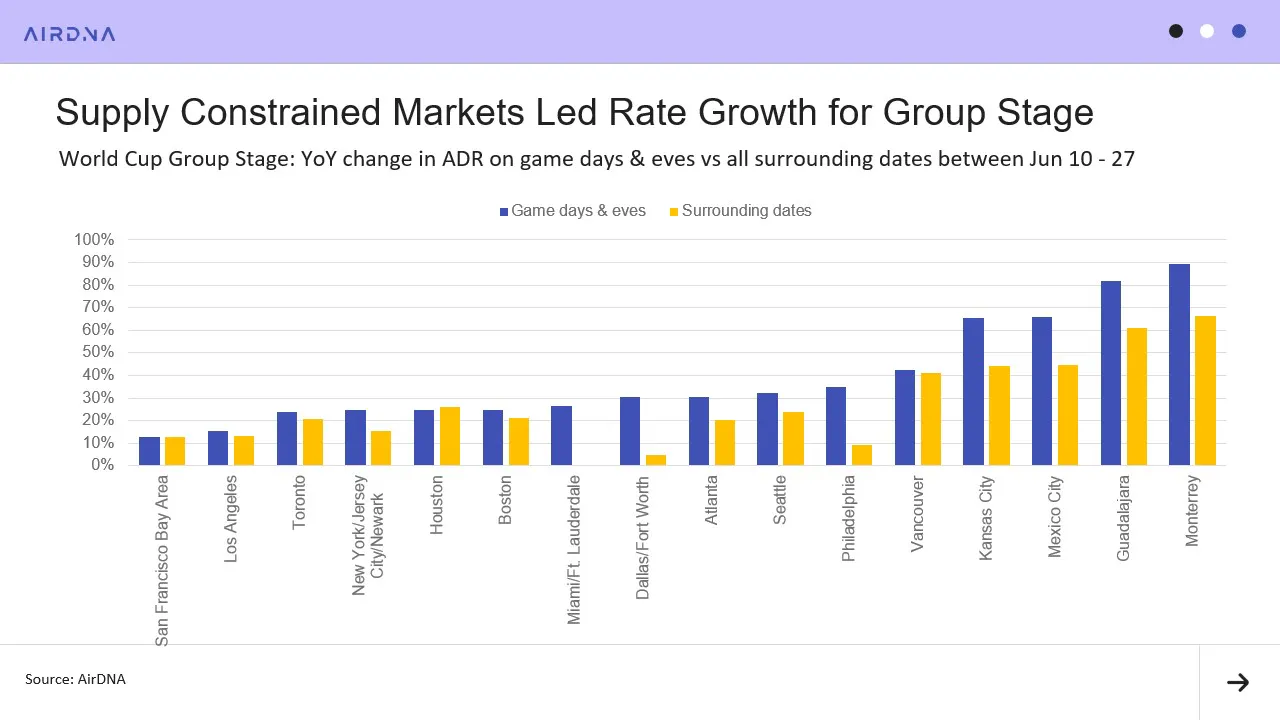
While most markets saw little occupancy upside, many still posted meaningful rate gains, both on match days and eves and on surrounding dates. Across host cities, 14 of the 16 saw booked rates rise more than 20% on game days and eves, and 10 of the 16 saw booked rates climb more than 20% on surrounding dates during the group stage.
Supply-constrained markets saw the biggest gains. Booked rates in Guadalajara, Monterrey, Mexico City, and Kansas City were all up more than 60% YoY on game days and eves, and rates on surrounding dates were up more than 40% YoY in all four markets.
San Francisco and Los Angeles saw the weakest rate growth, with premiums coming in under 15% for the group stage. A few markets—Miami, Dallas, and Philadelphia—posted strong gains on match days and eves but saw rate growth fall short on surrounding dates.
Star Matchups Drove the Biggest Gains
Ultimately, the occupancy and rate gains each market experienced varied from match to match. In some markets, gains for marquee matchups were double those of less popular ones. Miami is a clear example: occupancy and rate gains for the Brazil vs. Scotland and Colombia vs. Portugal games far outpaced those for Cape Verde vs. Uruguay or Uruguay vs. Saudi Arabia. Houston followed the same pattern, with both Portugal matches driving occupancy and rate gains well above those of the three other group-stage games the city hosted. Even in Los Angeles, where gains were modest relative to other host markets, the U.S. team's matches took a clear lead over the rest.
Where Demand Is Building for the Round of 32
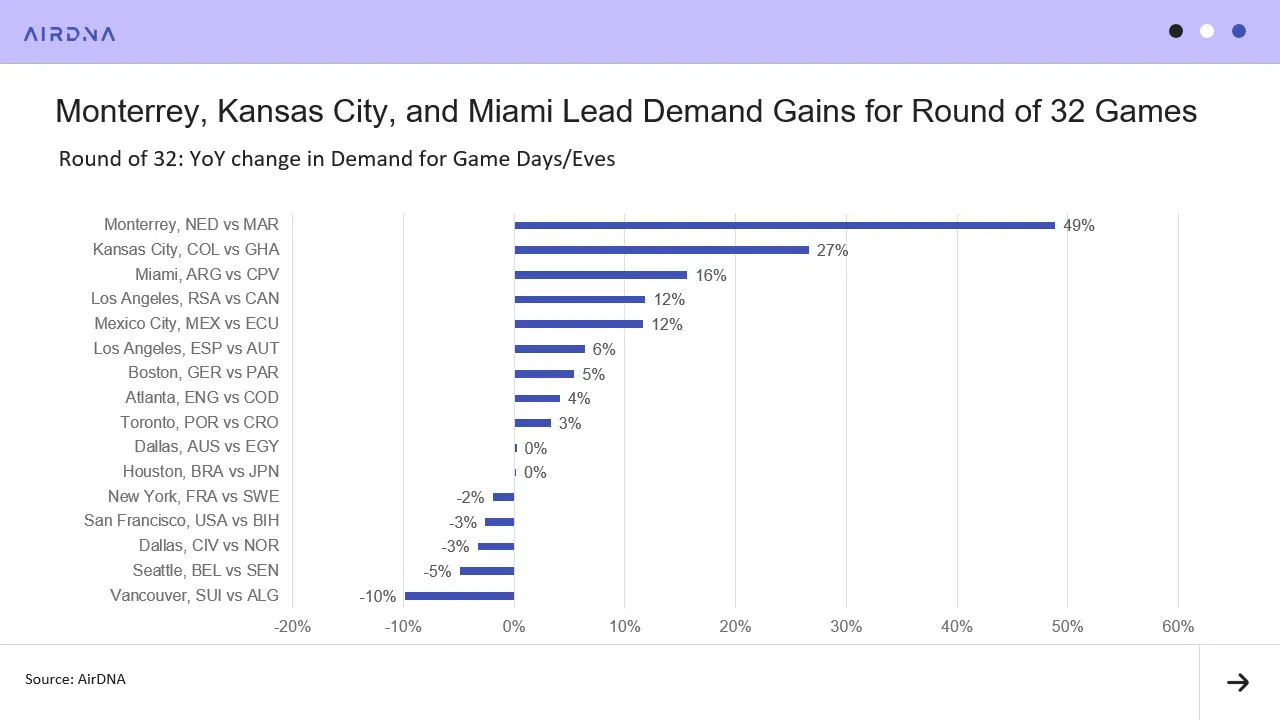
As we turn to the round of 32, Monterrey, Kansas City, and Miami are hosting the matches driving the strongest demand gains. The Netherlands vs. Morocco match in Monterrey saw a 49% YoY increase in demand. In Kansas City, demand for Colombia vs. Ghana is up 27% YoY, while demand for Miami's Argentina vs. Cape Verde match is up 16% YoY. On the other end, the Switzerland vs. Algeria match in Vancouver is currently the weakest, with demand down 10% YoY.
How Far Ahead Are Guests Booking?
Across host cities, about a quarter of bookings for June 10th through the 27th were booked within two weeks of stay. 16% were within a week of stay (0 to 6 days) and another 11% were booked 7-13 days out from stay date. Booking patterns closely tracked last year's, with one notable difference: a larger share of bookings this year were made more than three months out.
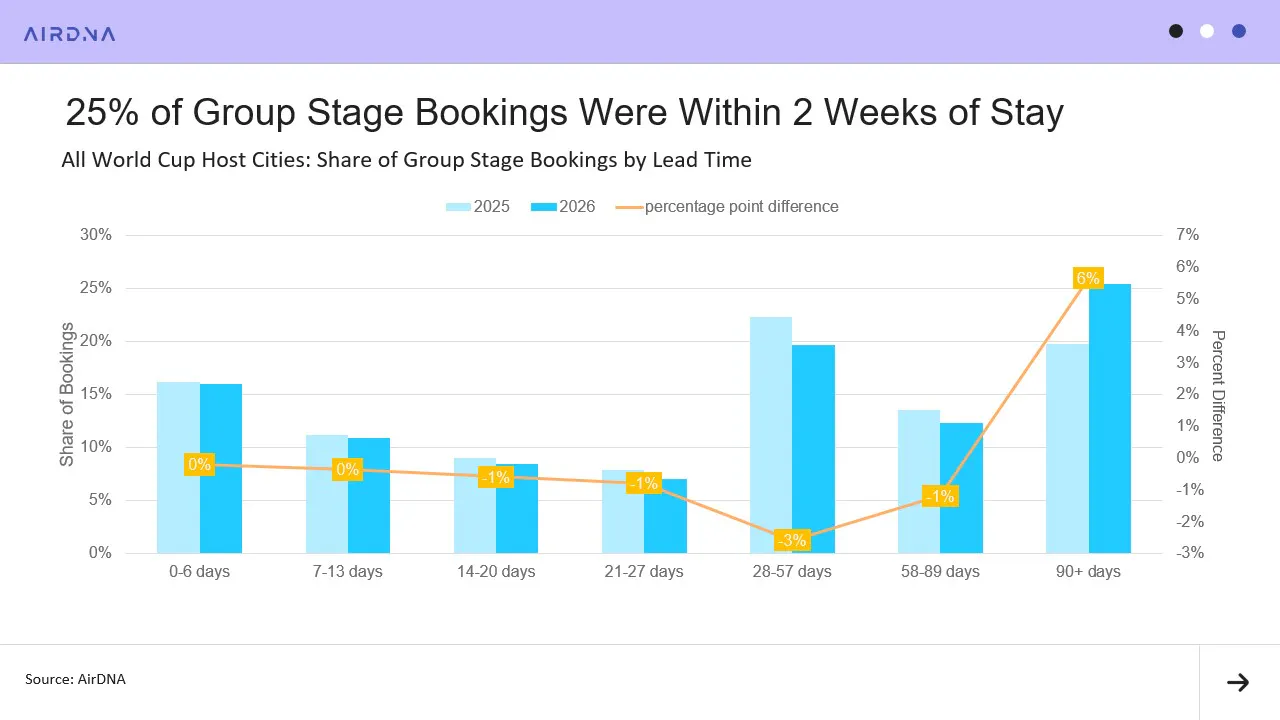
Booking behavior around the knockout rounds will likely follow a similar pattern, though with an even larger share of last-minute bookings as guests wait for matchups to be confirmed before committing.
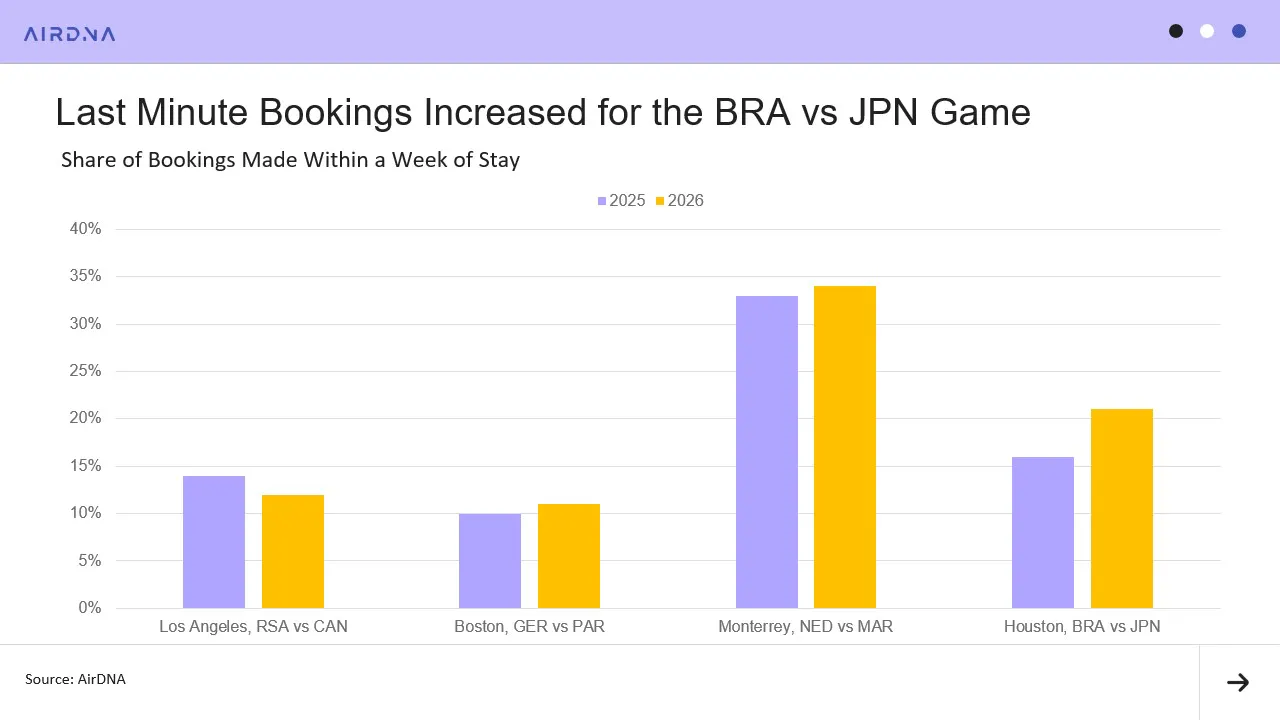
For the first four round of 32 matches, the share of nights booked within a week of the match varied by market but generally did not increase YoY. The exception was Houston, where 21% of bookings for the Brazil vs. Japan game were made within a week of stay, up from 16% for the same dates the year prior.
Premiums Are Climbing for the Knockouts
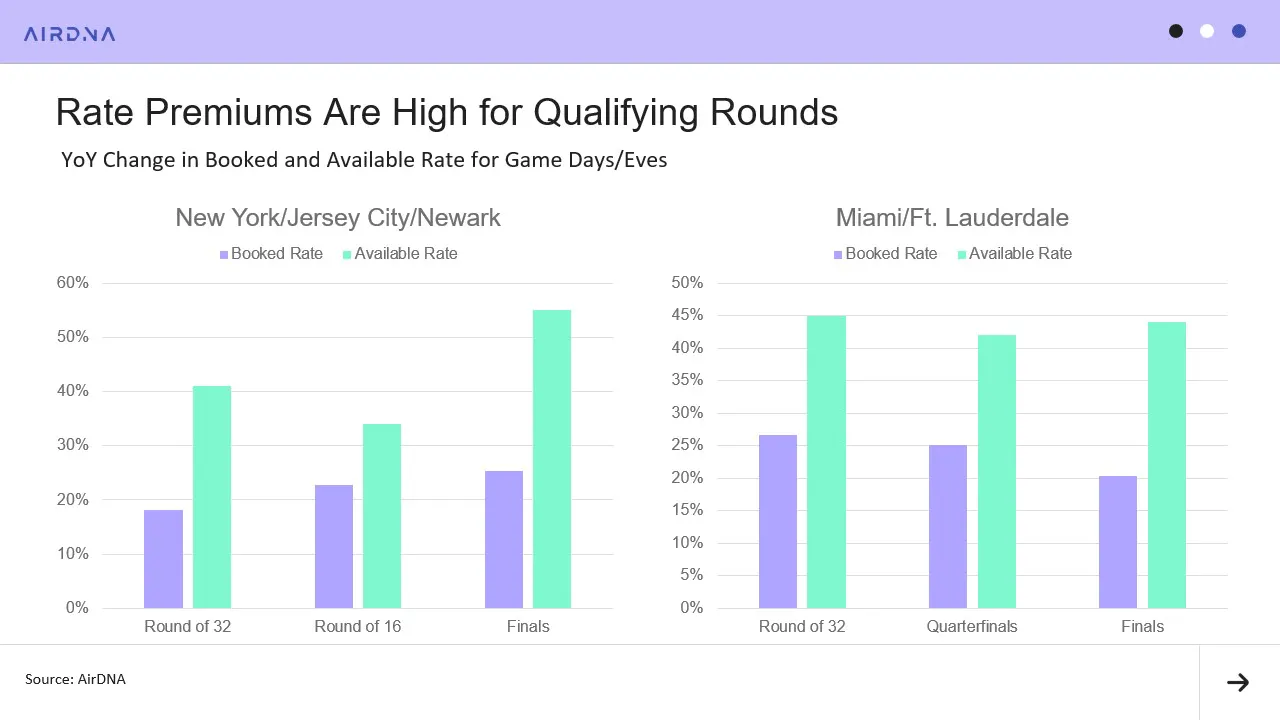
Guests booking knockout round stays are facing steep premiums. Available rates in markets like Miami and New York are already up more than 40% YoY for the qualifying rounds. Booked rates so far are up about 20% YoY and will likely rise further as more guests book at higher prevailing rates.
With the group stage complete, the tournament has largely confirmed the trends AirDNA identified in the months leading up to kickoff. Demand has remained strongest in supply-constrained markets, while rapid listing growth has limited occupancy gains across much of North America. As the knockout rounds begin, attention will shift toward a smaller number of marquee matches where booking activity, pricing, and last-minute demand are expected to intensify.
ARTICLE SUMMARY
AirDNA’s group stage analysis shows how the 2026 FIFA World Cup boosted short-term rental demand across North America, while rapid supply growth kept occupancy gains in check and pushed performance further apart across host cities.
Linda Rollins
Senior Research Analyst
Linda Rollins is a Senior Research Analyst at AirDNA and a self-managing short-term rental host, which means she understands the market as both an analyst and an operator. She writes research and blogs for AirDNA and for Adapt, its revenue management tool, making her work a go-to resource for investors trying to find and size up the right opportunities, and for operators looking to understand changing market dynamics and find concrete ways to improve occupancy, rates, and guest experience. Her data is regularly cited in major news outlets, and she has a knack for bringing both the numbers and the story behind them. In her free time, Linda enjoys spending time with her family, traveling, and looking for good eats.
