

 Calculate Revenue
 Research Markets
 Find For Sale Properties
 Compare My Listing
 STR Revenue Calculator
 Custom Comp Sets
 Submarket Insights
 Custom Search Filters
 Rate Recommendations
 Performance Benchmarking
 Competitor Comparison
 Owner Contact Details
 Property-level performance data
 Tourism Insights
 Real Estate Investment Analytics
 About Us
 Sales
Sales Support
 Press
PressHow to Perform a Submarket Analysis for Your Short-term Rental Investment
Published: September 9, 2024
Last updated: May 5, 2026

Dillon DuBois
Picture two Airbnb listings in the same city: similar size, similar amenities, but wildly different performance. One is consistently booked at premium rates, while the other struggles to maintain occupancy. The key difference? Often, it's not the property itself but its specific location within the market that changes everything. This is known as the short-term rental (STR) submarket.
Imagine you’re looking at Austin, Texas. You might see the city's overall 50% occupancy rate and write it off as a mediocre investment. What you may not realize is that the Hyde Park submarket has a 60% occupancy rate. Meanwhile, Northwest Hills submarket has a 34% occupancy rate.
These aren't just numbers—they represent real dollars in your pocket. That 26% occupancy gap could mean thousands of extra dollars in revenue each year. By diving into STR submarket data, you're not just making educated guesses—you're equipping yourself with insights to make pinpoint-accurate and highly lucrative STR investments.
What is an STR Submarket?
Think of a market as a pie and submarkets as the slices. At AirDNA, we define these slices as distinct areas within a larger market.
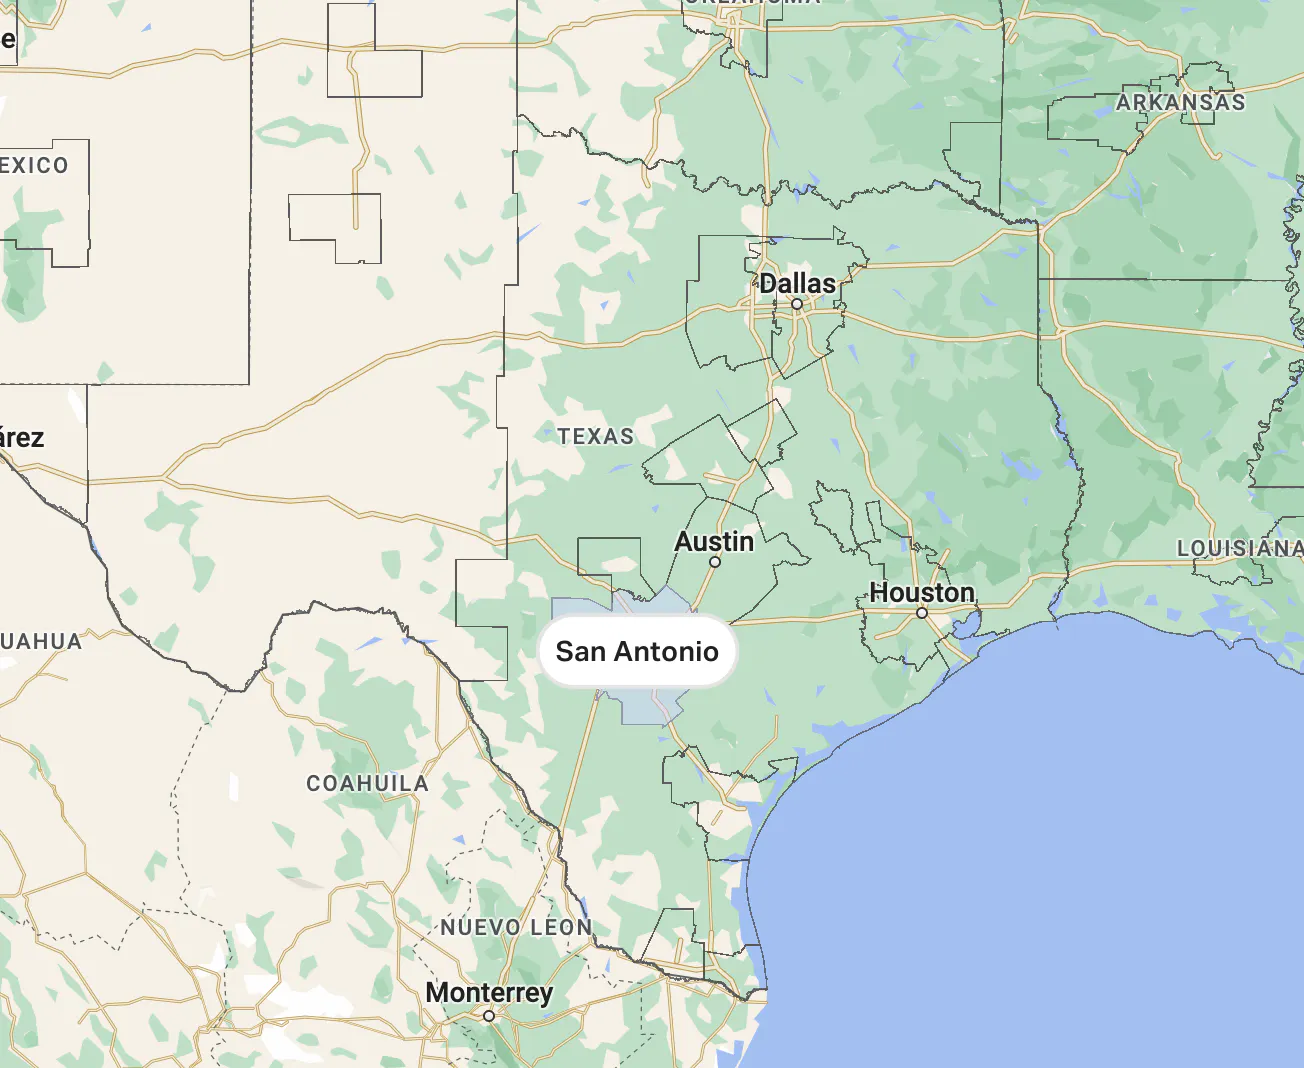
San Antonio Market
Each slice represents a specific neighborhood or region, often displaying markedly different performance metrics that can significantly impact your return on investment in the short-term rental industry.
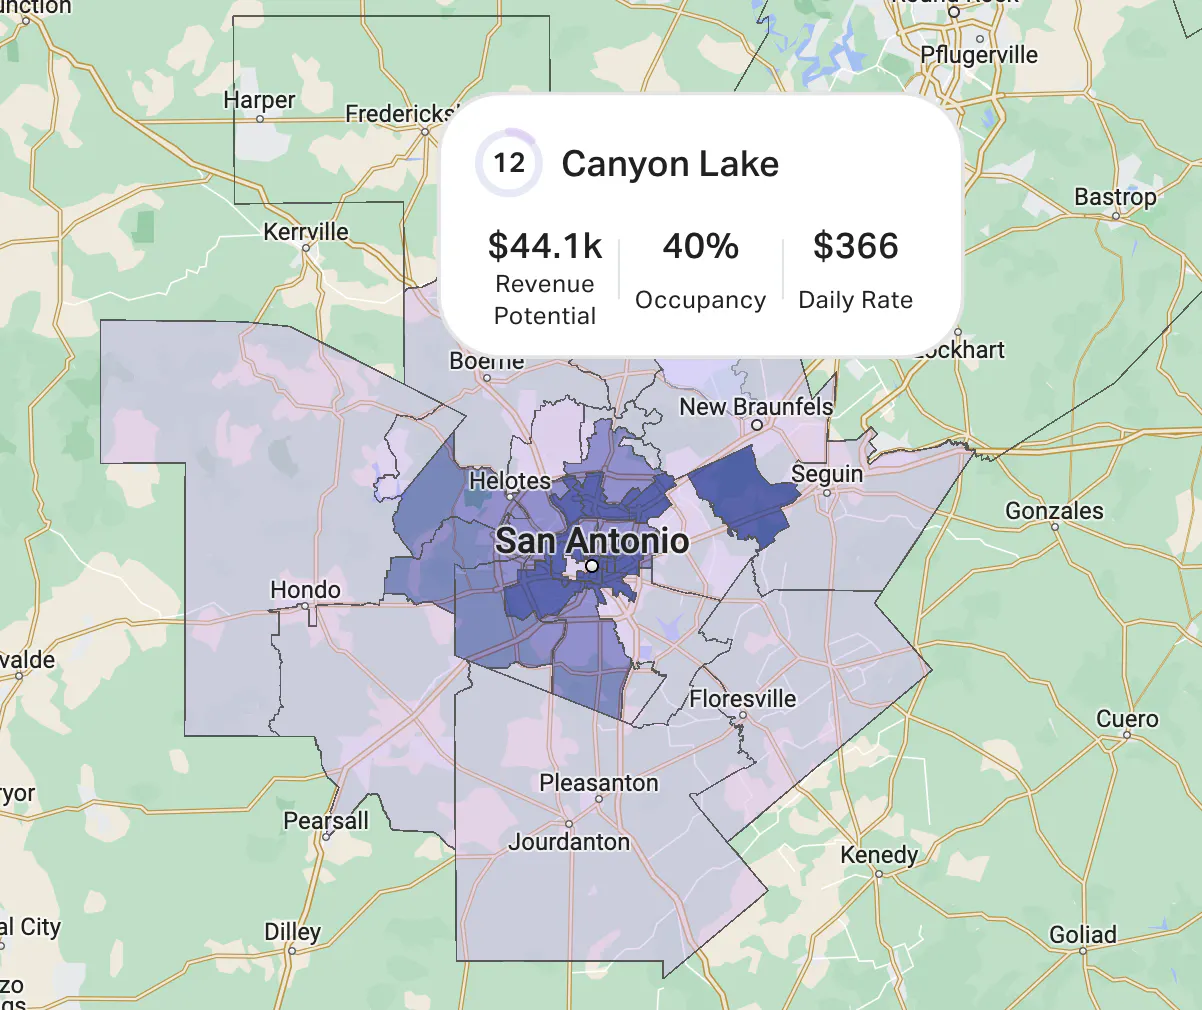
Canyon Lake Submarket - in the San Antonio Market
Our STR submarket data lets you thoroughly examine each slice, revealing which areas have the best short-term rental market scores. This granular approach enables you to conduct in-depth STR market research, analyzing historical and future-looking data for individual neighborhoods, giving you the full flavor profile of a market's potential.
How is a submarket different from a market?
While a market gives you the big picture, submarkets offer a close-up view. A market typically encompasses an entire city or metropolitan area. It provides a broad overview of the short-term rental landscape, including overall occupancy rates, average daily rates, and general trends.
A STR submarket, on the other hand, zooms in on specific neighborhoods or cities within that larger market area. This distinction is crucial because STR performance can vary dramatically from one neighborhood to the next. Factors like proximity to attractions, local regulations, or even the vibe of an area can influence how well a property performs.
We've organized all STR listings in the U.S. into 317 distinct markets, each containing its own submarkets. Now every U.S. STR listing is part of both a market and submarket. This allows our hosts/VRMs/Investors to go macro and track the overall trends in your market or the micro trends in your neighborhood.
Why You Need an Airbnb Submarket Analysis
Here’s how a STR submarket analysis helps you find the best investment:
- Pinpoint Profitability: Not all areas within a city perform equally. Submarket analysis helps you identify the most lucrative neighborhoods for short-term rental investments.
- Understand Guest Preferences: Different submarkets attract different types of guests. This knowledge helps you tailor your property and marketing to your target audience.
- Optimize Pricing Strategy: Rates can vary significantly between Airbnb submarkets. Analysis helps you price competitively while maximizing revenue in that specific Airbnb submarket.
- Forecast Seasonal Trends: STR submarkets often have unique seasonal patterns. Understanding these helps you plan for occupancy fluctuations.
- Navigate Regulations: Short-term rental regulations can vary by neighborhood. STR submarket analysis helps you identify areas with favorable Airbnb policies.

How to use AirDNA to compare STR submarkets
Once you've selected a broader market, AirDNA can help you drill down to find the most promising submarket for your investment. Here's how to use our platform to compare submarkets effectively:
1. Access the Market Overview: Start by navigating to your chosen market. For this example, we'll use the Coachella Valley, CA.
2. Identify Submarkets: In the Coachella Valley, you'll see we've subdivided the area into 12 different submarkets.
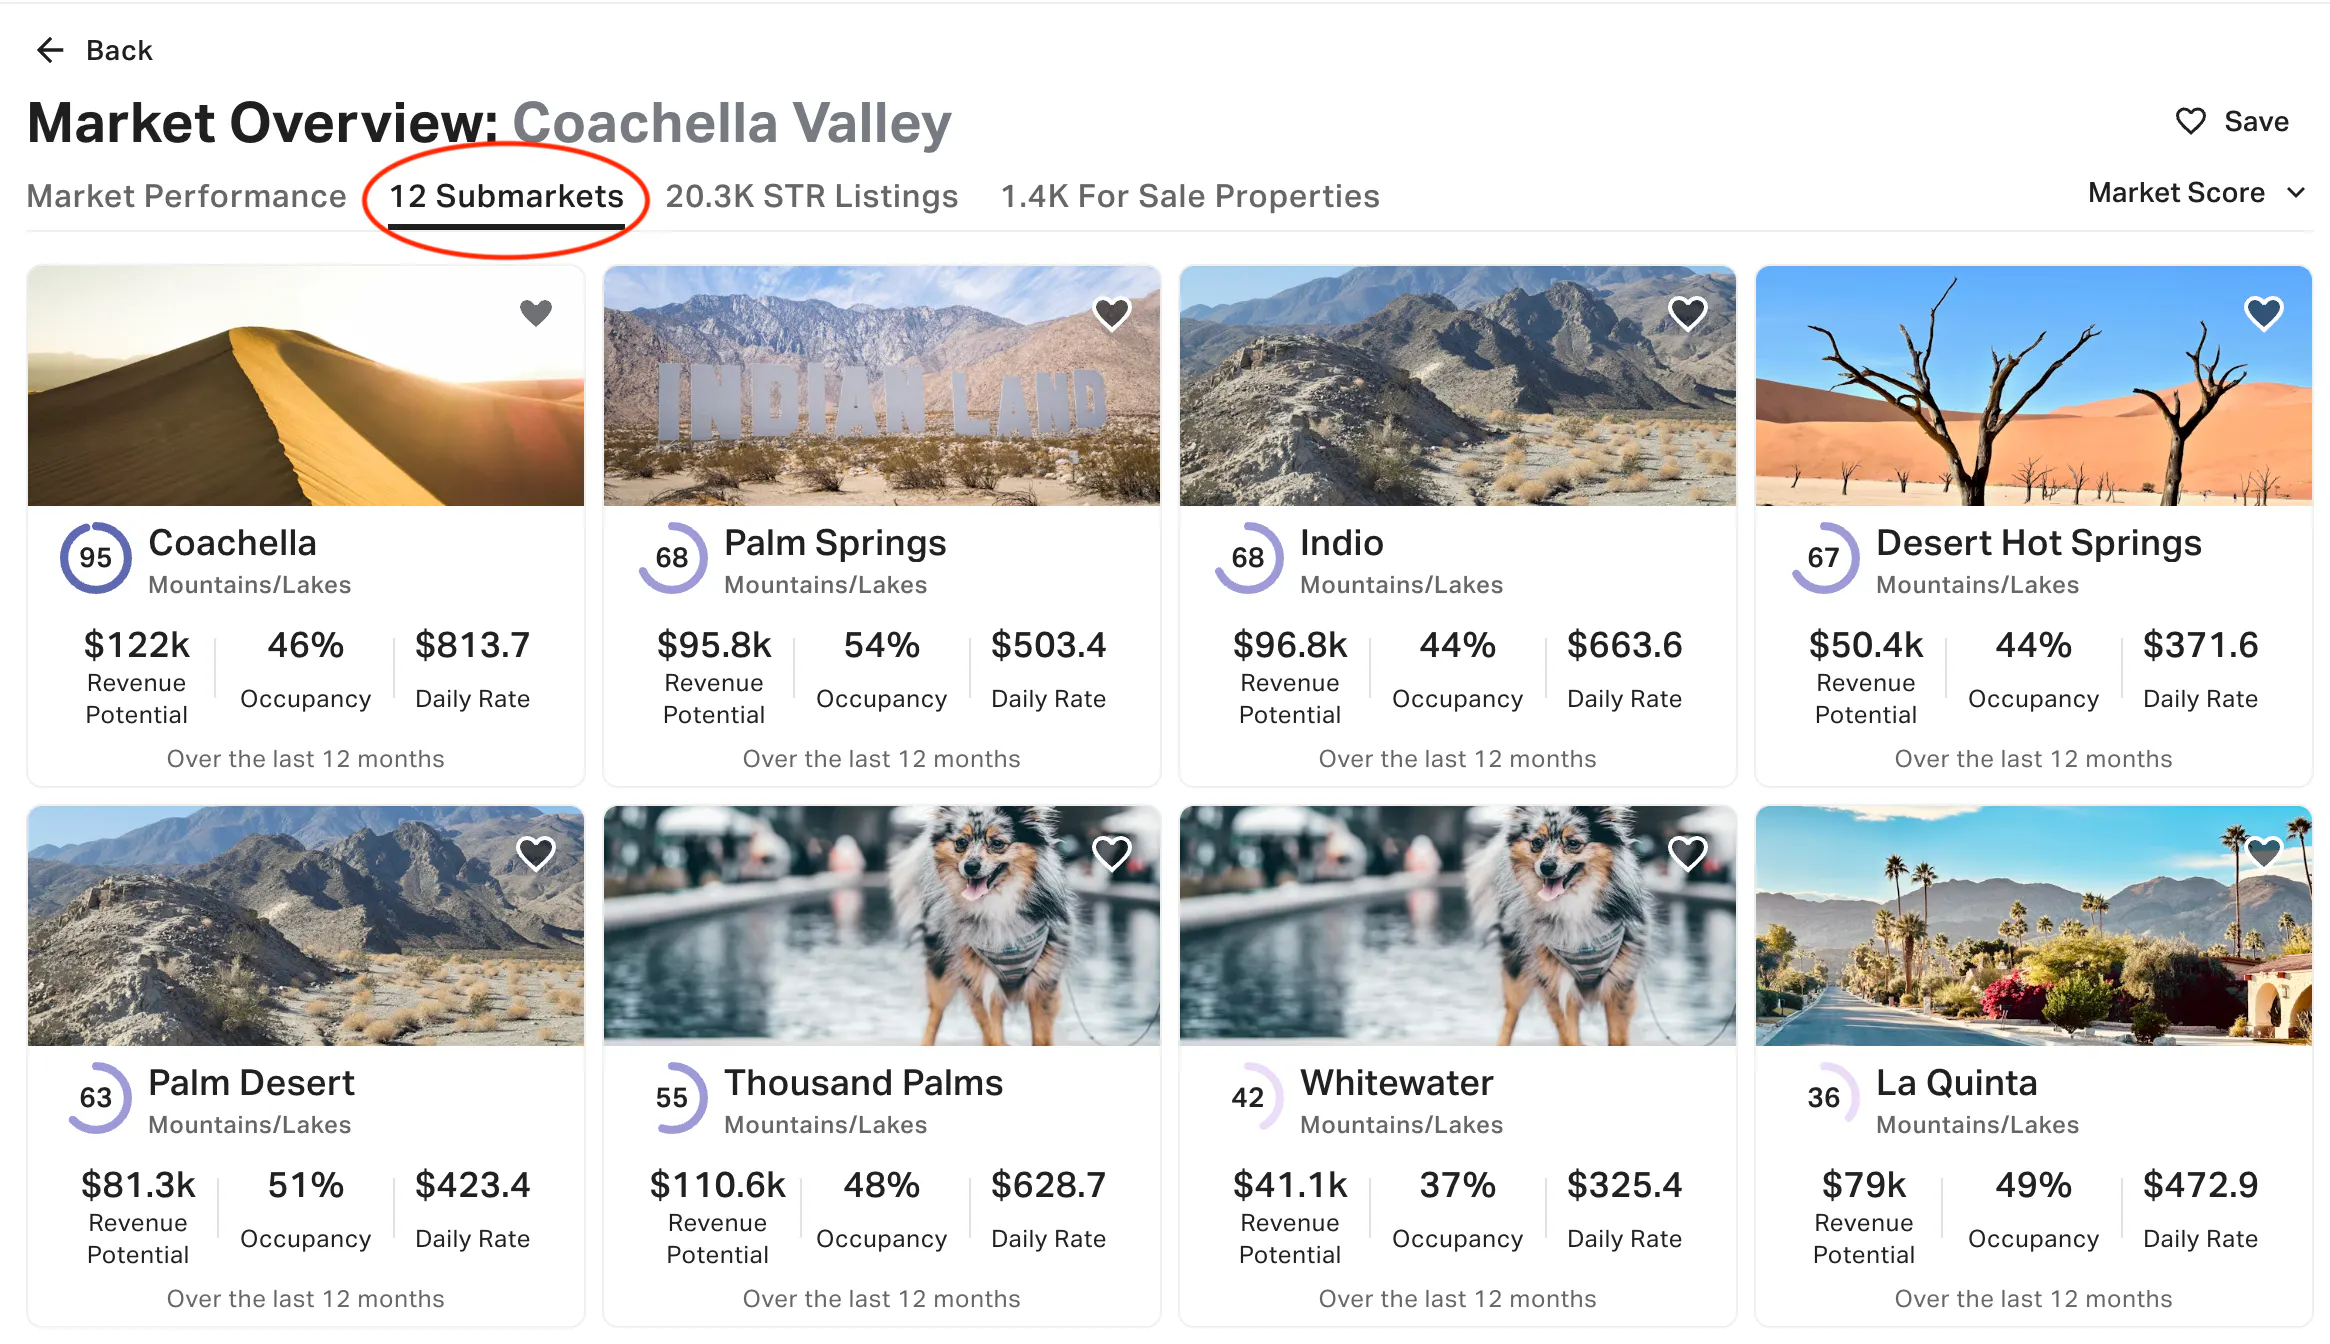
3. Review Market Scores: Our analysis begins with the market score, a key indicator of investment potential. Look for this score for each submarket.
4. Compare Opportunities: You'll notice significant variations in scores. For instance:
- Coachella, CA has a score of 94
- Rancho Mirage, in contrast, scores just 2
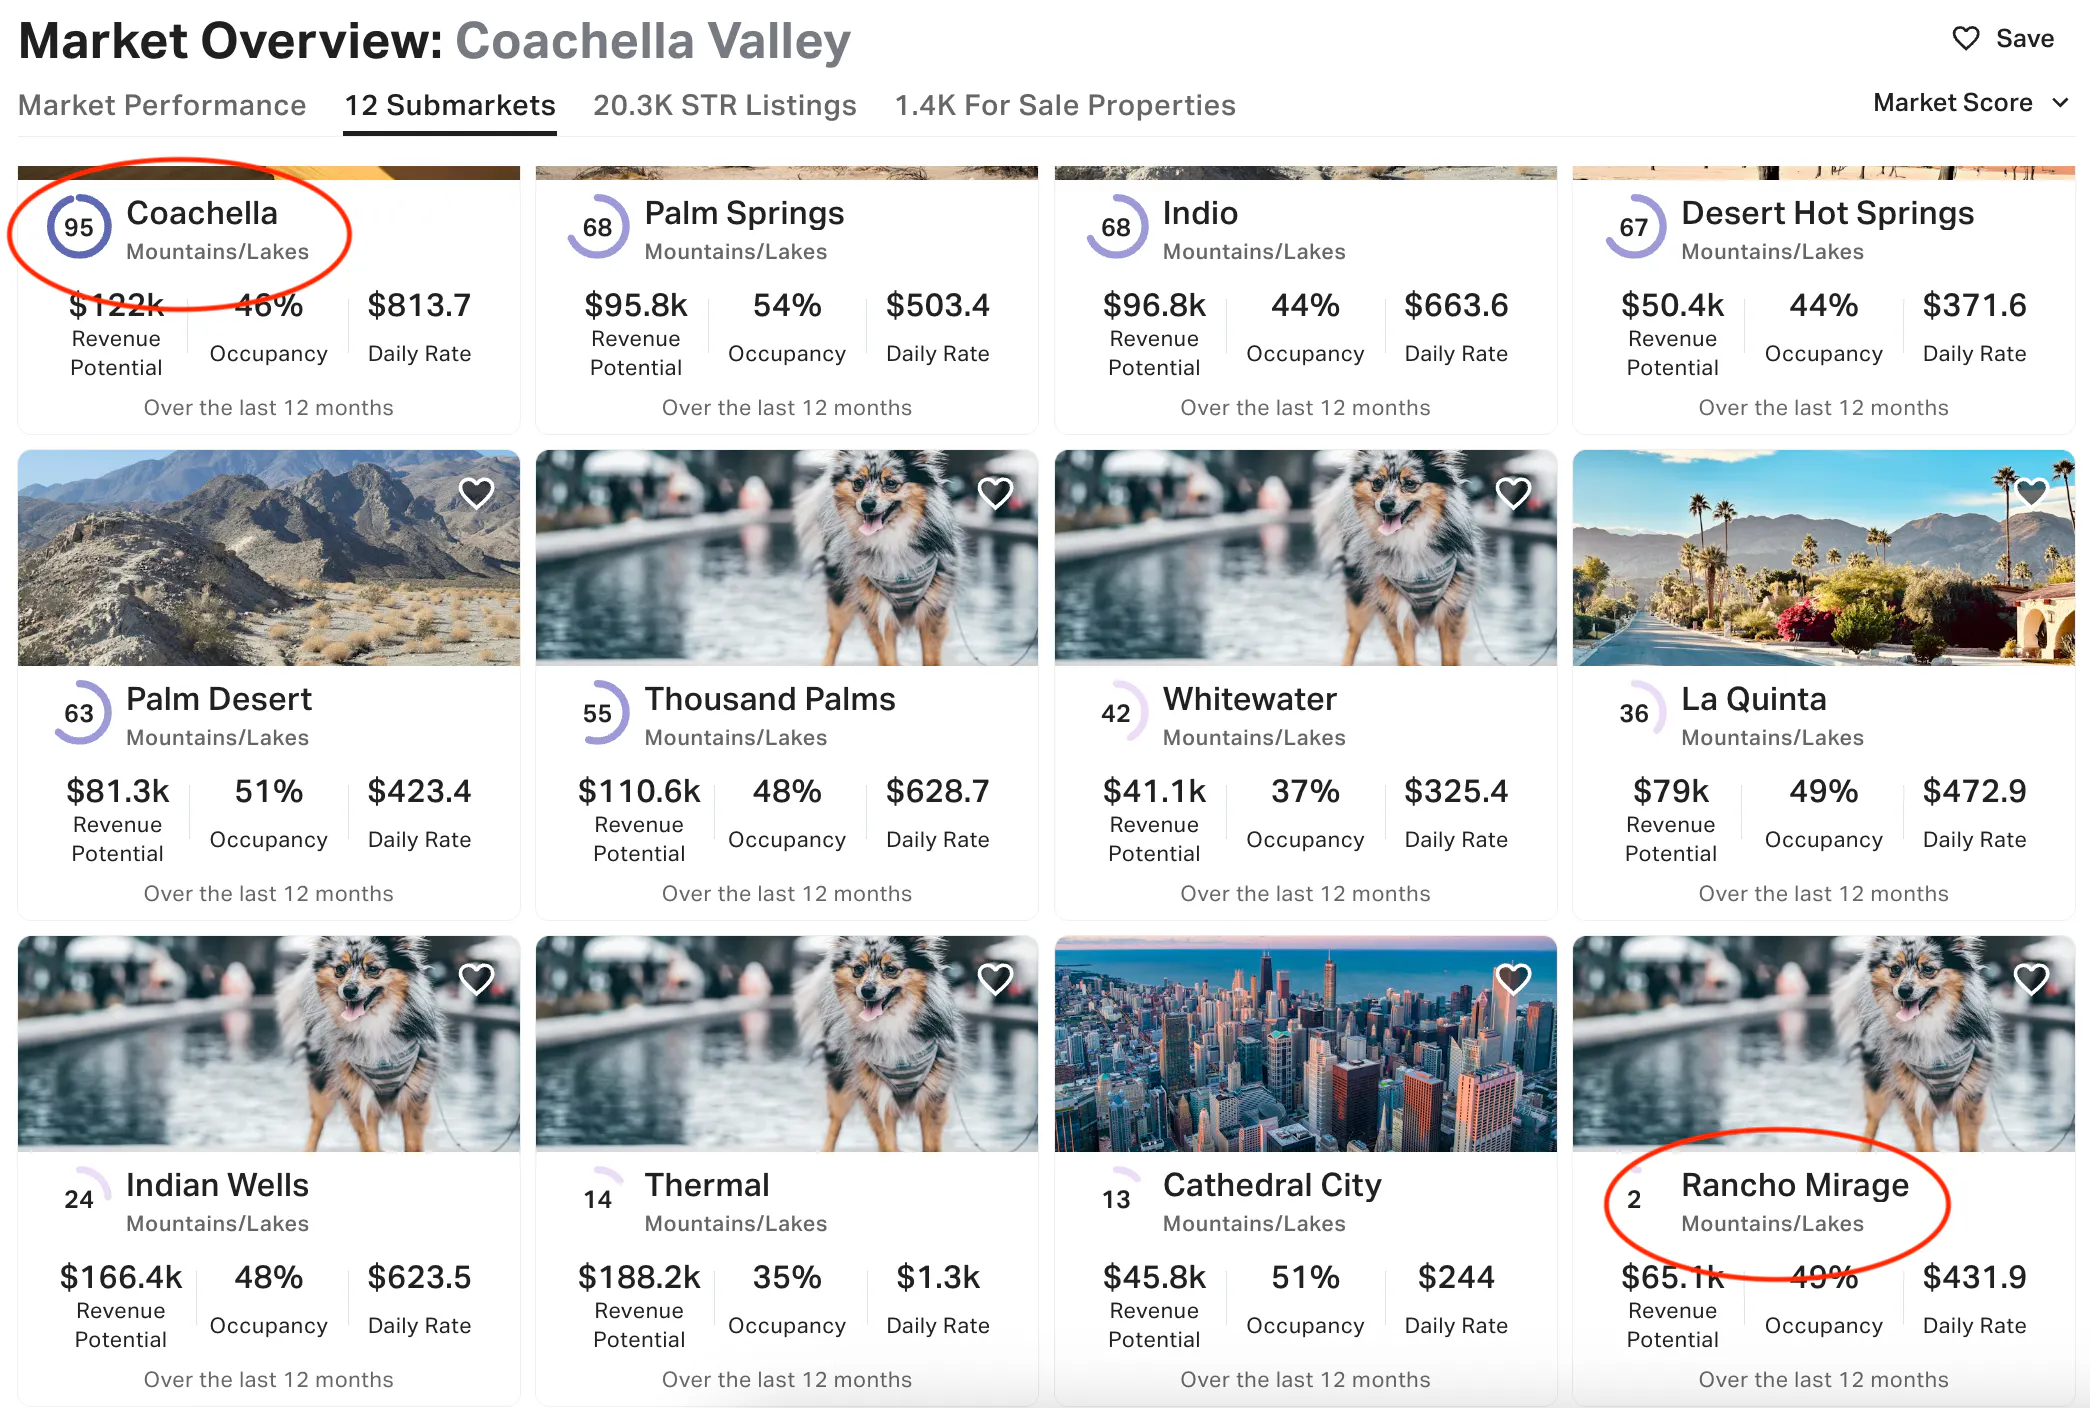
5. Analyze the Spread: This wide range of scores highlights why submarket analysis is crucial. A high-scoring area like Coachella might offer opportunities you'd miss by only looking at the overall market.
Our Sort option lets investors sort by three additional variables: occupancy, average daily rate (ADR), and revenue potential. By sorting the 12 submarkets by Occupancy, we found that Palm Springs and Cathedral City had the highest occupancy rates, both at above 50% throughout the year.
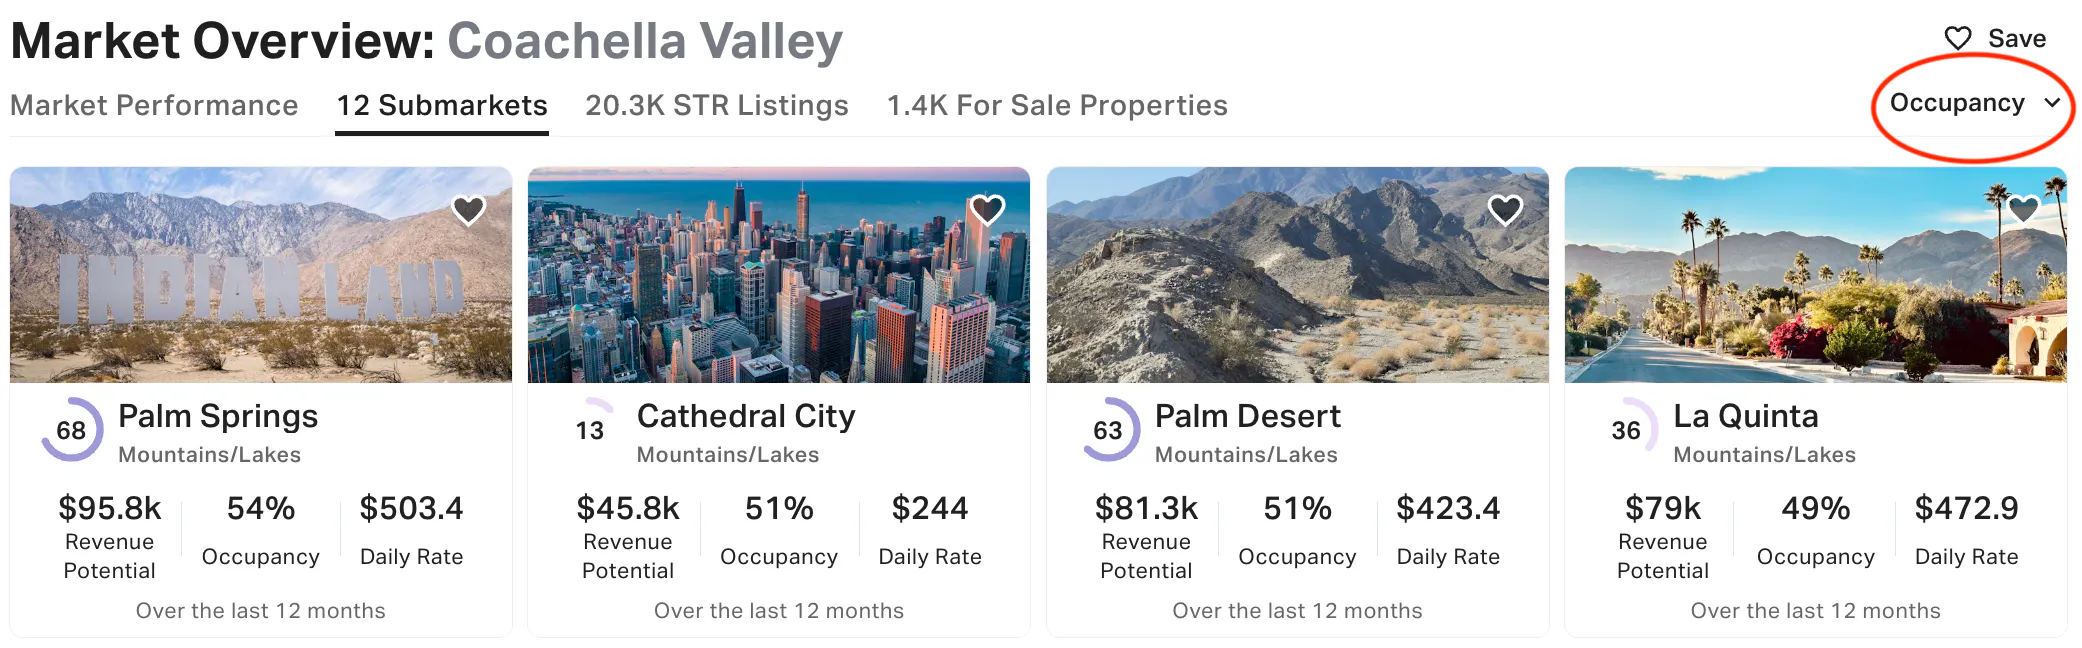
The real power of AirDNA now comes by combining the filters with the ability to compare markets against each other.
For a more targeted analysis, let's apply a series of filters to focus on 1-2 bedroom, budget/economy, entire-home properties in Palm Springs. With these filters in place, we uncover some revealing insights.
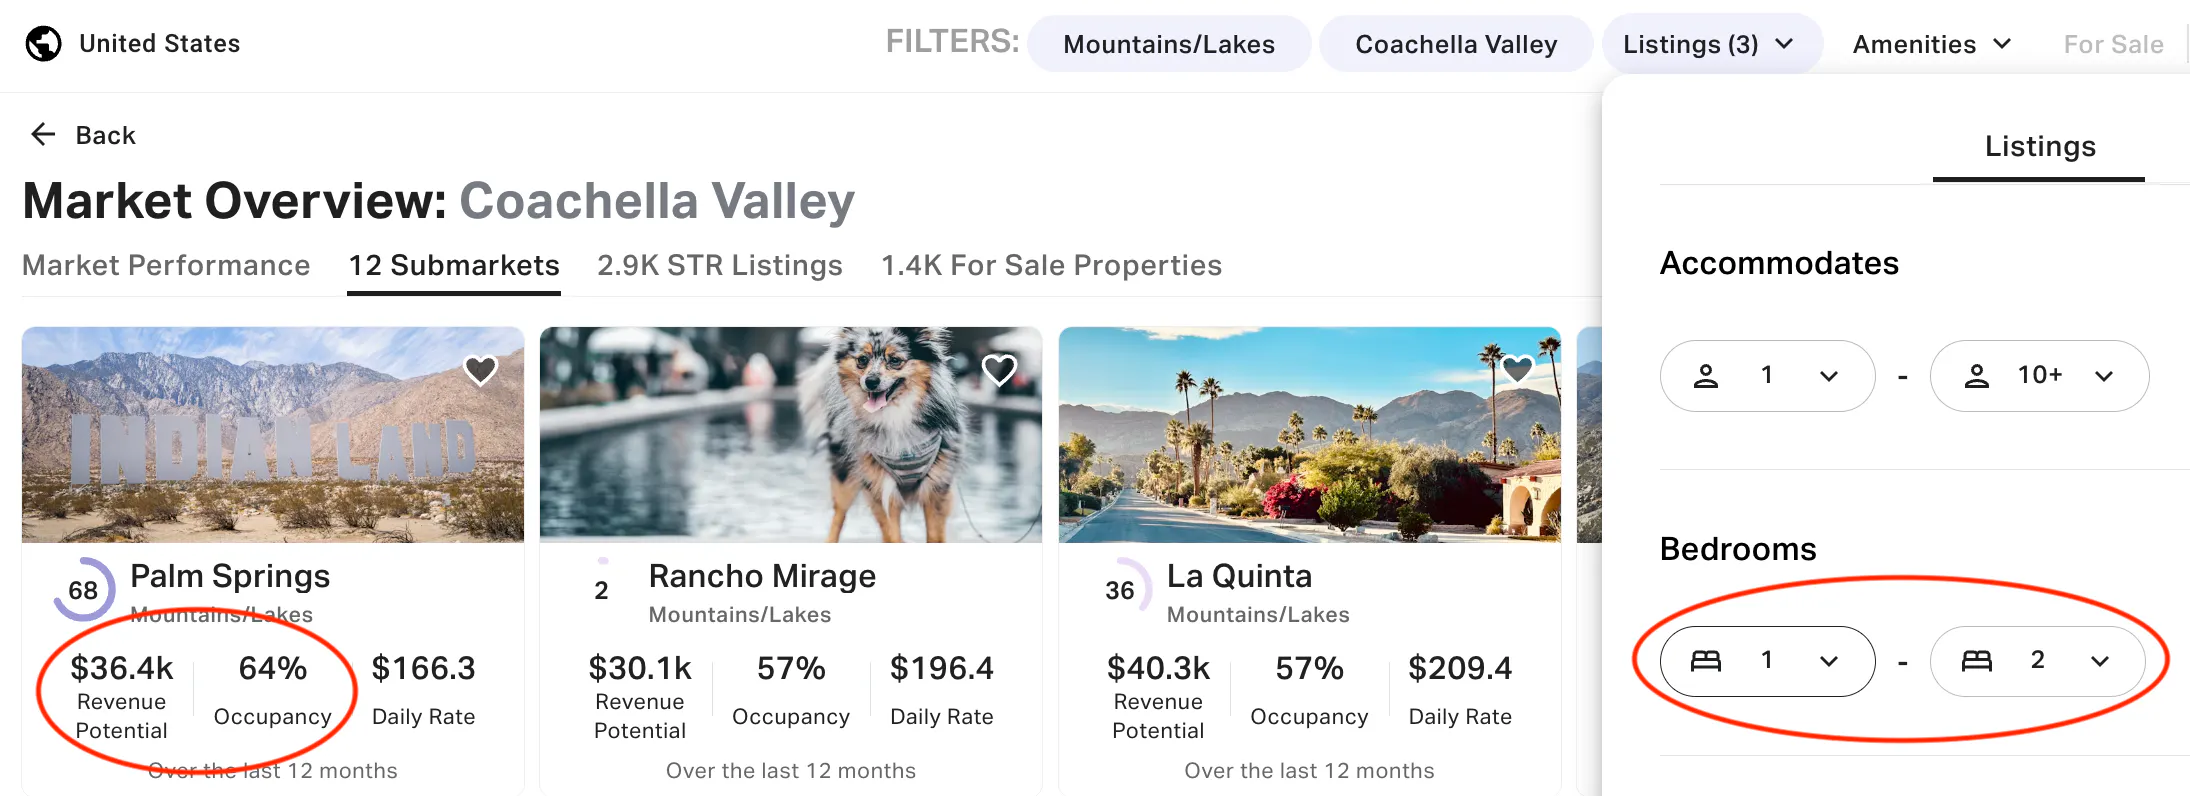
The occupancy level jumps significantly from 53% to 64% for our filtered properties. Conversely, the ADR drops substantially from $526 to $166 for our specific property type. This filtered view shows that even within the same area, different types of rentals can perform very differently.
It's a clear reminder of why digging into the details matters when you're planning your next investment.
Now, let’s adjust the criteria for an investor interested in single-family properties with 4 or more bedrooms in high-end or luxury segments, each with a review score of 4.6 and above. This would lead to a completely different set of performance metrics. Cathedral City has the highest occupancy rate at 57%, while Palm Springs has fallen to just 50% occupancy, despite having a very high average daily rate of $2.2k.
Research Airbnb Markets
Gain insights into the revenue and occupancy trends in your market.
Now, let's consider how to use this information in your investment decision.
If you're targeting budget-friendly, high-occupancy properties, then the 1-2 bedroom units in Palm Springs look promising with their 64% occupancy rate, despite the lower ADR.
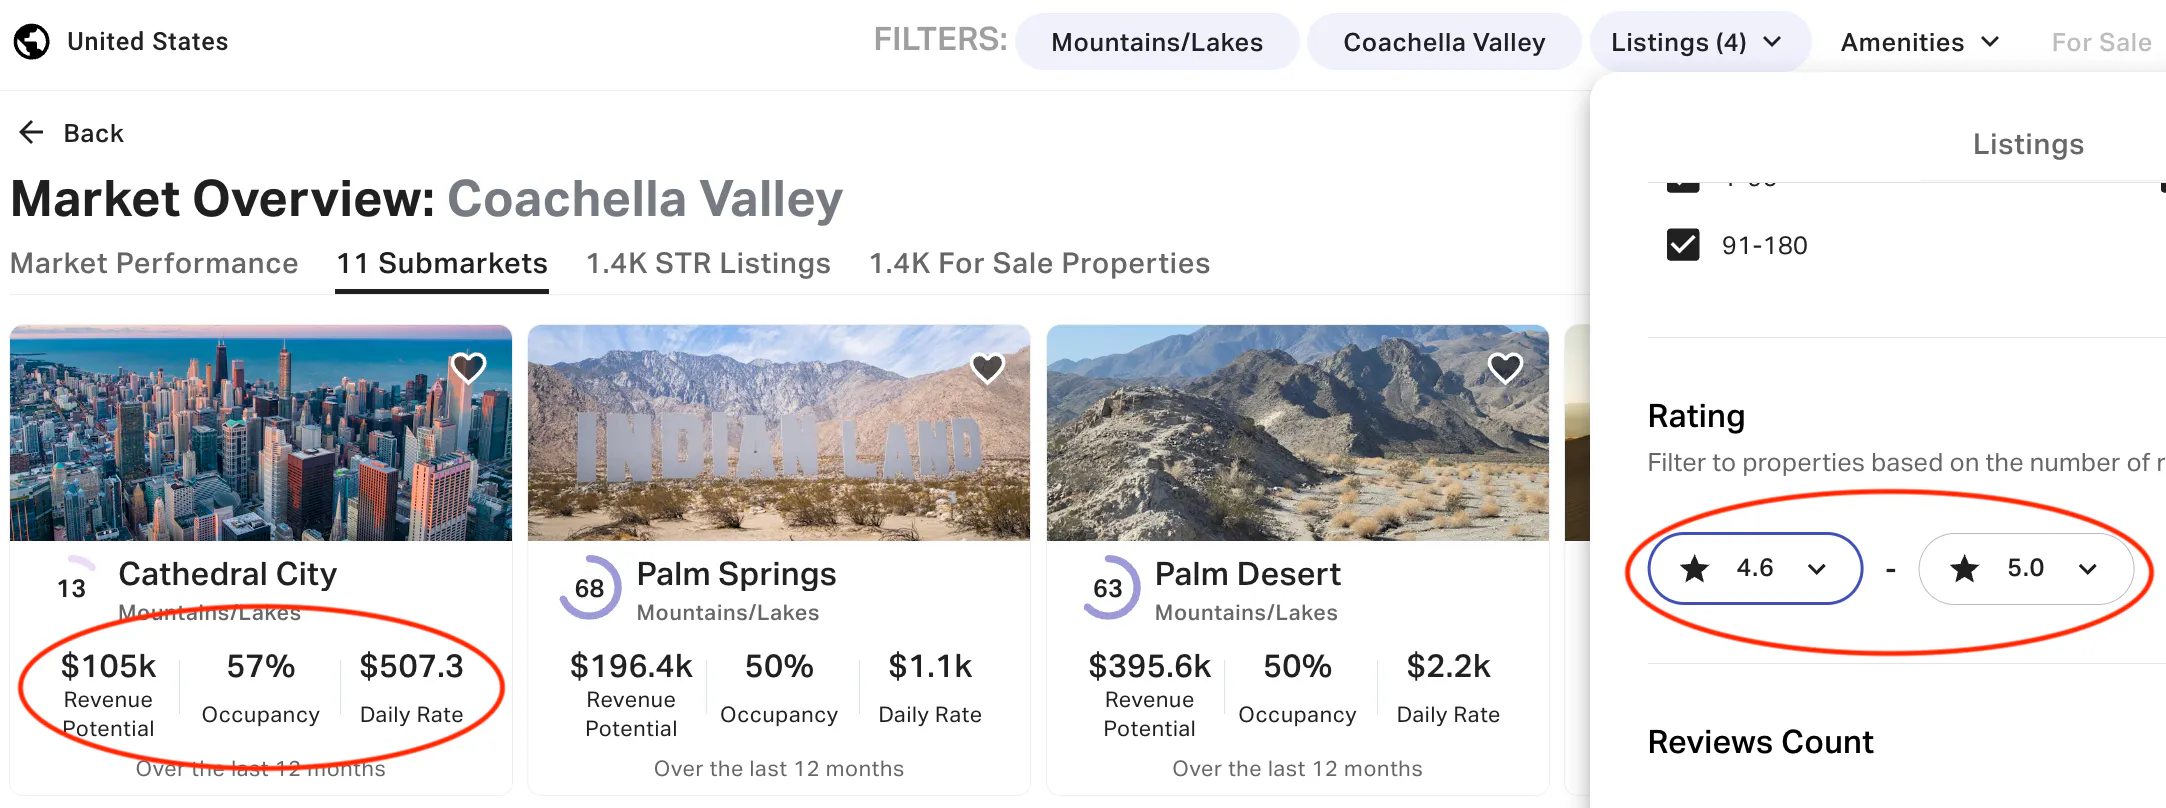
For luxury investments, Cathedral City's 4+ bedroom properties offer a good balance of occupancy (57%) and high ADR ($507), though these may come with higher costs and guest expectations. Your choice depends on your investment goals, budget, and risk tolerance. This STR submarket analysis would provide the data you need to make an informed decision tailored to your specific situation.
For Sale Properties in Your Submarket: Property-Level Analysis
While submarket data provides a great starting point, the real opportunities emerge when you zoom in on individual properties. AirDNA's 'For Sale Properties' feature allows you to do just that. Here's how to use it effectively:
1. Navigate to the 'For Sale Properties' tab in your chosen market.
2. Apply filters to match your investment criteria. You can narrow down by:
- Number of bedrooms and bathrooms
- Price range
- Property type
- And more
3. Once you have a list of potential properties, it's time to roll up your sleeves and do some number-crunching. For each property that catches your eye:
- Note down its sale price
- Check its revenue potential using AirDNA's Airbnb calculator
- Calculate the gross yield manually using this formula: (Revenue Potential / Sale Price)
Let's compare two areas as an example:
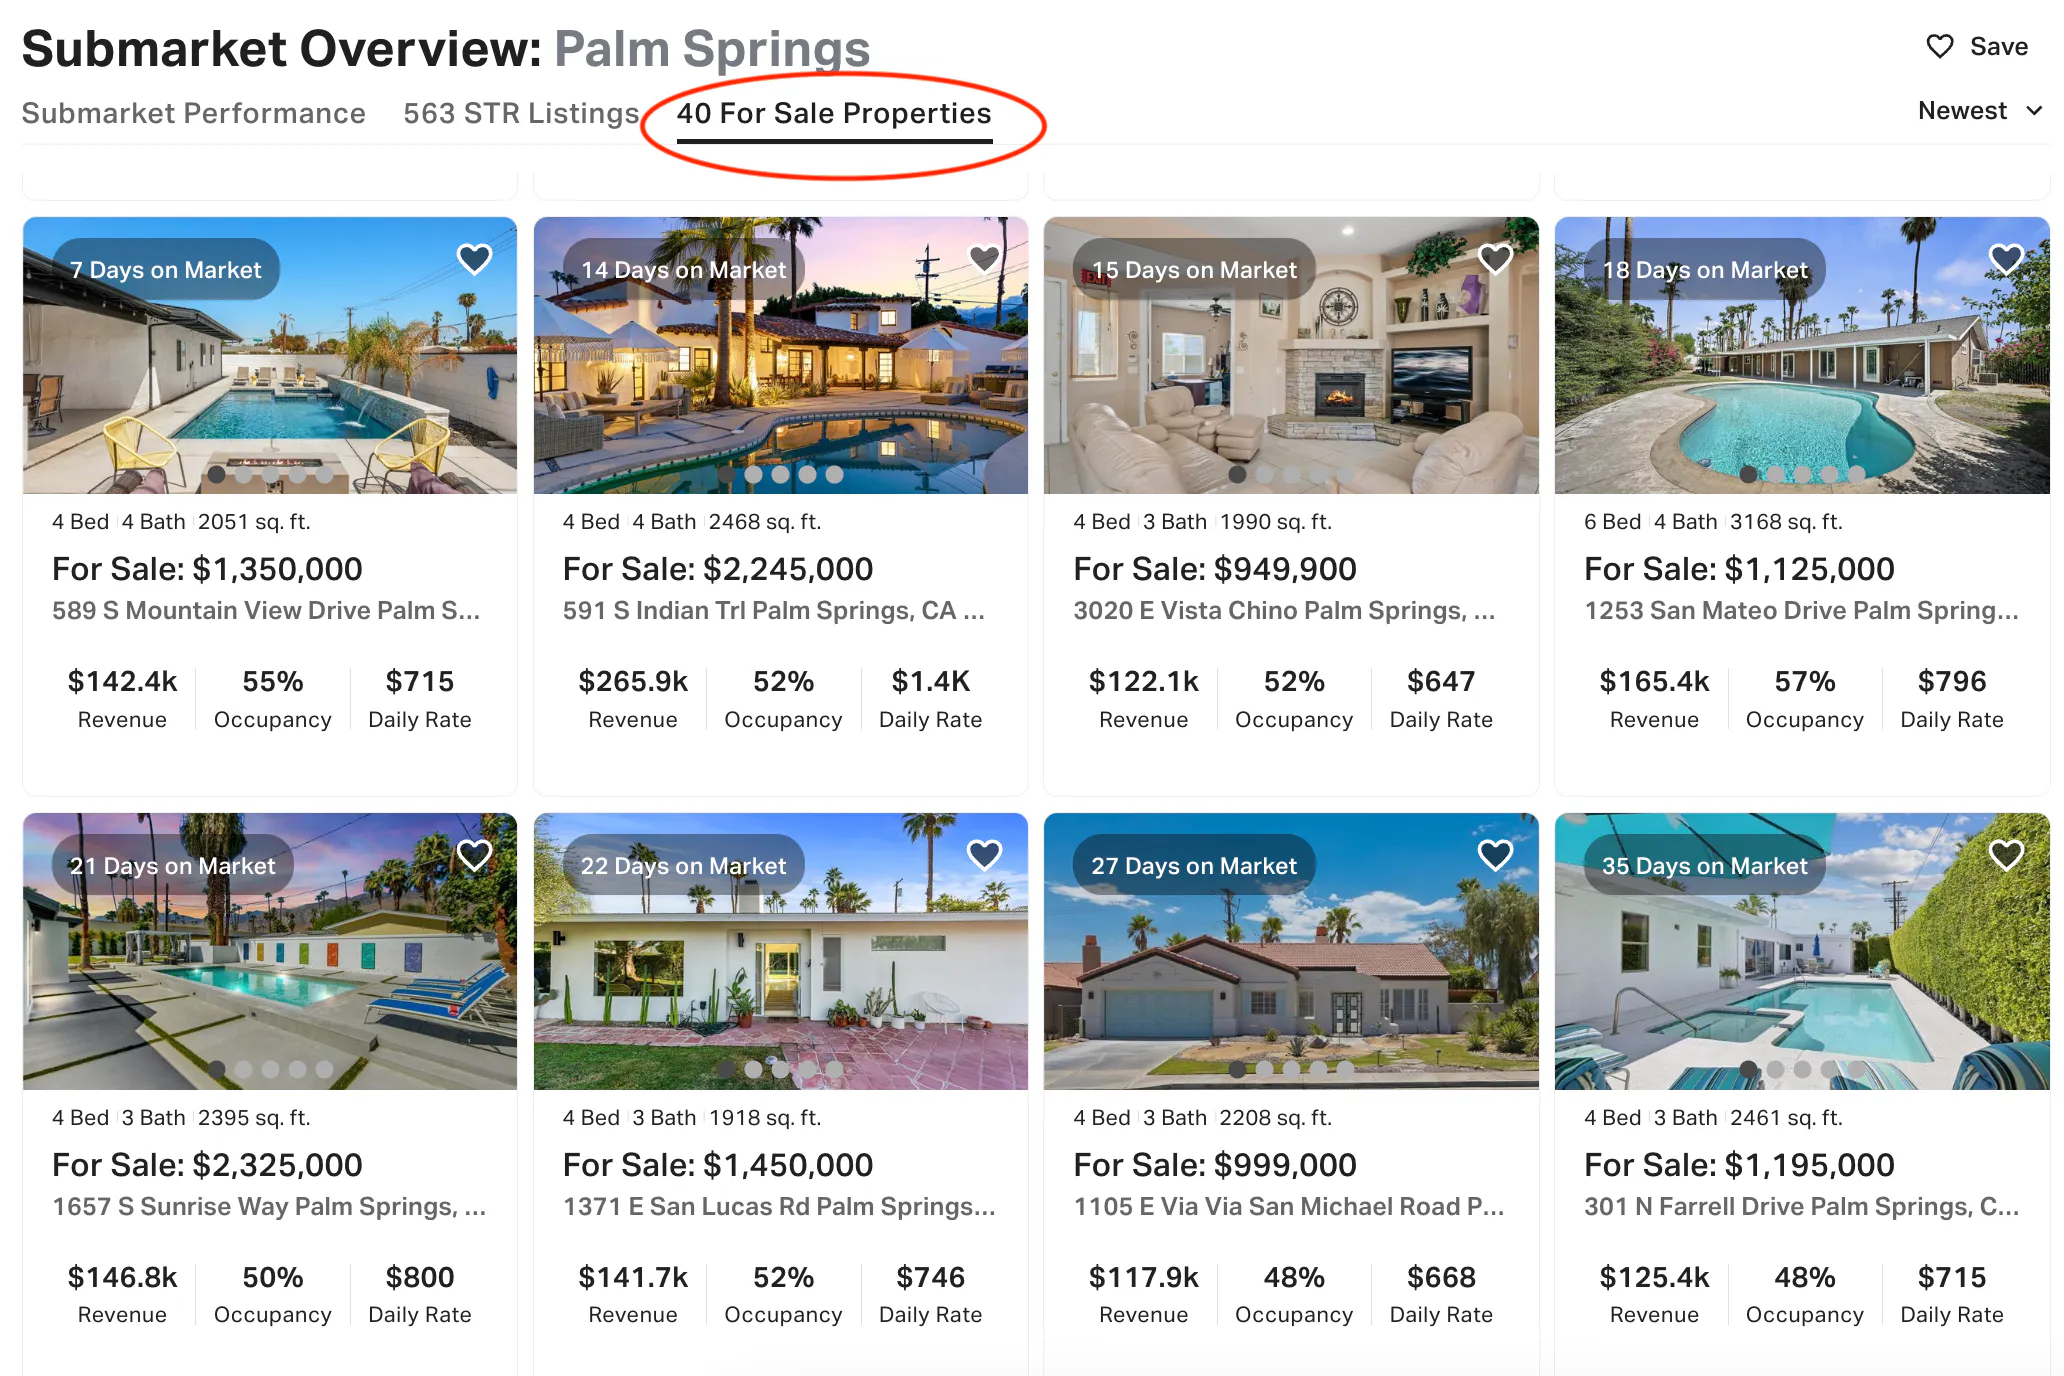
In Palm Desert, for 4+ bedroom properties priced between $300k and $1m, we're seeing an average gross yield of about 13%.
Now, let's look at similar properties in Palm Springs. Here, we see a higher average gross yield of around 17%.
This difference suggests that Palm Springs might offer better investment opportunities for this property type. It's a clear signal to focus your property search in this submarket.
Remember, these tools provide a starting point for your analysis. Always conduct thorough due diligence before making any investment decisions.
Find Hidden Gems with National Submarkets
Have you ever dreamed of owning a cozy mountain cabin or a sun-soaked beach house? With AirDNA's national submarket search, your investment possibilities are limitless. This powerful tool allows you to compare submarkets across the entire country, helping you uncover hidden gems in markets you might never have considered.
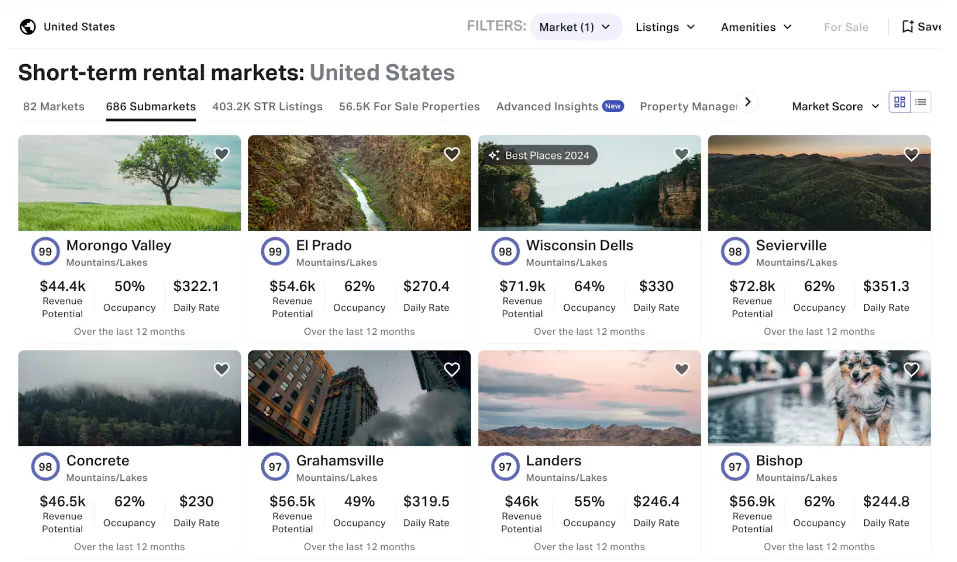
Here's how to make the most of this feature:
1. Access the National STR Submarket Search: Navigate to this tool from your AirDNA dashboard. You'll be presented with a map of the entire country, dotted with potential investment hotspots.
2. Apply Filters: Narrow down your search based on your specific investment criteria:
- Location Types: Mountain, beach, urban, rural, etc.
- Market Sizes: Large cities, small towns, or anything in between
- Investment Criteria: Occupancy rates, average daily rates, revenue potential, and more
3. Compare Submarkets: Once you've applied your filters, you can compare submarkets side by side. Look at key metrics like:
- Market Score
- Occupancy Rates
- Average Daily Rates
- Revenue Potential
- Seasonality Patterns
4. Dive Deeper: Found an Airbnb submarket that piques your interest? Click on it to access more detailed data, including:
- Top-performing property types
- Pricing trends
- Demand pacing
5. Explore Multiple Markets: Don't limit yourself to one area. Use this tool to compare submarkets across different states or regions. You might find that a small town in Colorado outperforms a popular beach destination in Florida for your specific investment goals.
6. Stay Informed: Market conditions can change. Use the national submarket search regularly to stay on top of emerging trends and opportunities nationwide. Create a saved list of your favorite submarkets to quickly access and monitor your top picks without starting your search from scratch each time. You’ll also want to bookmark our Best Places to Invest report to keep your finger on the pulse.
By leveraging this powerful feature, you can expand your investment strategy beyond your local market. Whether you're looking for high-yield properties in up-and-coming areas or stable investments in established markets, the national submarket search helps you make data-driven decisions on a national scale.
Want to take your analysis even further? Our Investor's Guide to Short-Term Rental Market Analysis offers a comprehensive overview of the entire market analysis process. From understanding STR regulations to assessing market demand and avoiding common analysis pitfalls, this guide provides the foundational knowledge you need to make informed investment decisions.
Frequently Asked Questions
What is an Airbnb submarket?
In the short-term rental industry, a submarket refers to a specific area within a larger market. These submarkets can have distinct characteristics that affect property performance, such as proximity to attractions, local regulations, or target guest demographics.
How does STR submarket analysis benefit Airbnb hosts and property managers?
Submarket analysis helps Airbnb hosts and property managers make data-driven decisions about property acquisition, pricing strategies, and amenity offerings. It allows for more precise targeting of guest preferences and can lead to improved occupancy rates and rental income.
What key metrics should I consider when doing an Airbnb submarket analysis?
Key metrics include occupancy rates, average daily rates (ADR), revenue potential, seasonality patterns, and market growth trends. Also consider the Airbnb saturation rate, which indicates the level of competition in a submarket.
How can I use submarket data to optimize my pricing strategy?
Submarket data can inform your investment decisions, dynamic pricing strategy and much more. By understanding occupancy rates, ADR, and seasonal trends specific to your submarket, you can select the best STR investment for your needs, or adjust the prices of an existing property to maximize revenue during peak periods and maintain competitiveness during slower times.
Can a STR submarket analysis help me decide between multiple potential investment properties?
Absolutely. Airbnb submarket analysis can provide critical insights when comparing potential investments. It can help you assess the relative potential of properties in different submarkets, considering factors like occupancy rates, revenue potential, and growth trends.
ARTICLE SUMMARY
Think you know your STR market? Look closer. The best investors use submarket analysis to spot lucrative opportunities others miss. In this article, we show you how to use AirDNA to compare submarkets, analyze individual properties, and uncover high-yield STR investment opportunities.
Dillon DuBois
AirDNA Senior Product Manager
Dillon DuBois is a seasoned expert in the short-term rental space, having worn many hats at AirDNA since joining in 2019. From driving B2B marketing initiatives to shaping product strategy, Dillon’s deep understanding of both the company and the industry makes him a key player in delivering innovative solutions. Now a Senior Product Manager, he leverages his experience to bridge the gap between data and user needs. He manages his own short-term rental in Medellín, Colombia, and enjoys all things outdoor adventure, travel, cooking, & surfing.
