

 Calculate Revenue
 Research Markets
 Find For Sale Properties
 Compare My Listing
 STR Revenue Calculator
 Custom Comp Sets
 Submarket Insights
 Custom Search Filters
 Rate Recommendations
 Performance Benchmarking
 Competitor Comparison
 Owner Contact Details
 Property-level performance data
 Tourism Insights
 Real Estate Investment Analytics
 About Us
 Sales
Sales Support
 Press
PressU.S. Market Review: July Sees Occupancy Growth Despite Rate Challenges.
Published: August 16, 2024
Last updated: February 26, 2025

Bram Gallagher
Key Takeaways
- July saw continued occupancy growth in the STR market, with strong demand despite high listing numbers.
- Shorter booking lead times are changing how hosts manage pricing, with a focus on last-minute bookings.
- Federal Reserve rate changes may impact future STR listings and market performance, but demand remains strong for now.
In July, the U.S. short-term rental (STR) market saw the highest ever number of listings and demand nights, and for the third month in a row increased occupancy on a year-over-year basis. Despite available listings reaching over 1.7 million during the month, the occupancy rate of 68.1% was the highest monthly occupancy since July of 2022, and only slightly lower than the pre-pandemic July 2019 occupancy rate (-0.6%).
After years of declining occupancy since the record highs of 2021, AirDNA predicted that 2023 would mark the bottom of the STR cycle, with unit-level performance starting to improve. A calendar shift in March and April confused the picture somewhat, but with the past three months of YOY occupancy gains combined with an earlier Labor Day weekend and strong pacing for August mean that the 2024 summer travel season will almost assuredly have improvements over 2023.
On the other hand, a trend of shortening lead times has led to existing operators keeping prices level. Hosts of new listings are also slightly undercutting market prices to ensure that rooms stay full. ADR on average was down slightly, -1.3% compared to July 2023, reversing a trend of RevPAR improvements and decreasing RevPAR by -0.9% YOY.
Research Airbnb Markets
Gain insights into the revenue and occupancy trends in your market.
Employment and Inflation’s Impact
Trying to gauge the macroeconomic environment has been difficult in the last month as ambiguous data have painted a mixed picture. The jobs report released by the Bureau of Labor Statistics (BLS) indicated 114,000 jobs were added to the U.S. economy in July. This was only about half the number most economists see as consistent with maintaining full employment. In fact, the unemployment rose to 4.3%, marking the fourth month of unemployment level increases.
Nevertheless, some slippage in the labor market is an expected outcome of increased interest rates as the Federal Reserve applies the brakes to the economy in an attempt to control inflation. The Fed’s next task is to time rate decreases perfectly so that inflation remains low and the labor market keeps its footing.

Data on the inflation front has been more positive. Productivity, seen as disinflationary, increased by 2.3% in Q2, well above Q1’s 0.4% increase. Inflation, as measured by the Consumer Price Index, decreased to 2.9% in July, down from 3.0% in June.
This marks the first inflation rate below 3% since March 2021 and less than a point from the Fed’s target rate of 2.0%. The Producer Price Index, which tracks inflation faced by manufacturers and retailers (often cast as a leading indicator for later consumer prices) also declined significantly in July, to a lower-than-expected 2.1% YOY. This is down from 2.7% in June.
It appears that the Fed is poised to cut rates in September in an effort to prevent further weakening in the labor market. This portends positive developments for consumer confidence and potential relief for the housing market.
At a Glance: Key U.S. STR Performance Metrics for July 2024
- Revenue per Available Rental (RevPAR) decreased 0.9% year-over-year (YOY) to $226.38
- Available listings were 1.71 million, up 6.6% YOY
- Total demand (nights) rose 8.3% YOY
- Occupancy was 0.3% higher YOY at 63.7%
- Average Daily Rates (ADR) decreased 1.3% YOY to $332.20
- Repeat Rent Index (RRI) increased by 0.2% YOY
- Nights booked increased by 7.7% YOY

Listings Surge to 1.7M Despite Slowing Growth Trend
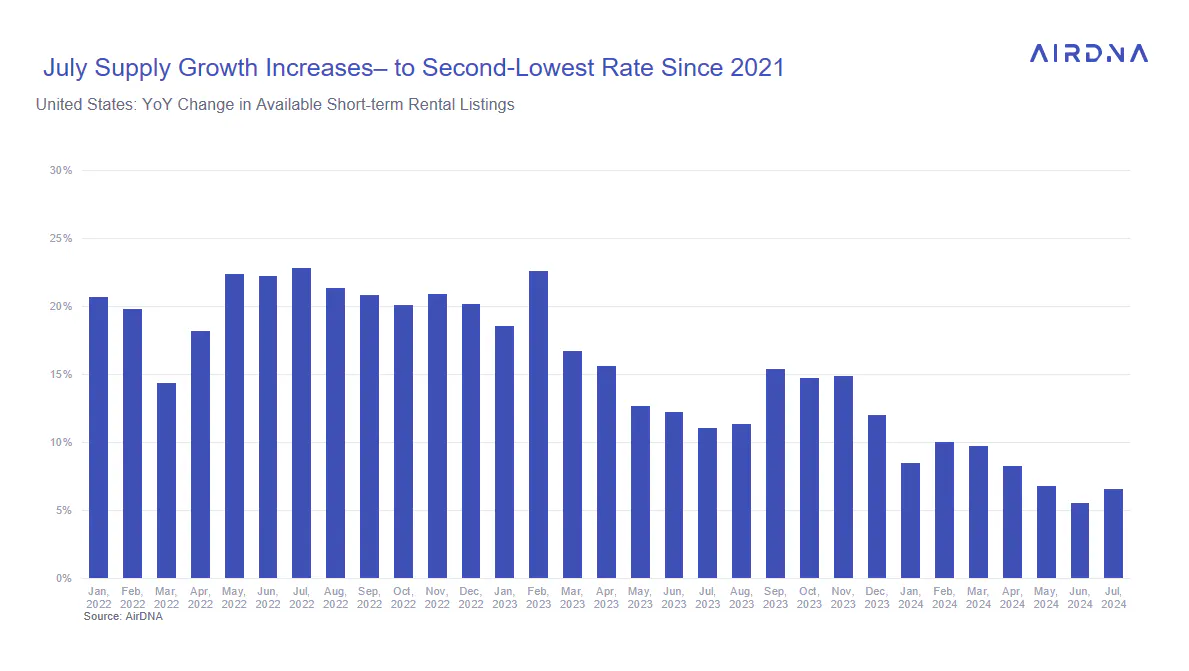
In June the total available listings in the U.S. STR market increased to its highest level ever (1.71M). The growth rate increased to 6.6%, up from the 5.6% rate seen in June. Still, this growth rate marks the second-lowest YOY growth rate for available listings since June of 2021 and reflects a two-year long trend of declining listing growth (due to increases in interest rates).
This is welcome news for operators that had previously faced several years of declining occupancy due to remarkably quick listing growth.
While Federal Reserve rates are expected to be cut soon, the descent should be more gradual than the increase, and in any case will take some time to transmit to mortgage rates. Even with lower rates, there is an additional lag for new STR listings to be brought to the market, so AirDNA expects that the slowing supply trend will continue for at least the next year.
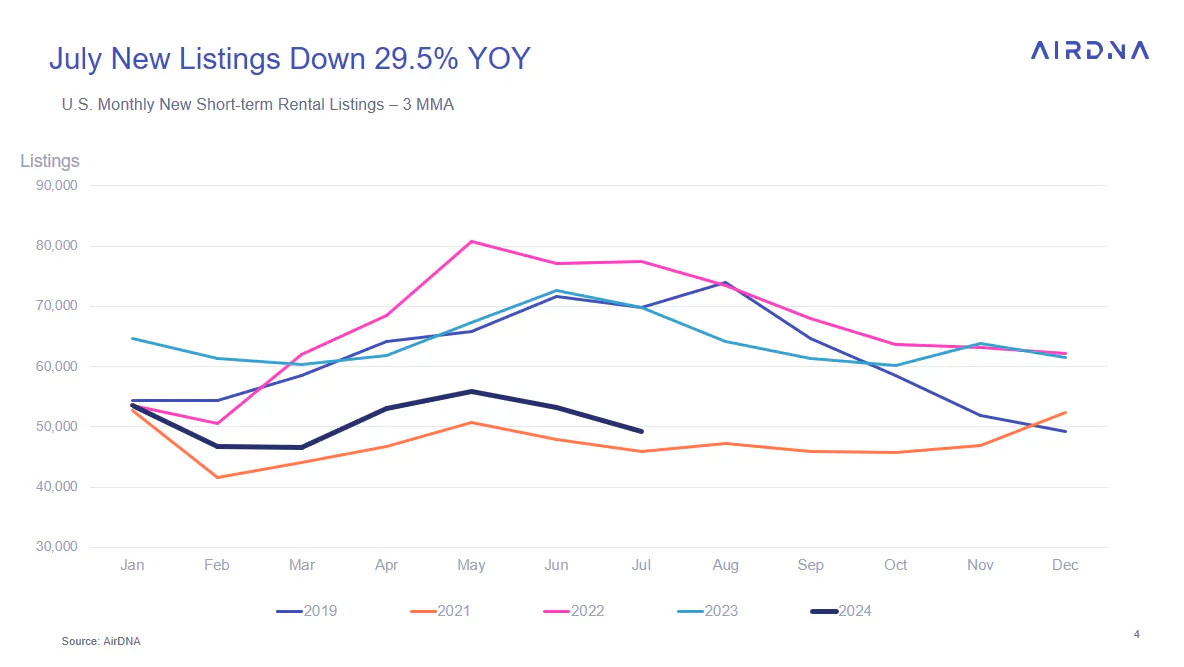
The investment headwinds can also be seen in the number of new listings, which peaked in 2022. Since then, new listings have generally declined, and in July declined -29.5% YOY.
This year’s pattern of new listings so far resembles 2023 less than 2021, when the immediate aftermath of the Covid-19 outbreak severely reduced the introduction of new listings.
Demand Remains Elevated as Occupancy Continues to Climb
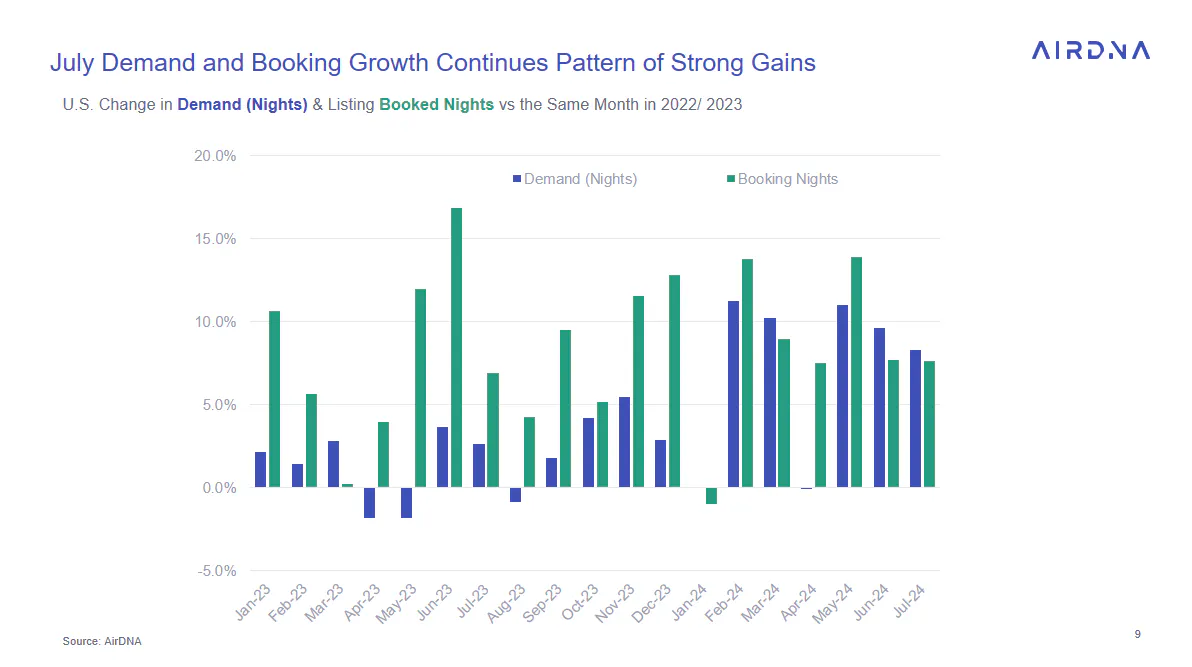
Supply might be slowing, but demand growth remains hot this summer. July’s demand growth rate of +8.3% represented an additional 1.98M demand nights and the third month in a row with over 1.9M additional demand nights compared to the same month in the previous year.
Growth like this hasn’t been seen since the summer of 2022. Bookings - a dependable forward indicator of demand - also remained strong in July, growing 7.7% over the previous year (similar to June).
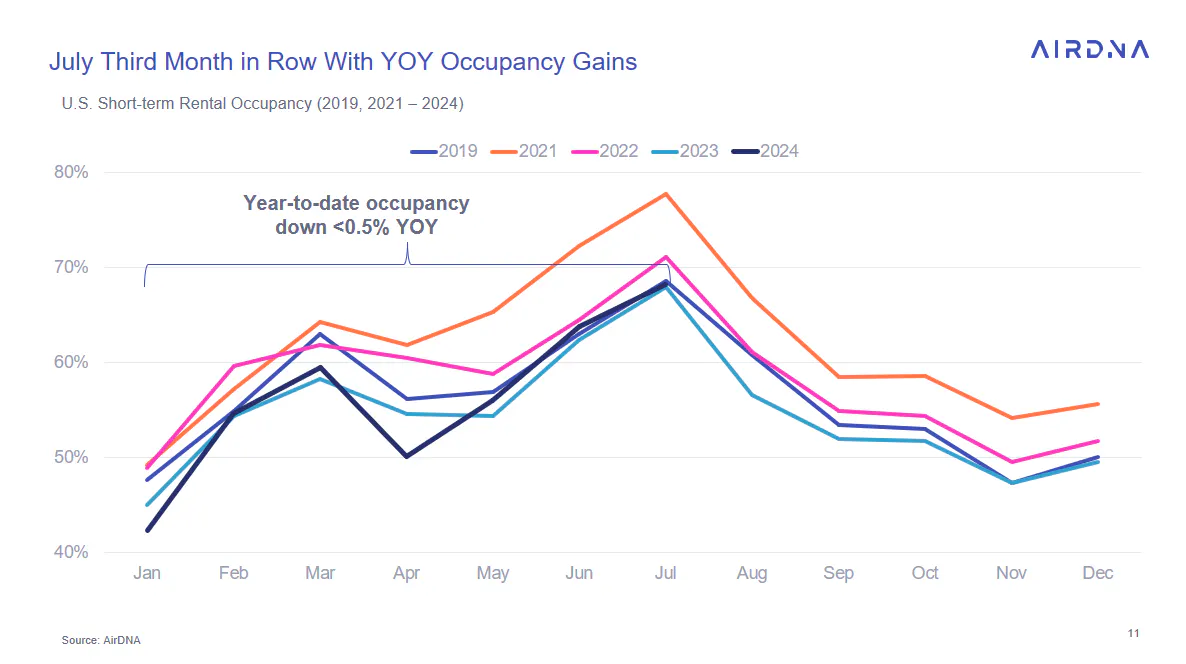
The combination of slower supply and strong demand has kept occupancy above last year’s level for the past three months, and July, typically the highest monthly occupancy of the year, was no exception.
Occupancy in July 2024 (68.1%) was just barely above July 2023 (67.9%) and barely below pre-pandemic July 2019 (68.5%). Year-to-date, occupancy is still slightly lower than 2023 based on the weak performance seen in January and April, but the gap has narrowed to a razor-thin 0.49%.
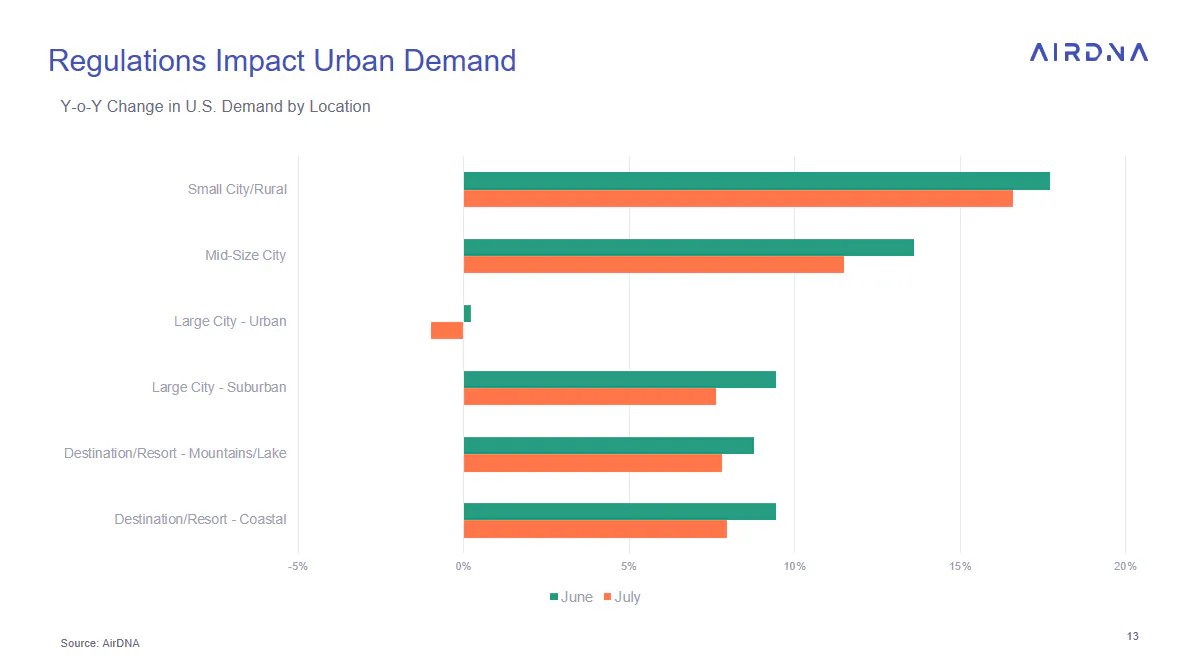
Turning to locations, it appears that, without the strict regulations and enforcement in urban areas such as New York City, July 2024 occupancy may well have exceeded pre-pandemic levels.
While demand growth in all locations was very slightly smaller in July than in June, urban locations were the only type to see YOY declines in demand. Resort locations on the coast, mountain, or lake as well as suburban locations had similar growth rates just under 8%, while small city/rural (+16.6%) and mid-size city (+11.5%) locations held on to the top and second-place demand growth spots.
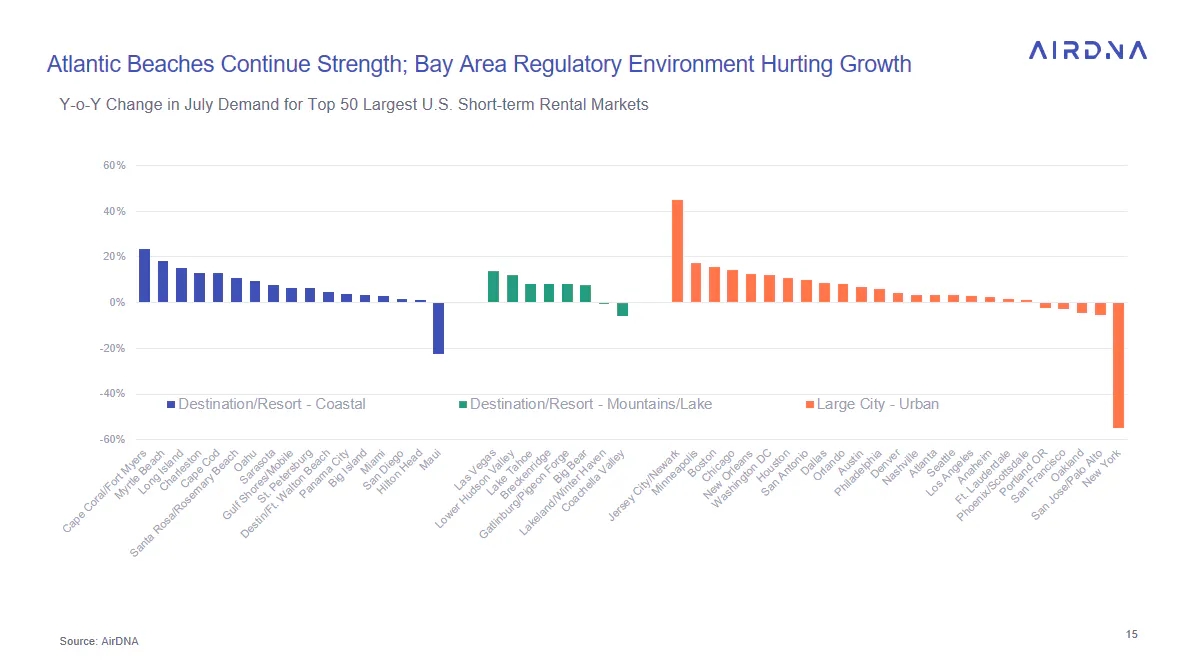
The top fifty markets may help characterize the trends in location types. Of the coastal resort markets, Cape Coral/ Ft. Myers (+23.3%) takes the top spot in demand growth as it sees recovery from Hurricane Ian. After that, the Atlantic Coast dominates including Myrtle Beach (+18.1%), Long Island (+15.1%), Charleston (+13.1), and Cape Cod (+13.1). Maui (-22.5%) is still recovering from the devastating wildfires and feeling the impact of STR regulations.
Looking at the Urban markets, it is clear that this location type is being heavily influenced by an enormous downturn in New York after new enforcement of regulations virtually eliminated short-term stays there. New rules in San Francisco also seem to have had a chilling effect on the entire Bay Area STR market.
Even though urban locations as a whole saw declining demand, many large cities saw significant demand growth. Besides Jersey City/Newark (+45.0%) reaping a windfall from New York’s regulation pushing visitors out of the city, Minneapolis (+17.4%), Boston (+15.5%), and Chicago (+14.4%) all had high demand growth.
Ditch the guesswork
Plan your STR strategy based on real booking activity and trends—plus, see how things change year over year.
Hosts Hold Rates Steady to Maintain Summer Occupancy
Rates had been a bright spot in the first four months of the year, but the summer strategy so far appears to be to keep prices unchanged from last year and for new listings to be priced slightly lower than the going market rate.
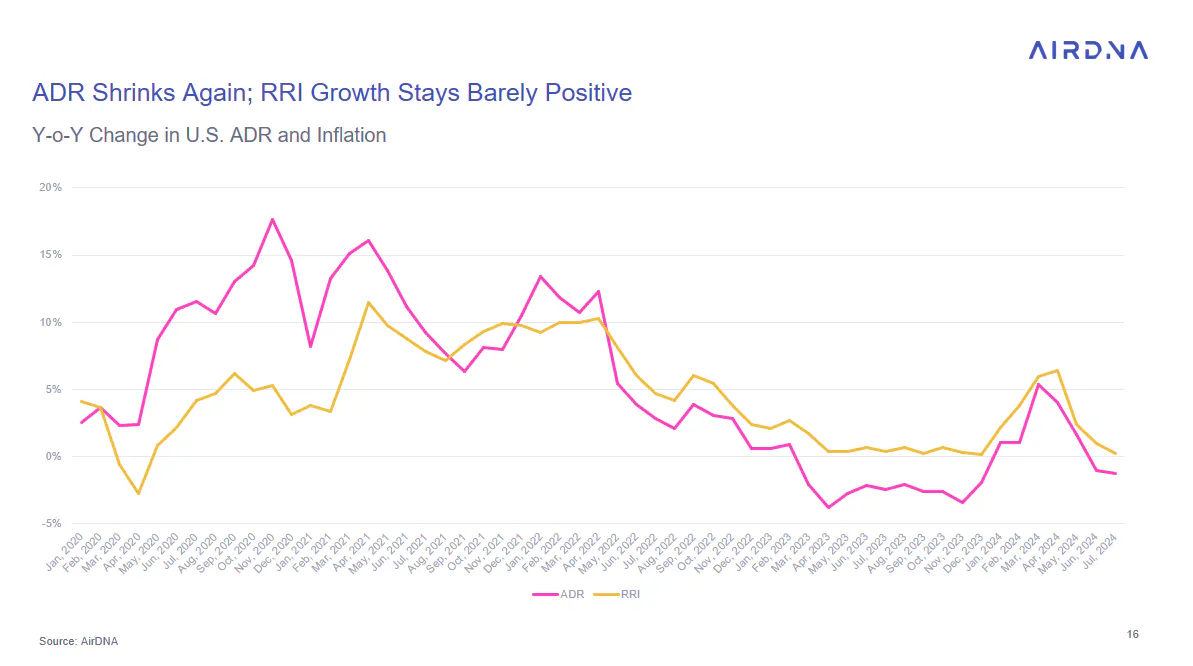
After reaching a high of 6.4% in April, the AirDNA Repeat Rent Index (RRI) has since fallen for the past three months and in July was only 0.2%. ADR has seen a similar pattern of decline and reached -1.3% in July, down from -1.0% in June. This indicates a mild mix shift that is lowering average rate.
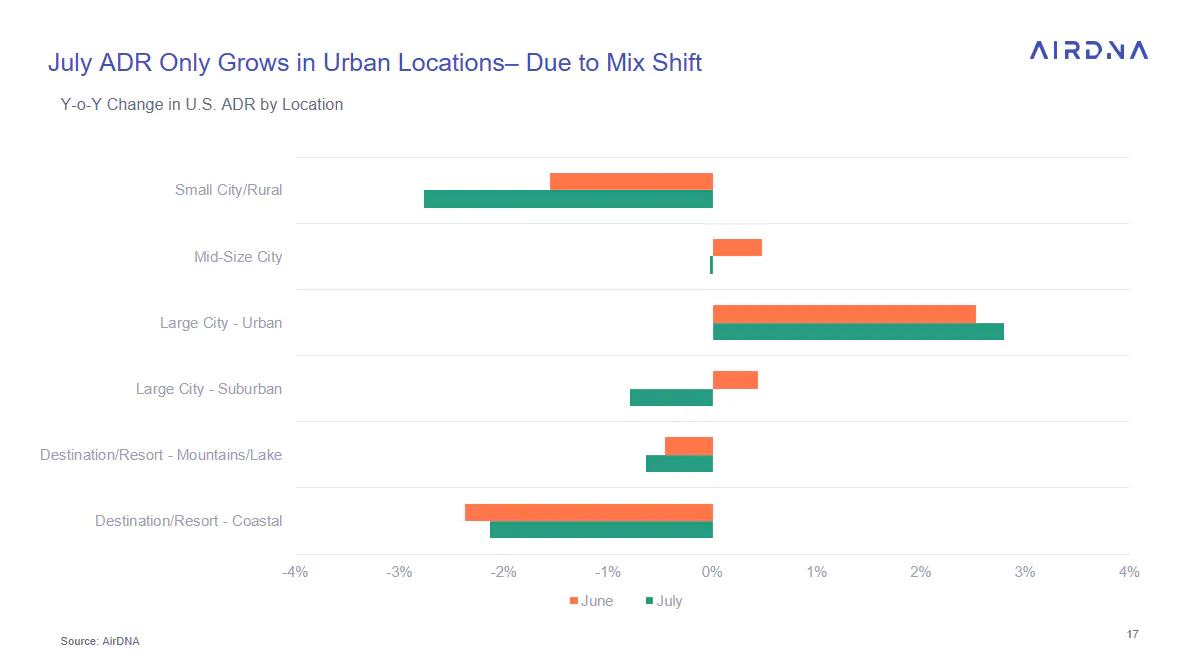
Looking at rates and locations, only urban areas managed positive ADR growth, and even that isn’t significant. The increase in rates for urban locations is largely due to a mix shift, as lower-priced units have disproportionately left New York and other cities. The RRI for urban locations was down by -1.2% compared to July last year.
Calendar Shift Drives August Booking Spike
In 2023, Labor Day fell on the fourth of September, meaning that the previous Friday, Saturday and Sunday occurred in September. This year is different - Labor day will be on September 2, and thus two highly popular travel days have been moved from September to August.
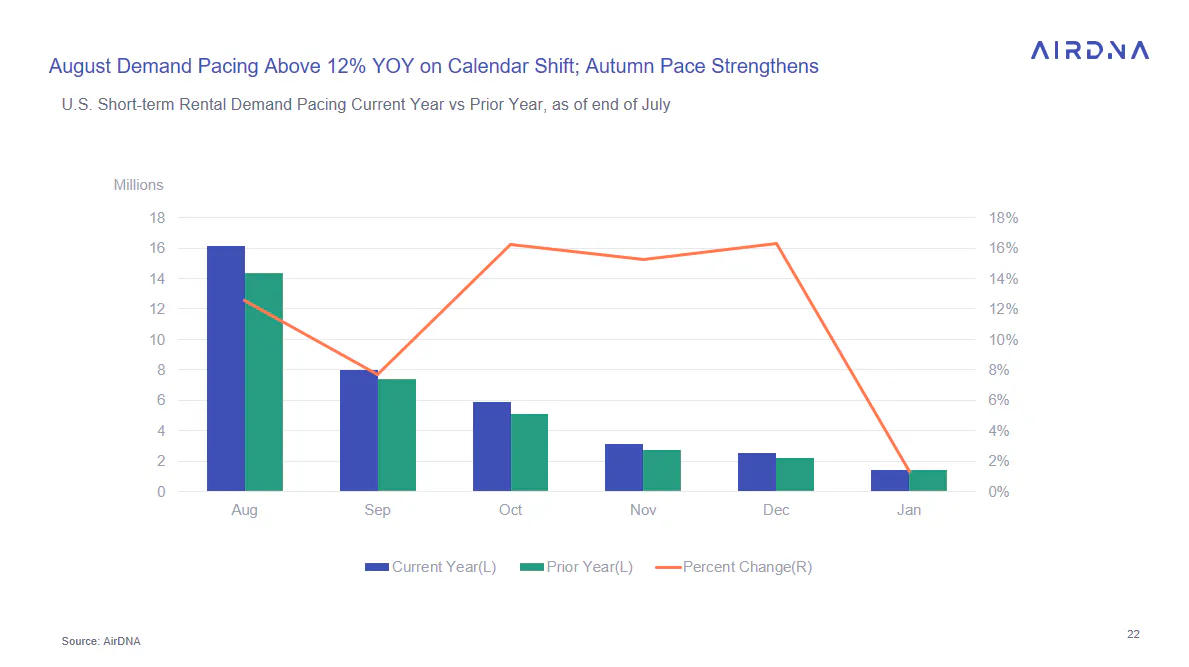
The calendar shift is reflected in pacing data, which indicates that on-the-books demand for August is 12.5% ahead of last year at the end of July. This has had a negative side for September which is seeing a slower pace, at 7.7%.
On the positive side, interest is elevated as demand pacing is above 15% for the following three months up till December.
An important factor that gives hosts pause before raising rates is the decrease in lead times.
Shortening lead times and a surge in last-minute bookings were both mentioned in the latest Airbnb earnings call, and has been a frustrating change for revenue managers trying to estimate how much to charge for peak profit.
Having STRs remain unbooked for longer certainly is an uncomfortable sensation, but demand is strengthening at the same time. To better understand this phenomenon, we investigated median and mean booking times since 2019.
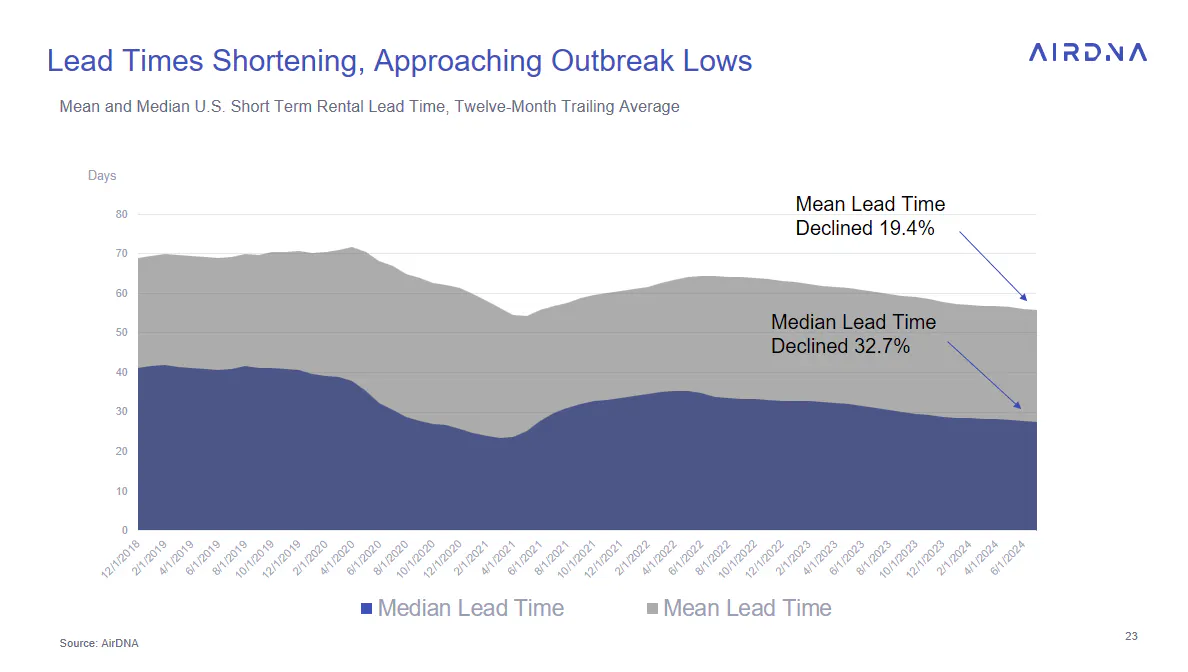
On a twelve-month trailing average basis, median lead times fell to 27.6 days, uncomfortably close to the post-Covid outbreak low of 23.4 days for the twelve months ending March 2021. Mean lead times are even closer, at 55.8 days in July 2024 compared to the low of 54.4 days in the twelve months ending April 2021.
On the other hand, mean times never dropped as low as median, and while median lead time in July is down 32.7% compared to July 2019, mean lead time only dropped 19.4%.
How can this be?
The answer depends on the mean’s sensitivity to extreme values, and lead times have gotten more extreme on both ends of the spectrum. If we look at the total proportion of demand that is booked for each week leading up to the reservation date, an obvious feature that leaps out is that last-minute bookings (bookings made the week of reservation) have increased dramatically, almost doubling since 2019.
This will obviously shorten both median and mean lead times; however, plotting the same data using a logarithmic scale gives better detail about what is happening to the early bookers.
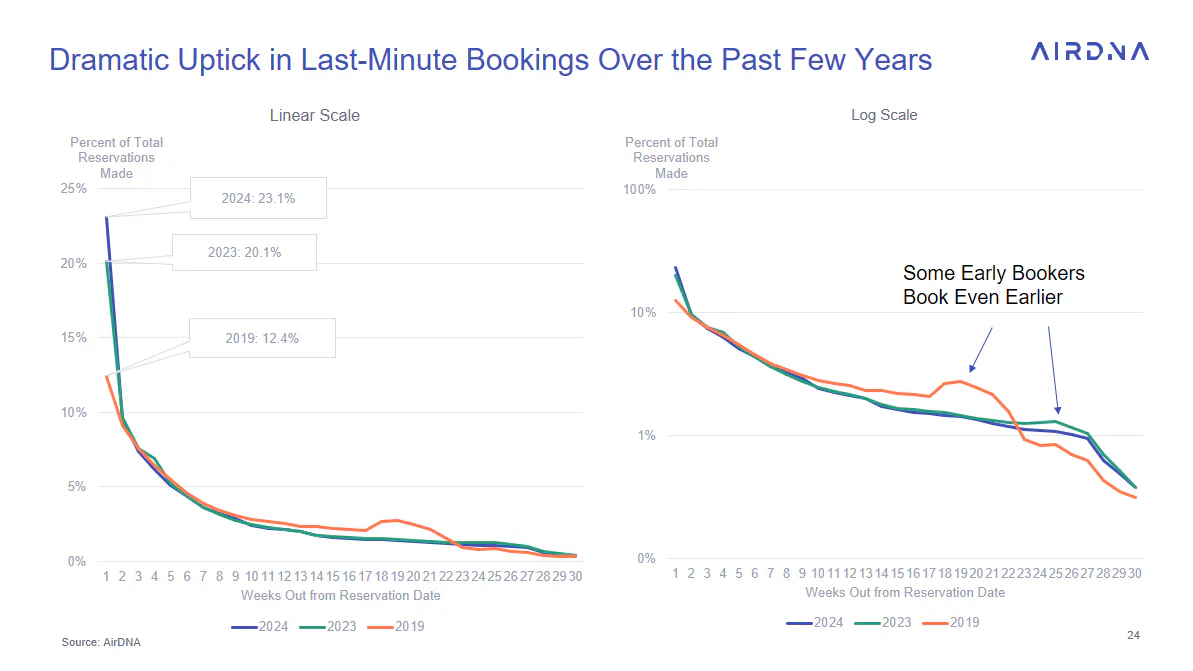
While in 2019, there was a noticeable surge in bookings that occurred about 20 weeks from the reservation, in later years it moved even earlier, to about 24-26 weeks before the reservation. These early birds are dragging the mean up, but have little effect on the median.
The importance of this is that booking behavior is changing in different ways for different groups of people. Hosts might think about catering to some that want an even longer window to book while also being aware that many more travelers today seem comfortable waiting until the last minute to book. A host may even want to hold off cutting rates. It isn’t necessarily the price that is keeping people from renting; rather, travelers’ behavior is changing.
Smart investments happen here
AirDNA’s powerful yet easy-to-use tools make hosting and investing a breeze. This means having every insight you need, all in one place, always up-to-date.
ARTICLE SUMMARY
July 2024 STR occupancy gains suggest a strong summer, despite price adjustments and shorter booking lead times.
Bram Gallagher
AirDNA Director of Economics and Forecasting
Bram Gallagher is an Economist at AirDNA, specializing in uncovering insights that drive smarter short-term rental decisions. He put his Ph.D. in Economics from the University of Georgia to work researching and forecasting hotel data with CBRE prior to joining AirDNA, as well as teaching economics at a number of universities. In his spare time, Bram enjoys making wooden furniture with hand tools.
