Top 16 Airbnb Markets in Rhode Island
Published: July 15, 2025
Rhode Island may be the smallest U.S. state, but its coastline, historic towns, and vibrant college cities pack a big punch for short-term rental (STR) investors. Whether you’re looking for summer-season beach yields, year-round urban bookings, or affordable second-home opportunities, the Ocean State boasts a diverse slate of high-potential markets.
What Is AirDNA’s Market Score?
Market Score is a proprietary metric that ranks how attractive a location is for STR investment. Each score is calculated from five data-driven pillars:
- Investability
- Rental Demand
- Revenue Growth
- Seasonality
- Regulation
Scores range from 0 to 100. Higher scores signal healthier overall market conditions. Inside the AirDNA platform, each pillar also receives its own 0-100 score, giving hosts and investors deeper insight into the specific strengths or weaknesses of any market.

Understanding Markets vs. Submarkets
This list features only submarkets, defined as:
- Markets = broad metropolitan areas or cities (e.g., “Providence”).
- Submarkets = smaller, more precise locations—downtown districts, beach towns, or specific neighborhoods—nested inside the larger market.
Focusing on submarkets can reveal lucrative pockets that get lost in statewide or metro-level averages. Investors who drill down often discover favorable regulation, stronger ADRs, or lower property costs than neighboring areas.
Airbnb Market Overview in Rhode Island
Rhode Island’s STR scene revolves around three key demand drivers:
- Coastal Leisure: Classic summer escapes like Narragansett, Newport, and Block Island command high nightly rates during peak season.
- Urban & Academic Travel: Providence—and its many micro-districts—benefits from universities, medical centers, and a growing culinary reputation.
- Regional Getaways: Smaller towns such as Bristol and Tiverton attract weekenders from Boston, Hartford, and New York seeking historic charm and waterfront views.
While seasonality is pronounced on the coast, Rhode Island’s compact geography allows investors to diversify within an hour’s drive, balancing summer-heavy ADRs with steadier off-season bookings in urban cores.
This is sample data – view real-time data in the AirDNA platform.
AirDNA's Market Score is updated on a monthly basis to reflect the previous month's data. This ranked list is updated annually. Explore the app to get the most current data.
Top 16 Airbnb Markets in Rhode Island (Ranked by Market Score)
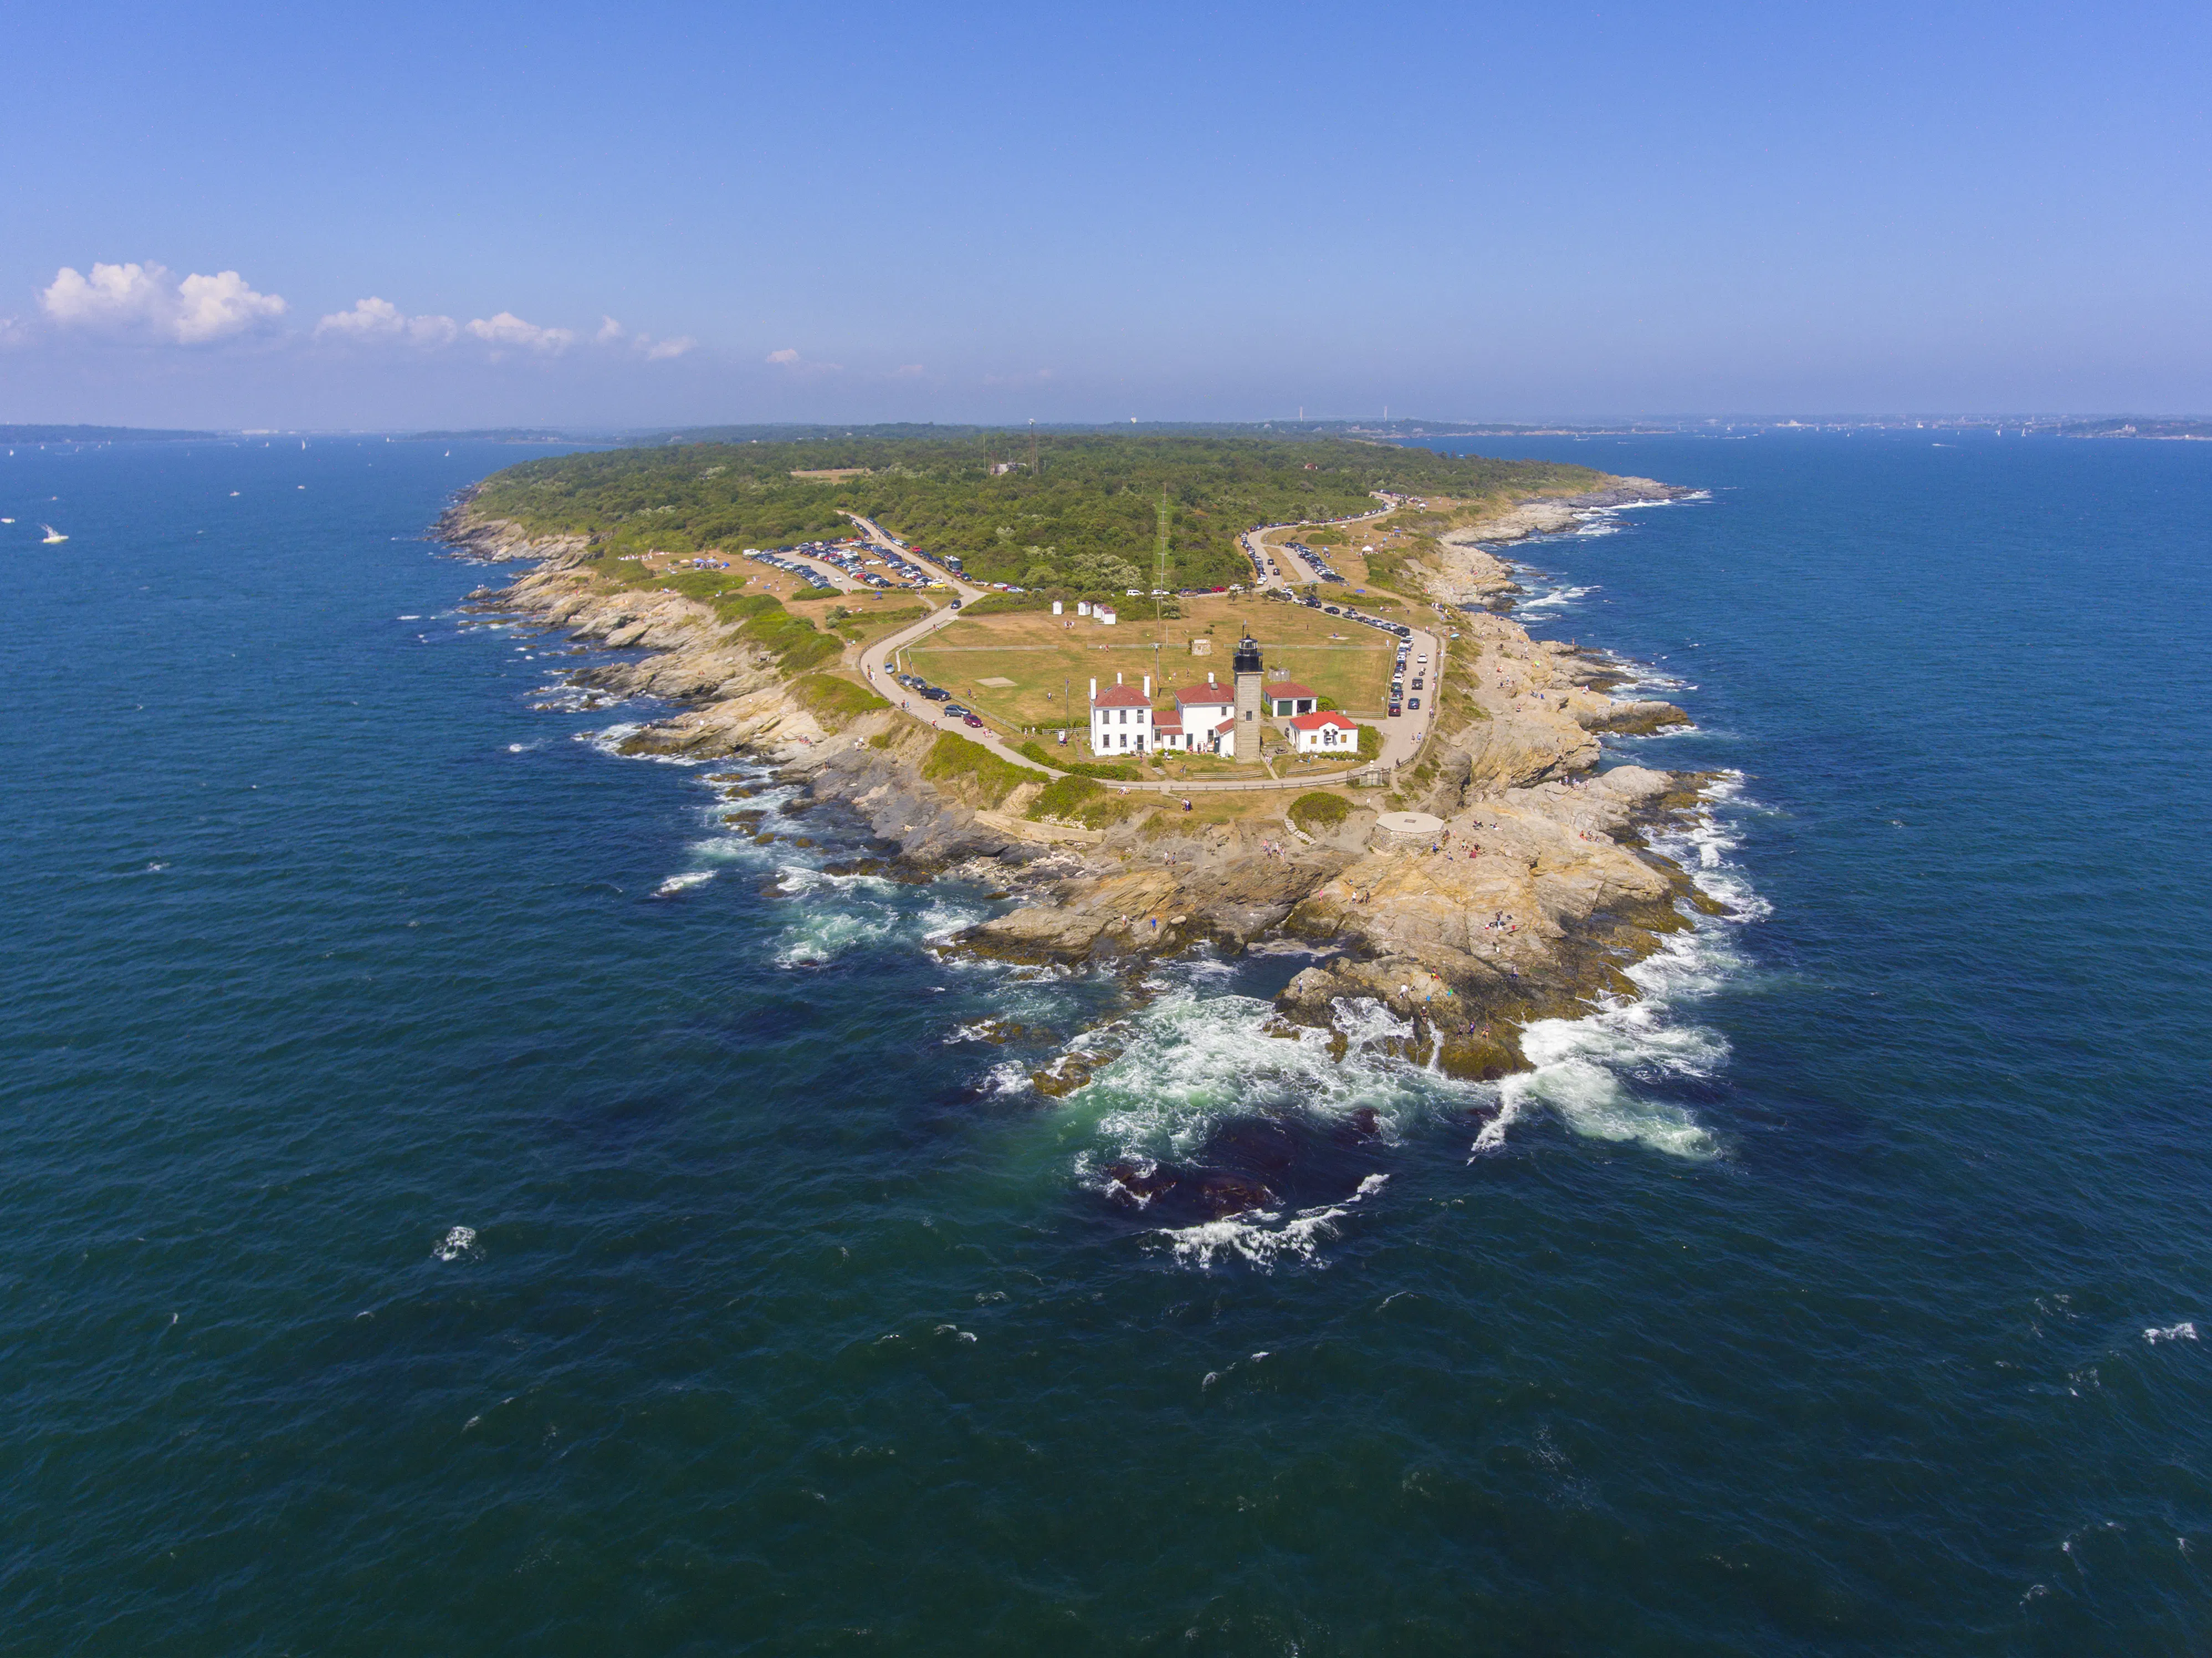
16. Jamestown
Market Score: 7.47
Average Annual Revenue: $44,548
Jamestown sits quietly between Newport and the mainland, offering lighthouse views and laid-back island vibes. Low saturation and higher-than-average property prices explain its muted Market Score, yet summer ADRs remain attractive.
15. Charlestown
Market Score: 13.63
Average Annual Revenue: $43,398
Charlestown’s unspoiled beaches and nature reserves appeal to eco-minded travelers. Limited commercial zoning keeps inventory tight, so growth potential hinges on responsible expansion and favorable zoning updates.
14. New Bedford
Market Score: 14.05
Average Annual Revenue: $38,756
Technically across the Massachusetts border, New Bedford offers historic seaport charm at lower home prices than many Rhode Island towns. It captures overflow demand from Newport events and Cape Cod traffic.
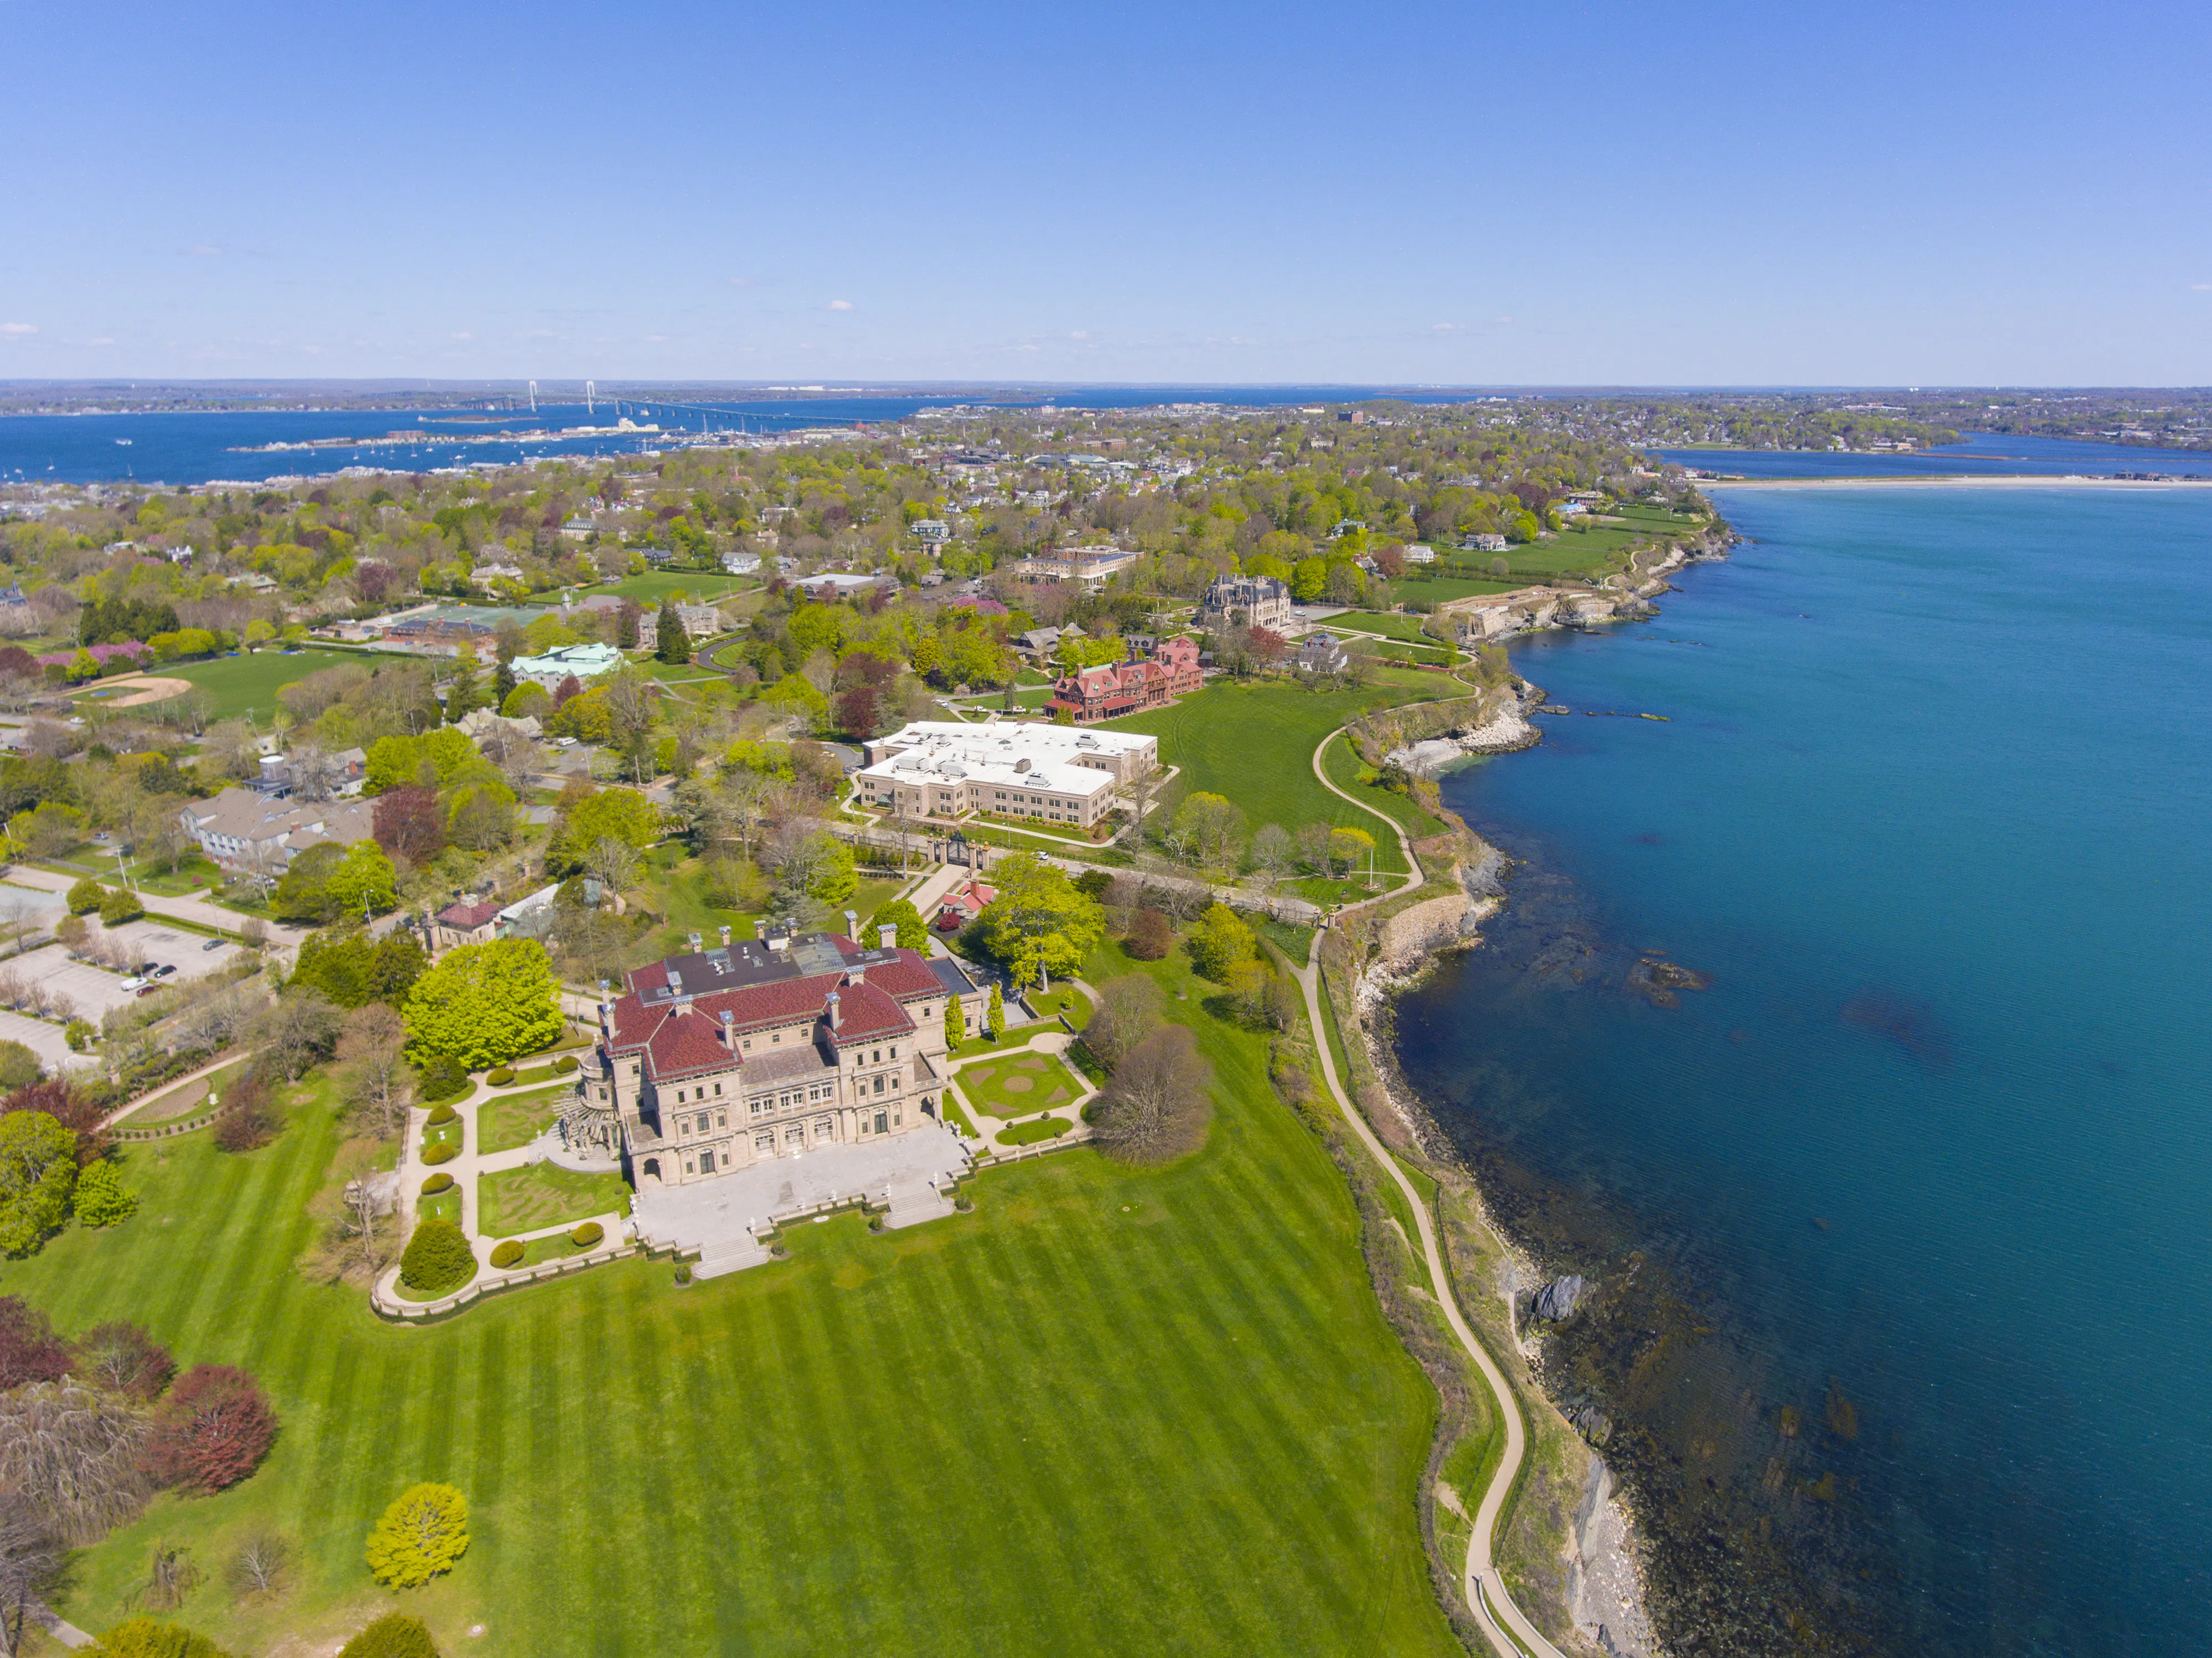
13. Newport
Market Score: 16.38
Average Annual Revenue: $56,633
Newport is Rhode Island’s tourism powerhouse, famous for Gilded Age mansions and sailing culture. High ADRs offset stringent regulations and steep acquisition costs; success often hinges on premium, experience-oriented listings.
12. Westerly
Market Score: 21.15
Average Annual Revenue: $44,953
Westerly, home to Misquamicut State Beach, captures family vacationers and music-festival crowds. Its southern location pulls renters from Connecticut and New York, though seasonality remains a revenue roller coaster.
11. Middletown
Market Score: 23.85
Average Annual Revenue: $79,522
Bordering Newport, Middletown offers beaches and vineyards without Newport’s sky-high licensing costs. Luxury homes close to Second Beach drive some of the state’s best summertime ADRs.
10. Wakefield
Market Score: 23.90
Average Annual Revenue: $49,560
Wakefield is the commercial heart of South Kingstown, balancing college-town energy from URI with coastal leisure demand. Investors enjoy diversified booking sources and mid-range home prices.
9. North Kingstown
Market Score: 25.40
Average Annual Revenue: $43,782
North Kingstown’s historic Wickford Village and ferry access to Martha’s Vineyard create off-season demand spikes. Moderate property values and commuter proximity to Providence elevate its long-term potential.
8. West Providence
Market Score: 25.98
Average Annual Revenue: $26,708
West Providence captures overflow from Downtown and nearby colleges at lower nightly rates. Consistent midweek bookings from hospital visitors bolster occupancy even when student traffic dips.
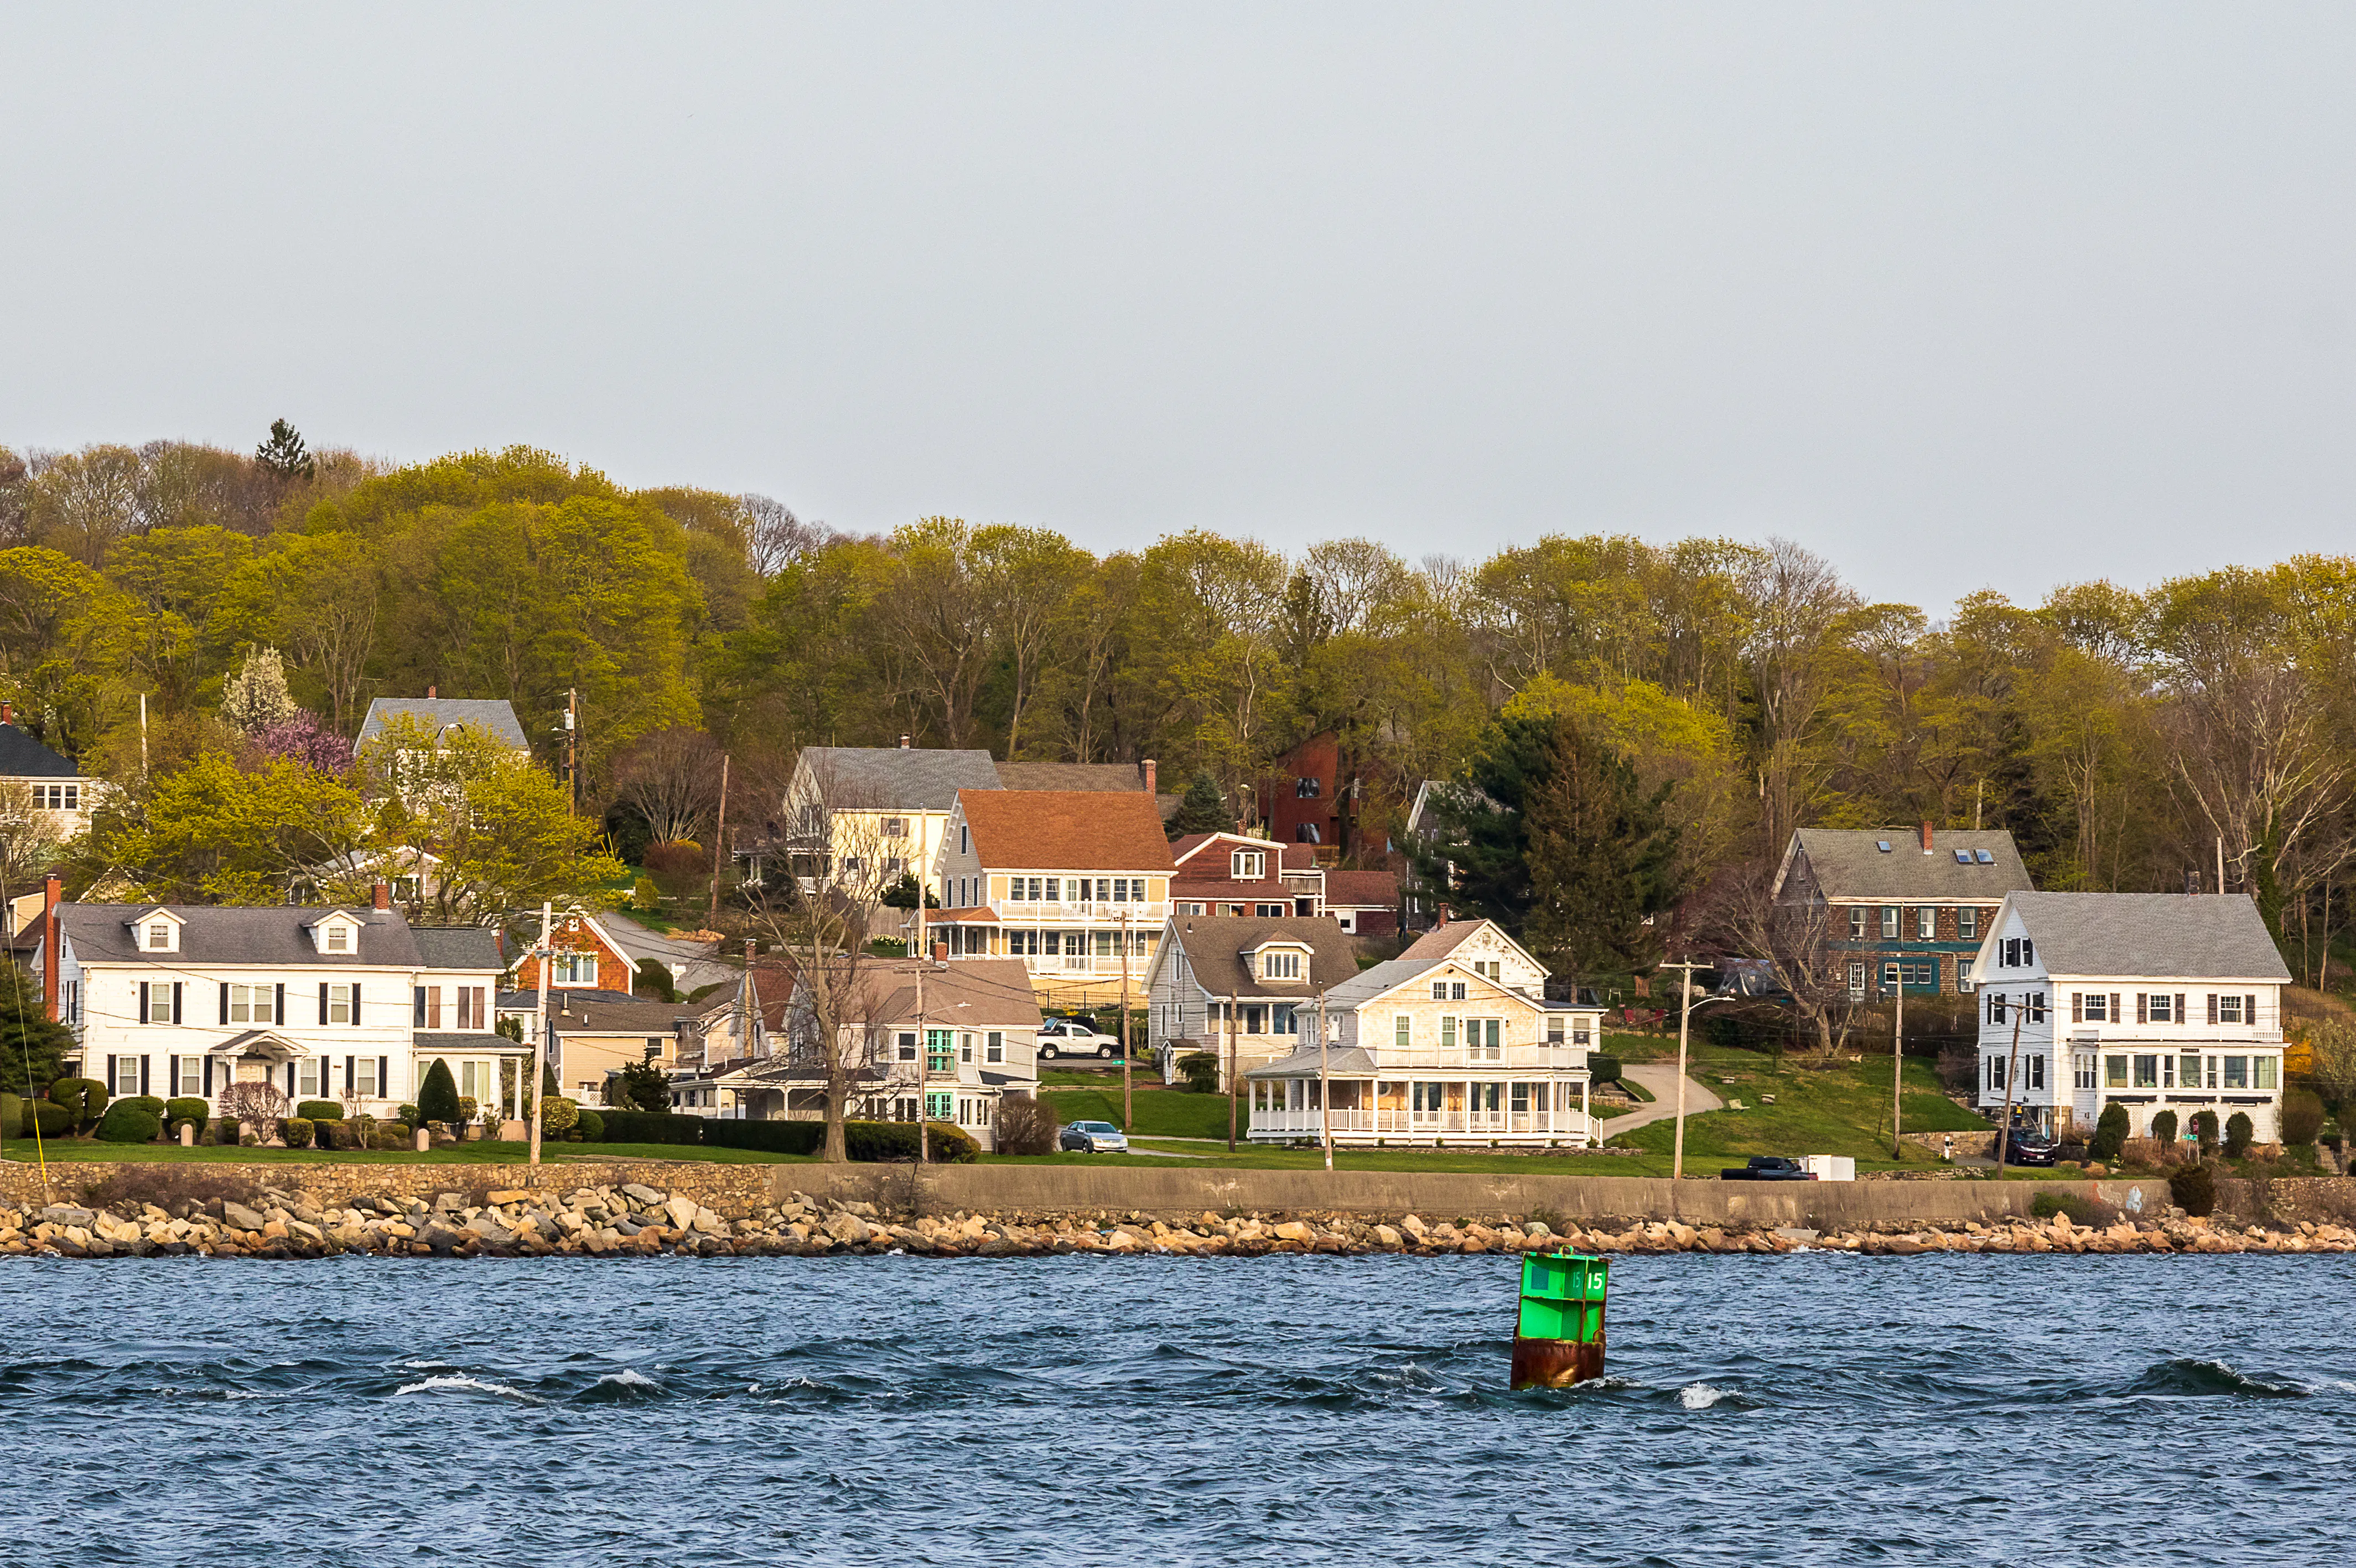
7. Tiverton
Market Score: 26.15
Average Annual Revenue: $48,864
Tiverton blends countryside farms with waterfront views of the Sakonnet River. Boutique STRs—think renovated barns or cozy cottages—command premium ADRs during foliage season and summer.
6. Block Island
Market Score: 29.40
Average Annual Revenue: $78,524
Accessible only by ferry or small plane, Block Island posts Rhode Island’s highest summer ADRs. The trade-off: limited seasonality, logistical challenges, and pricey real estate. Ideal for well-capitalized investors seeking marquee coastal assets.
5. Fall River
Market Score: 30.27
Average Annual Revenue: $28,088
Just north of the state line, Fall River benefits from I-195 commuter traffic and proximity to Providence, Newport, and Cape Cod. Lower home prices and emerging waterfront redevelopment projects keep its STR upside compelling.
4. Bristol
Market Score: 37.52
Average Annual Revenue: $48,562
Known for America’s oldest Fourth of July parade, Bristol draws patriotic summer crowds and marine enthusiasts year-round. Historic homes offer charm, while Roger Williams University supplies steady off-season demand.
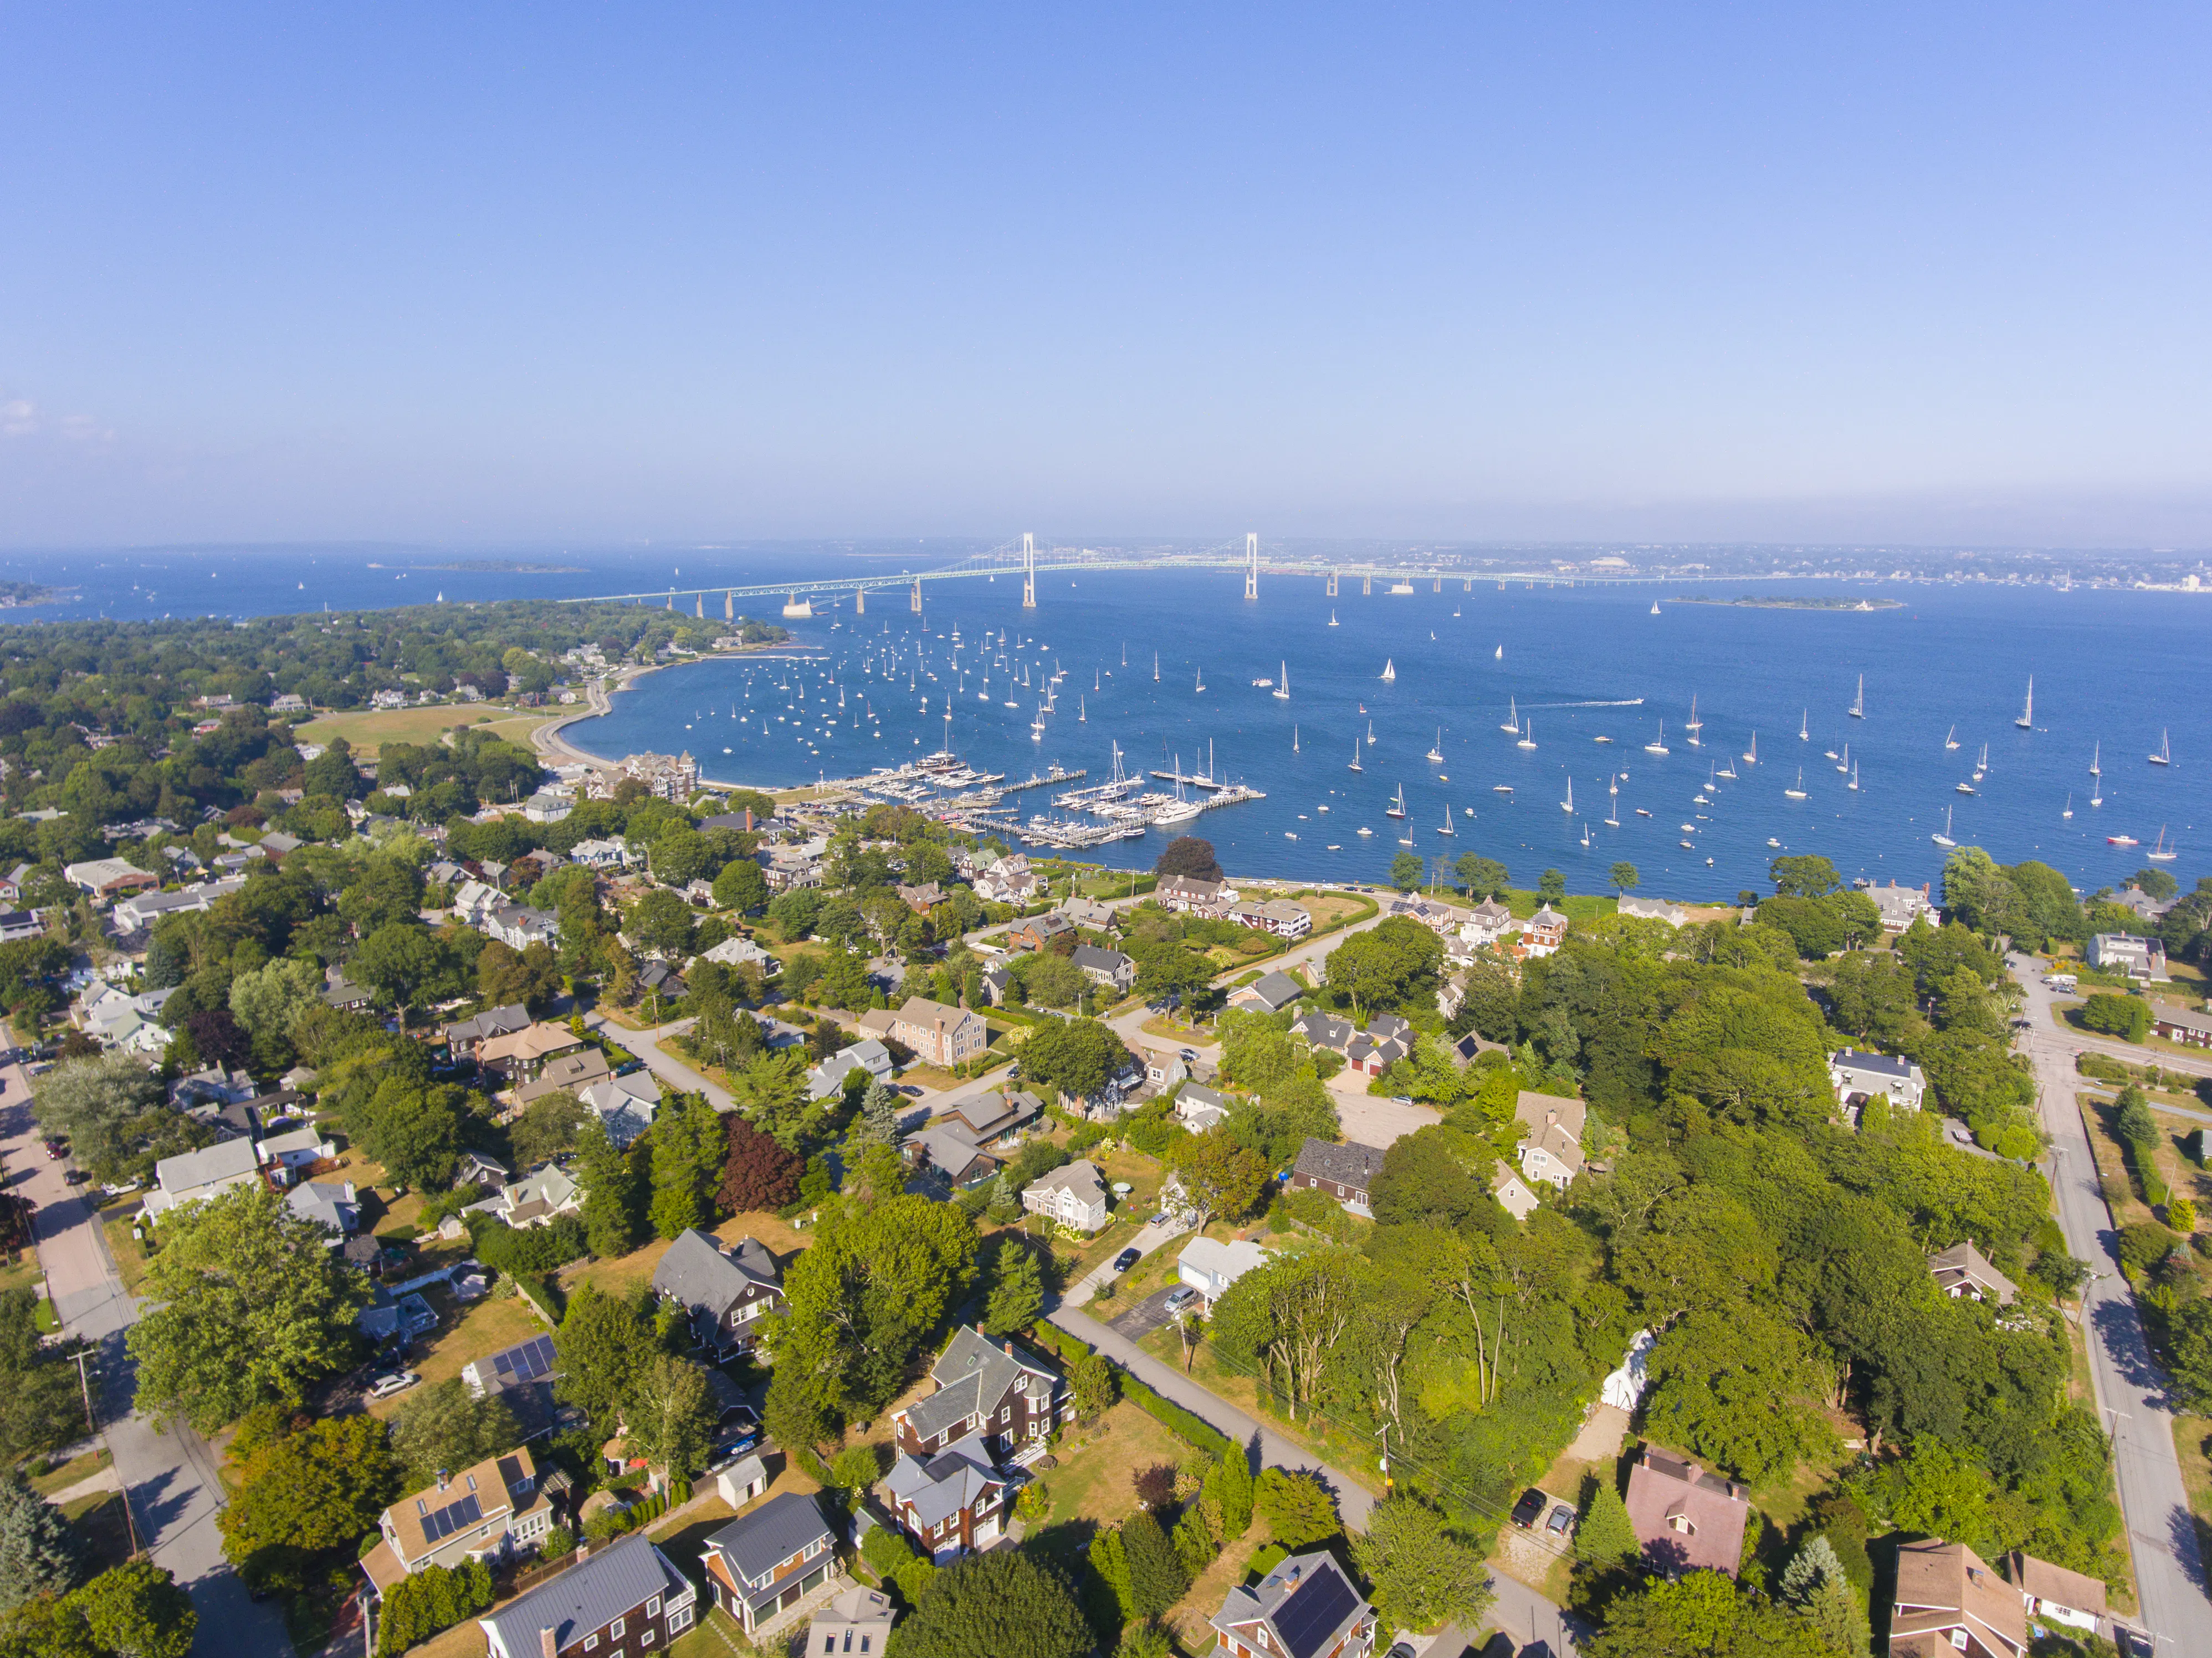
3. Narragansett
Market Score: 43.50
Average Annual Revenue: $64,213
Narragansett’s surf culture, seafood scene, and iconic towers yield some of the strongest coastal ADRs outside Newport. University rentals and shoulder-season festivals smooth occupancy dips.
2. Warwick
Market Score: 45.32
Average Annual Revenue: $32,573
Home to T.F. Green International Airport, Warwick is Rhode Island’s top gateway market. Reliable business travel, combined with waterfront neighborhoods like Conimicut, underpin year-round bookings and modest property costs.

1. Downtown Providence
Market Score: 70.51
Average Annual Revenue: $33,604
Downtown Providence outperforms thanks to multiple universities, a growing tech scene, and marquee events like WaterFire. Walkability and ample dining options sustain midweek occupancy, while favorable STR regulation relative to other Northeast cities boosts investability.
Should You Invest in Rhode Island?
For investors seeking a compact, drive-to market with diverse demand generators, Rhode Island checks many boxes. Coastal submarkets deliver impressive ADRs during peak season, while urban centers such as Downtown Providence offset seasonality with academic, medical, and business travel.
Entry costs vary widely—from premium Newport estates to value-focused West Providence condos—allowing investors to tailor strategies to their budgets and risk tolerances. Regulatory frameworks are generally navigable, though coastal towns enforce stricter permitting, so due diligence is critical.
With robust tourism growth, accessible transportation links, and a favorable host community, Rhode Island stands out as a small state offering big opportunities for short-term rental success.