U.S. Market Review: Occupancy Gap Tightens as Rates Meet Inflation
Published: October 19, 2022
Last updated: May 5, 2026

Scott Sage
The short-term rental (STR) industry in the U.S. had a strong September, with 18.4 million nights stayed. As the summer travel season winds down, demand has persisted—an impressive indicator of travel enthusiasm and pent-up demand as the pandemic moves off the front burner of concerns. September saw a new record for performance in the post-pandemic period, with total demand nights exceeding September 2019 levels by 26.6%.
Notably, September’s performance narrowed the gap between current occupancy and the high occupancies seen in 2021, with occupancy only 1.2% lower year over year. By comparison, the month of August showed a 4.4% lower occupancy year over year. The supply of total listings continues to increase, so the sturdiness of occupancy is a welcome sight for hosts and property managers in the industry.
Average daily rates (ADRs) continued with the strength seen over the summer months, growing 5.6% year over year and accelerating from the 2.7% year-over-year gains seen in August. Due to the rapidly increasing supply of listings in the first half of the year and high, persistent inflation, hosts have had a difficult time increasing rates beyond inflation. September marked the first month since April where ADR growth exceeded the growth rate of the consumer price index (CPI), which came in at 5.4% higher in September.
The increase in daily rates also helped to drive year-over-year RevPAR growth positive for the first time since April. The increases in supply and tough occupancy comparisons to 2021 had led to negative RevPAR growth throughout the summer, but in September, RevPAR grew 4.3% year over year.
At a Glance: Key U.S. Short-Term Rental Performance Metrics for September 2022:
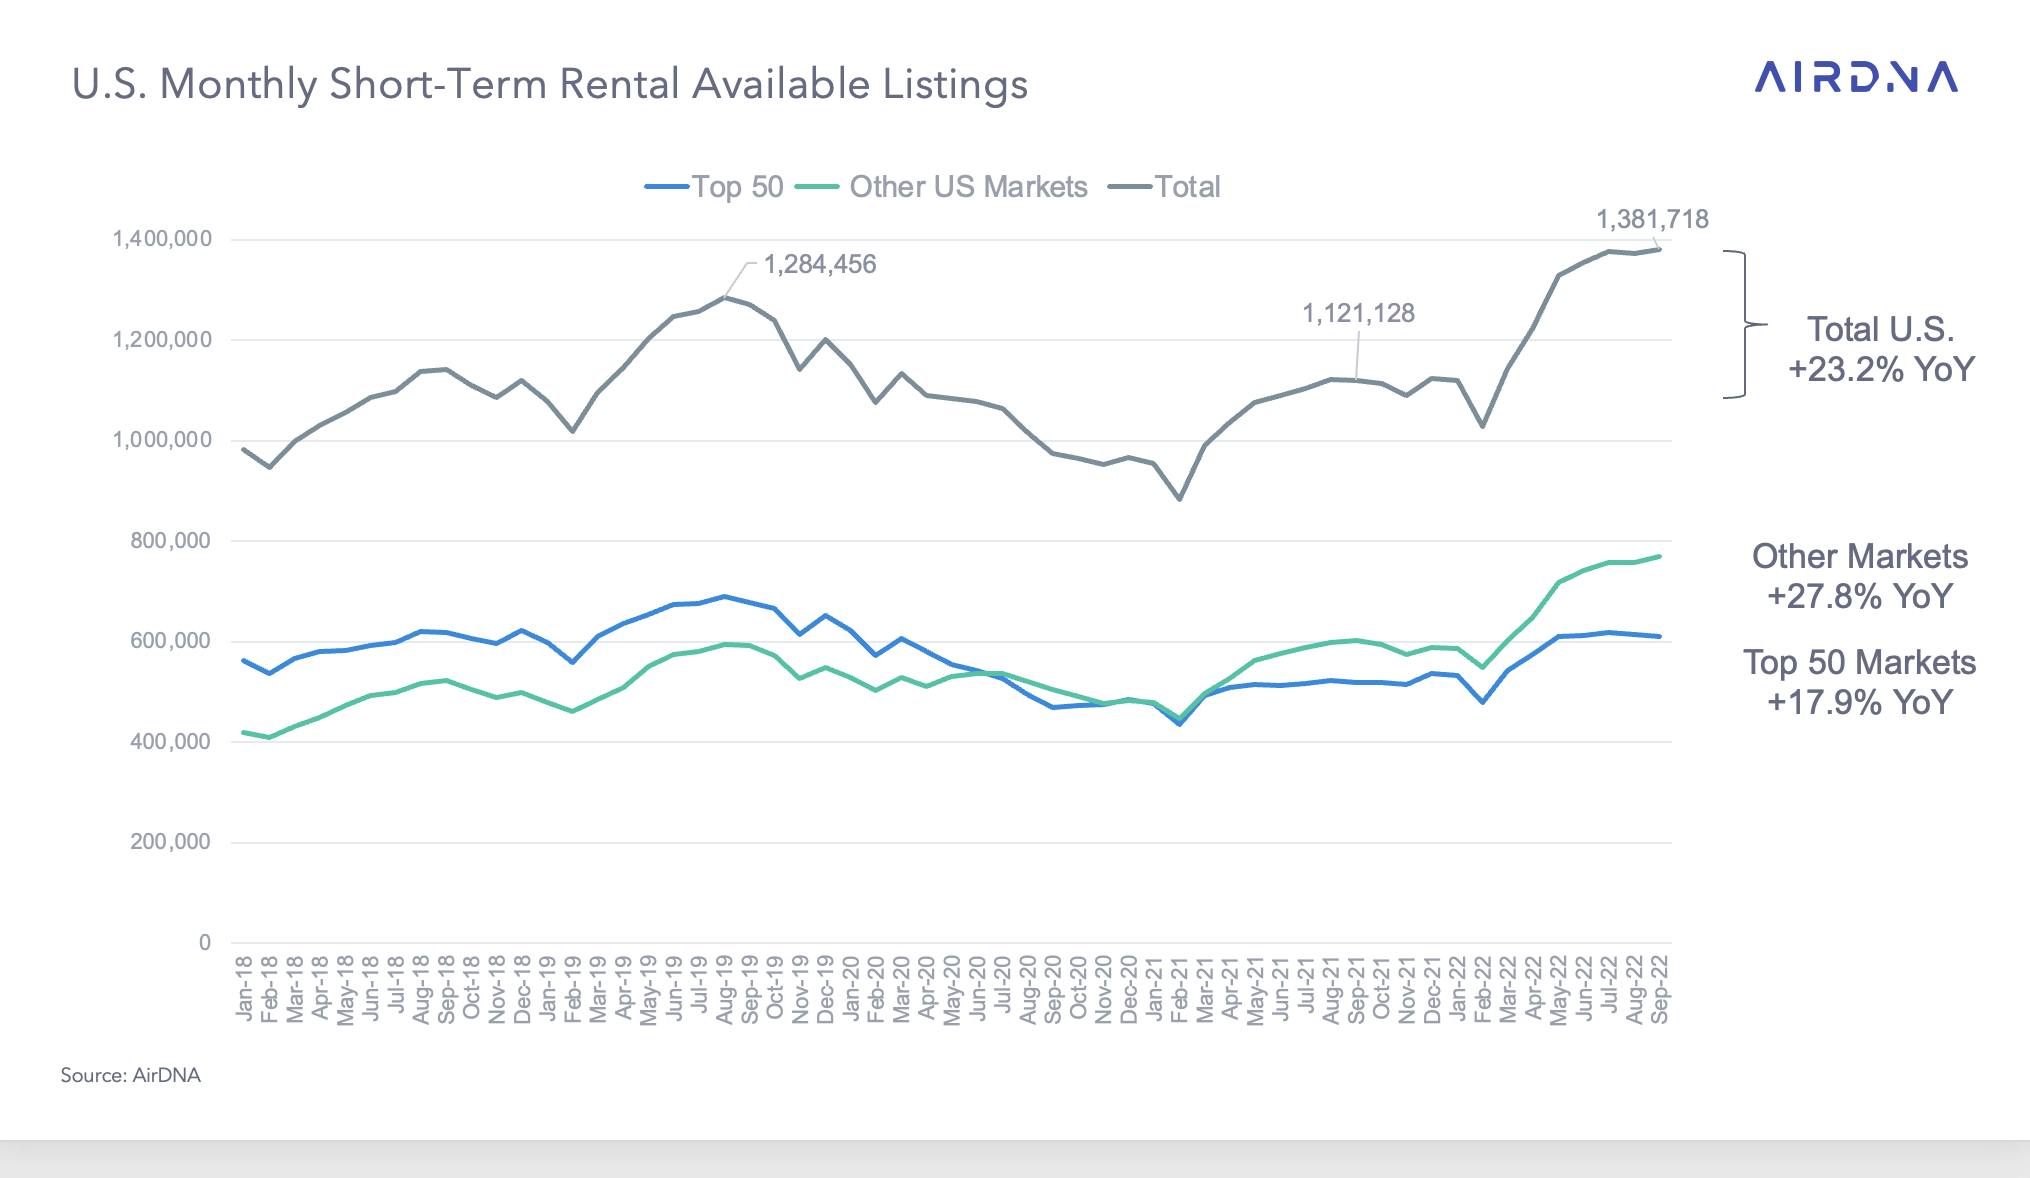
- Available listings reached 1.38 million – up 23.2% YoY and +8.7% vs. 2019
- Total demand rose 24.0% YoY and sits 26.6% higher vs. 2019
- Occupancy declined 1.2% YoY to 58.1% but is up +11.1% vs. 2019
- Average daily rates rose 5.6% YoY to $265 and are up 31.1% vs. 2019
- Total revenue was 31.0% higher YoY and is up 65.9% vs. 2019
- Nights booked for future travel were up 19.3% YoY to 15.8 million
Supply Growth Centered in Smaller Markets
Supply increased in September, adding to the strong performance seen through the summer months. September’s total was 7.5% higher than during the previous pre-pandemic peak of August 2019, as the STR industry remains in a secular growth pattern. Although the raw count was down slightly from August, September still brought more than 70,000 new listings to the STR market—the fifth consecutive month to do so.

It is useful to evaluate the top-50 U.S. markets separately from the rest of the country, as the growth in total listings—both from September and August 2019—can be attributed to the smaller markets. The top-50 has not yet recovered to 2019’s total number of listings, and listings actually fell slightly month over month among the 50 largest markets during September.
The large run-up in listings supply seen nationwide during the first half of 2022 was unevenly distributed in favor of smaller markets, with the top-50 markets rising 17.9% year over year and smaller markets up 27.8%.
Within the 50 largest markets, the biggest gains in new listings in September came from Texas and the Southwest, continuing the trend seen in August. The Phoenix/Scottsdale market was the fastest grower in the top-50, with 43.9% more listings year over year. Other markets with significant increases include Houston (+43.2%), San Antonio (+42.7%), and Las Vegas (+36.4%).
Unsurprisingly, rapid supply gains put pressure on occupancy rates in these four markets, which all saw lower occupancy year over year. Phoenix/Scottsdale and Houston occupancy declined by 9% and 8%, respectively. The nationwide U.S. occupancy rate in September of 58.1% was a lower reading year over year on tough comparisons, but the metric did make up considerable ground compared to August. Moreover, it exceeded the levels seen in 2020 and 2019.
Within the broad context of 2020 being an outlier year (due to the pandemic) and 2021 also having outlier properties (pent-up demand and lingering pandemic restrictions), the most salient comparison period for 2022 remains 2019. As the STR industry matures, hosts will look to see if occupancy can level off in the autumn and winter periods and form a smoother pattern throughout the year—something that 2021 showed a possible preview of.

The 2021 summer travel season was an exceptional one, driven by a mixture of pent-up demand and low supply levels. Despite the tough year-over-year comparisons, coastal and mountain location types were able to exceed 2021 occupancy levels in September—proof of their ability to maintain high occupancy levels further into the fall. Slowing supply growth, at 15.8% in coastal markets and 19.1% in mountain markets, has also helped to maintain occupancy levels.
Demand Reaches a Post-Pandemic Record
Demand continued its strong trajectory in September, posting a gain of 24% year over year, up from +18.9% in August. September produced the highest 2019-comparison growth reading since the beginning of the pandemic, with demand up 26.6% versus 2019. The STR industry continues to sit squarely in a secular growth pattern, and nowhere is it more evident than in aggregate demand.
September was aided by robust listing growth, gas prices down for the third month in a row, and universities resuming full schedules and football stadiums.
Although all U.S. regions had impressive year-over-year growth in the number of occupied nights, midsize cities had the strongest growth at +30%. Small cities and suburban locations were not far behind, with +27.9% and +27.6% growth, respectively.
The lowest growth rates in room nights were seen in coastal (18.6%) and mountain (22.6%) resorts, hindered by the aforementioned lower supply growth and comparisons to an outstanding 2021. But these regions have been the strongest performers versus the 2019 benchmark, with 40% demand growth since September 2019—up from +20% in the month of August.
Turning to the top-50 markets, hosts in the Southwest and Texas markets that added the most supply had it right, as these markets showed the strongest year-over-year demand growth, with Las Vegas (+37.9%) putting up the top city growth in the country.
Several Northeastern markets that had been slower to recover their leisure and hospitality markets also delivered high growth in year-over-year demand during September, including New York City (37.8%), Jersey City/Newark, New Jersey (36.4%), and Long Island, New York (32.5%). In time, the higher growth rates could allow these large metros to catch up with their pre-pandemic standing.

ADR Finally Beats Inflation
After a slow August for ADR growth, the September U.S. STR market posted its largest year-over-year growth rate since April. And most notably, the ADR growth outpaced the inflation rate (as measured by the CPI) for the first time since April.
All price tiers improved their growth rates vs. August, but the biggest monthly improvement came from luxury properties. After luxury property ADRs had declined 5.1% year over year in August, they declined only 0.2% in September.
Budget rental properties saw the largest growth rate, increasing 13.7% year over year, higher than their August rate of +13.1% and significantly higher than the 5.4% growth in the CPI. Economy rentals (+8.3%) also grew their ADR faster than inflation. Midscale properties almost crossed the inflation threshold, falling just short at 5.3% year-over-year growth.

All location types had higher ADRs on a year-over-year basis. The lowest growth rate of 2.5% was seen in mountain locations. The modest uptick can be most attributed to declining ADRs for luxury property ADRs within the region, which fell 3.7% year over year. A modest growth rate was also seen in small city/rural locations, with just 6.5% ADR growth in September.
Small cities and rural locations have been adding significant supply in the face of rapidly rising demand. The same is true for properties in midsize cities; both regions seem to be forming new supply/demand patterns that are divergent from their pre-pandemic profile, leading to higher overall revenue potential.
For these property types, revenue is much higher than 2019 levels—yet growth remains high. In contrast, urban and suburban locations have lagged in recovering and/or exceeding their 2019 levels, but if their recent uptick holds, they will claim new highs in the near future. Mountain and coastal resorts recovered—and then gained on—2019 levels quickly but could see slower growth rates in coming months as their demand normalizes.

Outlook Positive But Economic Factors Loom
Looking forward, the growth rate of new bookings slowed in September versus August, with 19.3% year-over-year growth in September compared to +29% year over year in August. Given the markedly weaker seasonality patterns in September vs. August, over 19% growth adds more support to the positive trend narrative within the STR industry.
Pacing has also seen some deceleration, although near-term reservation bookings still portend a strong October. With 14.4% more nights on the books than this time last year and with November (+17.2%) and December (+14%) both tracking well, the close to 2022 looks to be a good one.
Looking at the coming months, the forward booking growth looks less optimistic so far for 2023. Economic uncertainty rears its head as travelers consider how to budget and plan for intermediate-term stays. For 2023, January (+8.2%), February (+11.4%), and March (+9.1%) bookings were all higher than in 2022 as of the beginning of October, but the rate of growth has slowed.

The domestic traveler is still showing signs of pent-up demand, as evidenced by Transportation Security Administration (TSA) reporting that 2.495 million travelers went through TSA checkpoints on October 15 – the most travelers in one day since February 11, 2020, just one month before the world went into pandemic lockdown.
Energy price shocks, rumblings from Russia, and approaching—and contentious—U.S. elections all add to a murky backdrop in the fourth quarter. Still, the strong September economic data on consumer spending, job growth (+263,000 jobs), and the innumerable positive experiences of guests during a tremendous 2022 travel season are notable tailwinds for the U.S. rental market.

How to Become an Airbnb Superhost
Being a Superhost is about more than bragging rights alone. What does it mean and how can you achieve it?
Market Insights
Become an expert in your market: price smarter and boost your occupancy with AirDNA's MarketMinder™.

How to Manage Like a Pro
Don't fear remote Airbnb management. It's easier than you think—and plenty of hosts are already doing it and seeing great returns.
ARTICLE SUMMARY
AirDNA’s latest market review shows another record month for short-term rental demand in the U.S., with 26.6% more nights stayed than the same month in 2019. This was the strongest month for demand growth compared to 2019 levels since the start of the pandemic.
Scott Sage
Senior Vice President, Marketing & Customer Experience
Scott is an Airbnb Superhost and industry pro, having founded Home Base BnBs—a short term rental management company that scaled to 200+ units. Scott combines his experience and passion for hosting to empower AirDNA customers' success. When he's not thinking about STRs, he is hiking, playing basketball, or playing pickleball.