


The $99 Myth: Does Charm Pricing Work for Short-Term Rentals?
Published: November 19, 2026

Camilo Schmid Rivas

Pricing a night at $99 instead of $105 is a long-standing rule of thumb in short-term rentals. Borrowed from retail shelves and called charm pricing, it assumes guests read $99 as “ninety-something” and book enough extra nights to make up the lower rate.
AirDNA tested the rule on the booked nights of US entire homes listed on Airbnb in the twelve months to September 2026, and the occupancy gain did not cover the lower rate. Listings priced at $95–99 a night ran occupancy of 59.5% compared to 58.7% for similar listings priced at $100–104, +0.8 points, while making up the lower rate needed +2.8 points. Revenue per listing came out −1.6%.
Guests still respond to price, just not to a round number. The hosts who earned more over the same twelve months were the ones whose prices moved with demand, not the ones who stopped at $99.
Key takeaways
- Charm pricing barely moved occupancy: $95–99 listings gained +0.8 points over $100–104, short of the +2.8 needed.
- The same held at $200 to $500, in 2-night stay totals and in Germany, where most hosts price by hand.
- Guests respond to price most in low season, so discounts pay in quiet weeks rather than all year.
- Dynamic pricers ran occupancy +7.7 points and RevPAR +11.4% higher than static pricers in the US.
How US Hosts Price Today: Round Numbers Beat Charm Prices
In the twelve months to September 2026, 16.1% of booked nights in US entire homes carried a nightly price ending in 0, 13.7% ending in 5, and 12.1% ending in 9, compared to 10% for each digit if endings were random, so hosts priced to round numbers more than to charm prices ending in 9. $100 was booked on 1.44 million nights compared to 1.33 million at $99, and $200 on 1.52 million compared to 1.08 million at $199, which shows no reluctance to cross into three digits.
Booked nights at each nightly price from $80 to $119, US entire homes on Airbnb, October 2025 to September 2026. Source: AirDNA. Hover a bar for details.
Broken out by price, booked nights cluster on round prices and on prices ending in 9, and $100 is the most booked single price around the line. How much that line matters depends on the market. Nightly prices of $75–124 held 18.8% of US booked nights, rising to 27.5% in small cities and rural areas, so the $100 line matters most in smaller markets.
Resort markets sit well above that range, with coastal markets selling only 9.9% of their booked nights at $75–124 and mountain and lake markets 11.0%, while 40.8% and 35.9% of their nights sold at $300 or more. Since few of these hosts price near $100, AirDNA ran the same test at $200, $300, $400 and $500, comparing, for example, listings at $190–199 to those at $200–209. The higher lines gave the same answer: coastal and mountain listings priced just under each line ran occupancy +0.3 to +1.0 points higher than those just over it, short of the +2.1 to +2.7 points needed to make up the lower rate, and revenue per listing came out −1.0% to −2.0%.
Hosts differ as much in how often they change prices as in where they set them. Among US entire homes available in the twelve months to September 2026 with a reliable score on AirDNA’s price variability index, which measures how often and how finely a listing’s prices change, 46.9% priced dynamically, 15.9% followed rules such as separate weekday and weekend rates, and 37.2% priced statically or by hand. More than a third of listings therefore hold a price their host sets and rarely revisits, which is where a charm price like $99 would have to do its work.
What guests see when they compare those prices has changed too. Since May 12, 2025, the FTC rule on junk fees has required short-term rental platforms to show the total price, including mandatory fees, more prominently than any other price. Two-night stays were the most common length in the twelve months to September 2026 (27.7% of stays), ahead of three nights (23.2%), so a guest searching a weekend compares stay totals with cleaning and fees rather than a nightly rate ending in 9. AirDNA therefore also tested 2-night stay totals, including cleaning and fees, at lines from $200 to $1,000, and no line showed a larger occupancy gain just under it than the gain between neighboring price bands.
How AirDNA Tested Charm Pricing
The test grouped listings by the nightly rates hosts set on the nights that were booked rather than by ADR, which adds cleaning fees and removes platform host fees and so is not the price a host sets. It covered 45.2 million stays in an average of 1.25 million available US entire homes listed on Airbnb between October 2025 and September 2026. Asking prices on unsold nights were left out because pricing tools change them daily, most of all in the last days before a stay.
Each listing was placed in a $5 price band by the median nightly rate its host set on booked nights that season, before cleaning, Airbnb’s fees and taxes. That is the number a host chooses when pricing at $99, rather than the stay total a guest sees. Every band was then compared to listings priced just over the line ($100–104) in the same market, location type, bedroom count, property type and season, so a $99 studio in a small city is compared to $100–104 studios in the same city, not to beach houses.
The comparison covers occupancy, RevPAR, revenue per listing over the year, and booking lead time (the average number of days between booking and check-in). Listings at $95–99 charged 4.5% less a night than those at $100–104, so they needed about +2.8 points of occupancy to hold RevPAR, the point at which the extra bookings would make up the lower rate.
If $100 worked as a psychological threshold, the change in occupancy across it would be larger than between neighboring bands, and larger than at a control line such as $150, where no digit count changes. Every result below is an observed average for matched groups.
Charm Pricing Test Results: There Is No Line at $100
| US entire homes, twelve months to September 2026 | $95–99 | $100–104 | Change |
|---|---|---|---|
| Occupancy | 59.5% | 58.7% | +0.8 pts |
| Occupancy gain needed to hold RevPAR | +2.8 pts | ||
| RevPAR | −2.8% | ||
| Revenue per listing, a year | $19,228 | $19,548 | −1.6% |
| Booking lead time | 41.6 days | 41.5 days | +0.1 days |
Source: AirDNA
Occupancy rose by about the same amount for every 5% cut in price on either side of $100, so the line sat on a gentle slope rather than at the edge of a cliff. At $150, where no digit count changes, the gap was also +0.8 points, and at the $200 and $300 lines it was +0.6 and +0.7 points. Lead time of 41.6 days compared to 41.5 shows that $99 did not pull bookings forward either.
Occupancy change for each $5 price band compared to listings priced $100 to $104, with the change needed to hold RevPAR. Source: AirDNA. Hover a bar for details.
Explore Every Price Line: Is the Line a Cliff or Part of a Slope?
Pick a price line, a metric and one filter to see how listings in each price band perform compared to similar listings just over the line.
| Price band | Occupancy | ADR | RevPAR | Revenue per listing | Booking lead time | Occupancy needed to hold RevPAR |
|---|---|---|---|---|---|---|
| $80–84 | +3.8 pts | −17.7% | −12.4% | −10.3% | −2.8 days | +13.6 pts |
| $85–89 | +2.8 pts | −13.1% | −8.8% | −6.6% | −2.1 days | +9.7 pts |
| $90–94 | +2.1 pts | −8.6% | −5.4% | −3.4% | −1.7 days | +6.2 pts |
| $95–99 | +0.8 pts | −4.1% | −2.8% | −1.6% | +0.1 days | +2.8 pts |
| $100–104 | 0.0 pts | 0.0% | 0.0% | 0.0% | 0.0 days | 0.0 pts |
| $105–109 | −0.3 pts | +4.8% | +4.2% | +4.9% | −0.4 days | −2.8 pts |
| $110–114 | −1.0 pts | +8.3% | +6.6% | +7.0% | −0.1 days | −5.0 pts |
| $115–119 | −1.7 pts | +12.7% | +9.6% | +10.1% | −0.2 days | −7.3 pts |
US entire homes on Airbnb in eight nightly price bands around each line (5% of the line wide), each compared to similar listings just over the line (same market, location type, bedrooms, property type and season), stays October 2025 to September 2026. Occupancy and the change needed to hold RevPAR are in percentage points, lead time in days, everything else in percent. Price bands use the median nightly price guests paid. ADR and RevPAR are what hosts earn per booked and per available night, including cleaning and after platform host fees. $150 and $250 are controls where no new digit appears. Source: AirDNA
At a 2-night stay total of $200, occupancy was +0.4 points higher just under the line than just over it, short of the +2.1 points needed, so guests did not react to round totals either.
Since September 15, 2026 every US Airbnb host pays the host-only fee, so guests pay no fee on top of the host’s nightly rate, although the price they see still adds cleaning. Most bookings in the study were still split-fee, with host-only listings rising from 5.0% of booked nights in October 2025 to 64.1% in September 2026. Host-only listings showed no larger gap at $100 than split-fee listings, where the guest fee turned a $99 rate into about $113 a night before cleaning, which points to no $99 effect returning now that the guest fee is gone.
The 9 loses its pull for three reasons: guests compare stay totals, and two nights at $99 plus a $60 cleaning fee is already $258 before taxes; search results lead with that total; and guests weigh location, photos and reviews alongside price. Price therefore works as a slope, where every dollar counts a little, rather than as a threshold, and for hosts $99 buys a lower rate and almost nothing else.
Germany: Less Dynamic Pricing, Same Answer
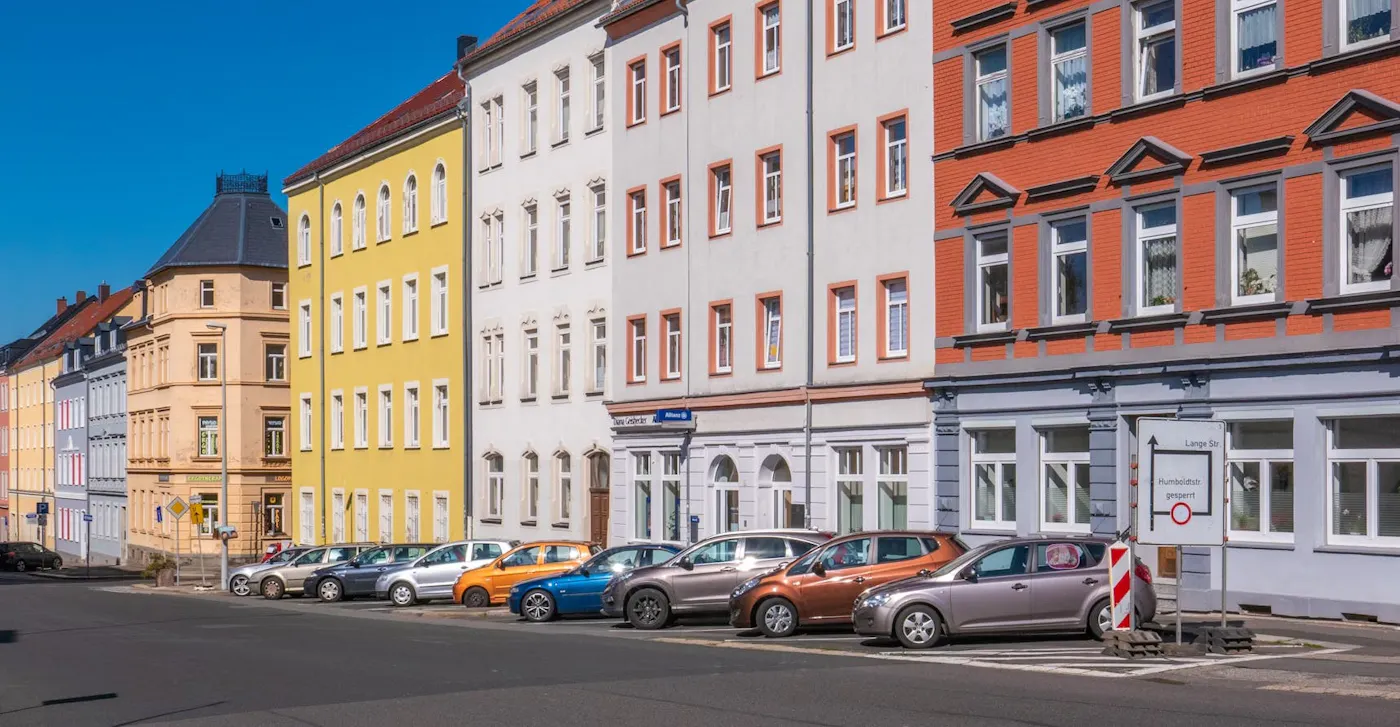
In the twelve months to September 2026, 70.8% of German entire homes with a reliable price variability score were priced statically or by hand, compared to 37.2% in the US, and only 14.0% were priced dynamically, compared to 46.9%. That makes Germany a natural stress test, since charm pricing should work best where most hosts set prices by hand.
German listings at €95–99 a night ran occupancy of 55.9% compared to 55.4% at €100–104, +0.6 points, short of the +2.6 points needed to make up the lower rate. ADR came out −4.2%, RevPAR −3.3%, and revenue per listing €14,229 compared to €14,514, −2.0%. The €50 and €200 lines showed gaps of +0.6 and +0.5 points and the €150 control line +0.1 points, so €100 was no more special to German guests than $100 was to US guests.
Pricing type mix in Germany and the US, and the occupancy change at each euro price line in Germany. Source: AirDNA. Hover a bar for details.
Each 5% lower price added +0.6 points of occupancy at the €100 line in Germany compared to +0.8 points at $100 in the US, and the two converged at higher price points, so German guests responded to price about as much as US guests. They booked further ahead, 74.9 days before check-in compared to 41.6 days in the US around the 100 line.
Hand-set pricing did not make the round number work in Germany. It left more listings on one price through seasons in which guests respond very differently, and that is where price does matter.
Guests Respond to Price Most in Low Season
In the US, each 5% lower nightly price around $100 added +1.0 points of occupancy in low season, each market’s three quietest months by demand nights, compared to +0.6 points in high season, its three busiest, over the twelve months to September 2026. Listings priced just over the $100 line, at $100–104, were already 66.6% full in high season compared to 52.2% in low season, so a lower price had far less room to add bookings at the peak.
Hand-set listings responded most, gaining +1.1 points per 5% lower price in low season and +0.8 points in high season, compared to +0.9 and +0.5 points for dynamically priced listings. That pattern is consistent with a fixed price sitting too low in peak weeks and too high in quiet ones, where it meets the most price-sensitive guests. German dynamic pricers showed the same seasonal swing (+0.3 points in high season, +0.8 points in low season), while hand-set German listings responded evenly through the year (+0.8 to +0.9 points).
Occupancy points gained per 5% lower nightly price around $100, by season and pricing type, US entire homes. Source: AirDNA. Hover a bar for details.
Revenue per listing at $95–99 beat $100–104 only in quiet periods: in low season in US small cities and rural areas (+2.8%) and in mountain and lake markets (+1.8%). A lower price pays when there is spare capacity to fill, which makes the case for a price that changes with the season rather than one fixed at $99.
The Real Lever: Dynamic Pricing Lifted Occupancy 7.7 Points
| Dynamic compared to static pricers, twelve months to September 2026 | US | Germany |
|---|---|---|
| Occupancy, dynamic pricers | 57.2% | 63.3% |
| Occupancy, static pricers | 49.5% | 56.6% |
| Occupancy change | +7.7 pts | +6.7 pts |
| ADR | −6.0% | +17.0% |
| RevPAR | +11.4% | +33.4% |
Listings compared within the same market, location type, bedroom count, property type, season and host size. Source: AirDNA
A fixed 5% discount to $99 bought +0.8 points of US occupancy, while pricing that followed demand produced +7.7 points, nearly ten times as much, and RevPAR gains of +11.4%, whereas $99 pricing cost −2.8% of RevPAR.
In US low season, dynamic pricers ran ADR −12.7% compared to static pricers, cutting price in the months when guests respond most, while in high season they held ADR level (+0.4%) and still sold more nights, so their prices moved with demand in both directions.
Occupancy and RevPAR lead of dynamic over static pricers by season, US and Germany. Source: AirDNA. Hover a bar for details.
The RevPAR lead of dynamic pricers was smallest in US low season, when they traded rate for nights.
German dynamic pricers ran occupancy +6.7 points and ADR +17.0% compared to static pricers, in a market where only 14.0% of listings price this way, which points to how much revenue hand-set pricing leaves unclaimed in Germany. Rule-based pricing, such as separate weekday, weekend and seasonal rates, ran +3.1 points of occupancy and RevPAR +5.0% in the US and +3.1 points and +12.1% in Germany, about halfway to dynamic pricing, which makes it a first step for hosts not ready for a full pricing tool.
The comparison holds market, size, season and host size equal, but hosts who adopt dynamic pricing may also run their homes differently, so these figures describe what dynamic pricers achieved rather than a guaranteed uplift. The pattern still held in both countries and in every season, which points to a price that follows demand every night, rather than where the price ends, as the real lever on occupancy, RevPAR and revenue.
4 Tips From Adapt’s Founding Revenue Manager
Jessica Spinks is the founding revenue manager of AirDNA’s Adapt and spent more than eight years pricing vacation rentals for professional operators. Here’s what she had to say:
“If you still price to $99, here’s what I’d do instead:
- Keep the dollars. $99 buys less than a point of occupancy over $100–104.
- Save discounts for slow weeks. Guests respond to price most in your quietest months.
- Check your total. Guests compare the stay total, cleaning included, rather than your nightly rate alone.
- Let your price move. Set a floor and a ceiling, switch on a pricing tool, and give it a season.”
Pricing that plays by your rules
Set your minimums, maximums, and stay rules once. Adapt prices every night inside them.
Pricing that plays by your rulesFAQs
What is charm pricing?
Charm pricing sets a price just below a round number, such as $99 instead of $100, on the idea that buyers read the first digit and see a lower price. Retailers use it widely, and many short-term rental hosts borrowed it for nightly rates.
Does charm pricing work for Airbnb?
Not in AirDNA’s data. US entire homes priced at $95–99 a night ran occupancy of 59.5% compared to 58.7% at $100–104, a gain of 0.8 points when 2.8 points were needed to make up the lower rate, so revenue per listing came out 1.6% lower.
Should I price my vacation rental at $99 or $100?
At $100 or above, unless it is a quiet period with spare nights to fill. Listings at $95–99 beat $100–104 on revenue only in low season in US small cities and rural areas (+2.8%) and in mountain and lake markets (+1.8%).
Do guests react to round stay totals instead?
No. At a 2-night stay total of $200, occupancy was 0.4 points higher just under the line than just over it, short of the 2.1 points needed, and no line from $200 to $1,000 showed a larger jump than between neighboring price bands.
What moves short-term rental revenue more than charm pricing?
Pricing that follows demand. In the US, dynamic pricers ran occupancy 7.7 points higher and RevPAR 11.4% higher than static pricers in the same market, size and season. In Germany the gaps were 6.7 points and 33.4%.
ARTICLE SUMMARY
Does charm pricing work for short-term rentals? AirDNA tested $99 nightly rates against $100–104 across 45.2 million US Airbnb stays and in Germany. The lower price barely moved occupancy and cut revenue, while hosts who priced with demand earned more.
Camilo Schmid Rivas
Senior Research Analyst
Camilo Schmid Rivas is a Senior Research Analyst at AirDNA who brings a uniquely well-rounded perspective to short-term rental analytics. With a background that spans investment, real estate, and business analysis—including roles at Stayery and Sollers Consulting—Camilo has worn many analyst hats, each sharpening his ability to turn complex data into clear, actionable insights. A graduate of École hôtelière de Lausanne, he now channels his multidisciplinary expertise into uncovering trends that drive smarter STR decisions. In his free time, he enjoys playing tennis or scuba diving in or around Barcelona.
Related





Get started with AirDNA today.
Powerful, easy-to-use tools that help hosts and investors succeed in the short-term rental market.
Try for free